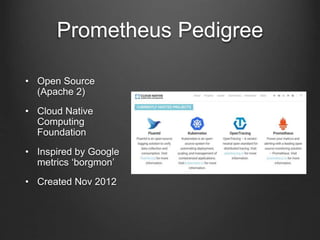
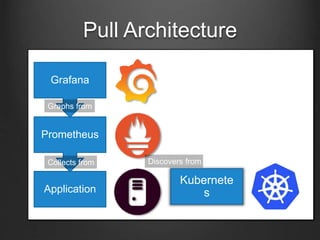
Prometheus is an open-source monitoring tool that collects multi-dimensional metrics for infrastructure and application performance, enabling engineers to build dashboards and alerts effectively. It features a pull model for metrics gathering, service discovery capabilities, and integration with tools like Grafana for visualization. Prometheus's design is efficient, self-contained, and does not rely on external databases, allowing it to function reliably even under adverse conditions.


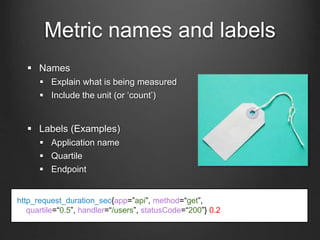
![PromQL examples
All current request duration
http_request_duration{app=“apiContetnt”}
How many envs in a pool are available?
env_pool_count{envtype=“domo/brief/master”} –
env_initing_count{envtype=“domo/brief/master”}
What are my non-success request rates?
sum(irate(http_request_duration_milliseconds_count{app=”a
piContent”, statusCode!=“200”}[1m])) by (statusCode) * 60](https://image.slidesharecdn.com/prometheussamu-170407044007/85/Prometheus-Utah-Software-Architecture-Meetup-Clint-Checketts-28-320.jpg)


![Aengus Rooney [Grafana] | What's New with Grafana and InfluxDB | InfluxDays E...](https://cdn.slidesharecdn.com/ss_thumbnails/aengusrooneyslides-210511204556-thumbnail.jpg?width=640&height=640&fit=bounds)