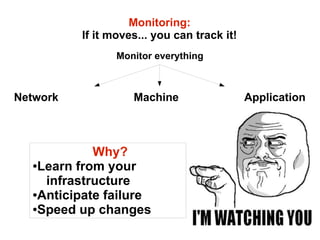
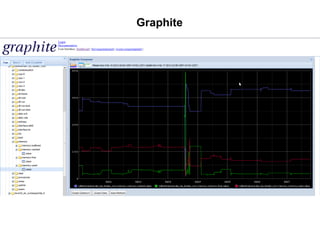
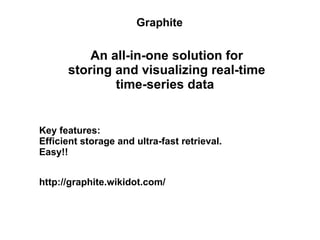
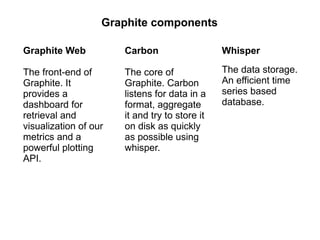
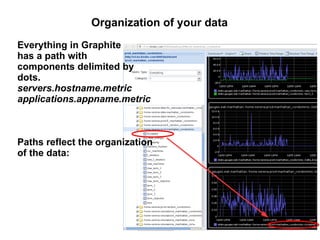
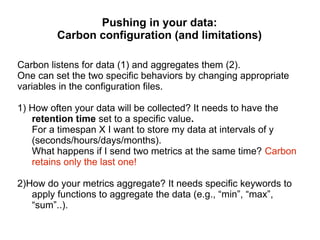
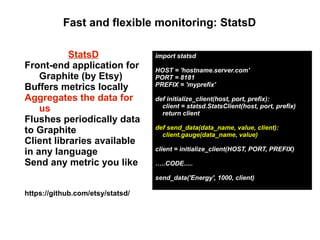
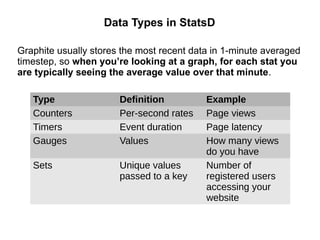
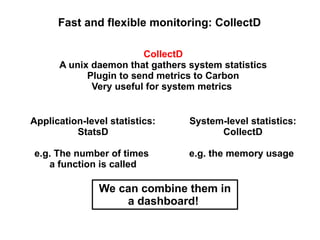
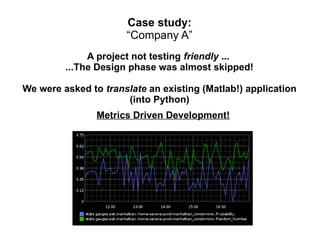
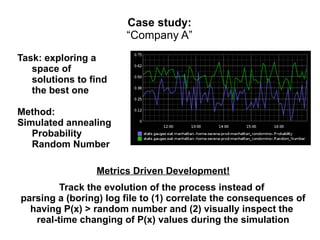
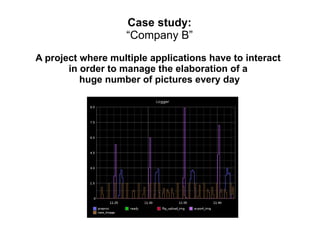
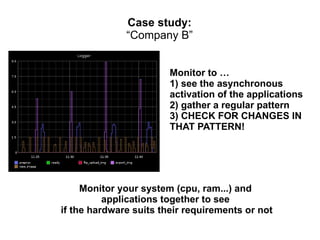
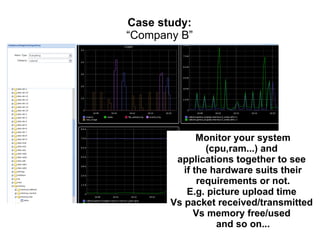
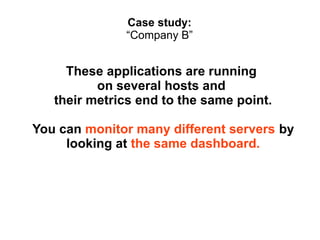
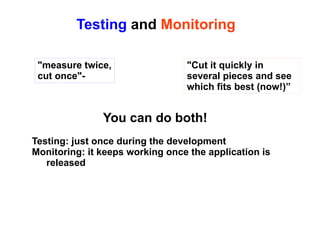
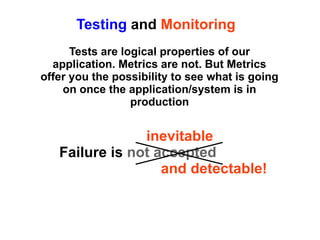
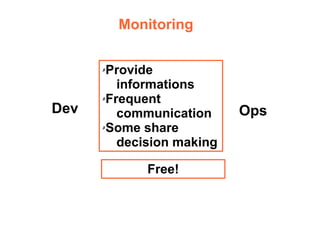
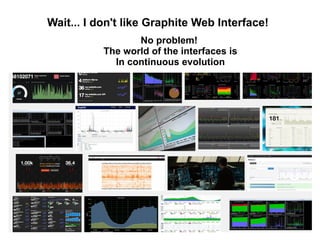
"Monitoring as Software Validation"
Measure anything,
Measure everything

Serena Lorenzini
serena@biodec.com

Incontro DevOps Italia
Bologna, 21 Feb. 2014
Monitoring:
If it moves... you can track it!
Monitor everything

Network

Machine

Why?
●Learn from your
infrastructure
●Anticipate failure
●Speed up changes

Application
Metrics and Events
Metric: Time + Name + Value
Event: Time + Name

It can be anything
Graphite
Graphite

An all-in-one solution for
storing and visualizing real-time
time-series data

Key features:
Efficient storage and ultra-fast retrieval.
Easy!!
http://graphite.wikidot.com/
Graphite components
Graphite Web

Carbon

Whisper

The front-end of
Graphite. It
provides a
dashboard for
retrieval and
visualization of our
metrics and a
powerful plotting
API.

The core of
Graphite. Carbon
listens for data in a
format, aggregate
it and try to store it
on disk as quickly
as possible using
whisper.

The data storage.
An efficient time
series based
database.
Organization of your data
Everything in Graphite
has a path with
components delimited by
dots.
servers.hostname.metric
applications.appname.metric

Paths reflect the organization
of the data:
Pushing in your data:
Carbon configuration (and limitations)
Carbon listens for data (1) and aggregates them (2).
One can set the two specific behaviors by changing appropriate
variables in the configuration files.
1) How often your data will be collected? It needs to have the
retention time set to a specific value.
For a timespan X I want to store my data at intervals of y
(seconds/hours/days/months).
What happens if I send two metrics at the same time? Carbon
retains only the last one!
2)How do your metrics aggregate? It needs specific keywords to
apply functions to aggregate the data (e.g., “min”, “max”,
“sum”..).
Fast and flexible monitoring: StatsD
StatsD
Front-end application for
Graphite (by Etsy)
Buffers metrics locally
Aggregates the data for
us
Flushes periodically data
to Graphite
Client libraries available
in any language
Send any metric you like

import statsd
HOST = 'hostname.server.com'
PORT = 8181
PREFIX = 'myprefix'
def initialize_client(host, port, prefix):
client = statsd.StatsClient(host, port, prefix)
return client
def send_data(data_name, value, client):
client.gauge(data_name, value)
client = initialize_client(HOST, PORT, PREFIX)
…..CODE.....
send_data('Energy', 1000, client)

https://github.com/etsy/statsd/
Data Types in StatsD
Graphite usually stores the most recent data in 1-minute averaged
timestep, so when you’re looking at a graph, for each stat you
are typically seeing the average value over that minute.
Type
Counters
Timers
Gauges

Definition
Per-second rates
Event duration
Values

Sets

Unique values
passed to a key

Example
Page views
Page latency
How many views
do you have
Number of
registered users
accessing your
website
Fast and flexible monitoring: CollectD
CollectD
A unix daemon that gathers system statistics
Plugin to send metrics to Carbon
Very useful for system metrics
Application-level statistics:
StatsD

System-level statistics:
CollectD

e.g. The number of times
a function is called

e.g. the memory usage

We can combine them in
a dashboard!
Case study:
“Company A”
A project not testing friendly ...
...The Design phase was almost skipped!
We were asked to translate an existing (Matlab!) application
(into Python)
Metrics Driven Development!
Case study:
“Company A”
Task: exploring a
space of
solutions to find
the best one
Method:
Simulated annealing
Probability
Random Number
Metrics Driven Development!
Track the evolution of the process instead of
parsing a (boring) log file to (1) correlate the consequences of
having P(x) > random number and (2) visually inspect the
real-time changing of P(x) values during the simulation
Case study:
“Company B”
A project where multiple applications have to interact
in order to manage the elaboration of a
huge number of pictures every day
Case study:
“Company B”
Monitor to …
1) see the asynchronous
activation of the applications
2) gather a regular pattern
3) CHECK FOR CHANGES IN
THAT PATTERN!

Monitor your system (cpu, ram...) and
applications together to see
if the hardware suits their requirements or not
Case study:
“Company B”

Monitor your system
(cpu,ram...) and
applications together to see
if the hardware suits their
requirements or not.
E.g. picture upload time
Vs packet received/transmitted
Vs memory free/used
and so on...
Case study:
“Company B”

Database queries per second?

Async tasks currently in queue?

How is the application behaving?
Images resized and stored?
Error and warning rates?
Case study:
“Company B”

These applications are running
on several hosts and
their metrics end to the same point.
You can monitor many different servers by
looking at the same dashboard.
Testing and Monitoring
"measure twice,
cut once"-

"Cut it quickly in
several pieces and see
which fits best (now!)”

You can do both!
Testing: just once during the development
Monitoring: it keeps working once the application is
released
Testing and Monitoring
Tests are logical properties of our
application. Metrics are not. But Metrics
offer you the possibility to see what is going
on once the application/system is in
production

inevitable
Failure is not accepted
and detectable!
Monitoring
Provide
informations
✗Frequent
communication
✗Some share
decision making
✗

Dev

Free!

Ops
Wait... I don't like Graphite Web Interface!
No problem!
The world of the interfaces is
In continuous evolution
About 56,100 results
You can't optimize what you can't measure
so monitor and...

Optimize anything,
Optimize everything
Thank you for your attention!
Serena Lorenzini
serena@biodec.com

Incontro DevOps Italia
Bologna, 21 Feb. 2014

Monitoring as Software Validation

  • 1.
    "Monitoring as SoftwareValidation" Measure anything, Measure everything Serena Lorenzini serena@biodec.com Incontro DevOps Italia Bologna, 21 Feb. 2014
  • 2.
    Monitoring: If it moves...you can track it! Monitor everything Network Machine Why? ●Learn from your infrastructure ●Anticipate failure ●Speed up changes Application
  • 3.
    Metrics and Events Metric:Time + Name + Value Event: Time + Name It can be anything
  • 4.
  • 5.
    Graphite An all-in-one solutionfor storing and visualizing real-time time-series data Key features: Efficient storage and ultra-fast retrieval. Easy!! http://graphite.wikidot.com/
  • 6.
    Graphite components Graphite Web Carbon Whisper Thefront-end of Graphite. It provides a dashboard for retrieval and visualization of our metrics and a powerful plotting API. The core of Graphite. Carbon listens for data in a format, aggregate it and try to store it on disk as quickly as possible using whisper. The data storage. An efficient time series based database.
  • 7.
    Organization of yourdata Everything in Graphite has a path with components delimited by dots. servers.hostname.metric applications.appname.metric Paths reflect the organization of the data:
  • 8.
    Pushing in yourdata: Carbon configuration (and limitations) Carbon listens for data (1) and aggregates them (2). One can set the two specific behaviors by changing appropriate variables in the configuration files. 1) How often your data will be collected? It needs to have the retention time set to a specific value. For a timespan X I want to store my data at intervals of y (seconds/hours/days/months). What happens if I send two metrics at the same time? Carbon retains only the last one! 2)How do your metrics aggregate? It needs specific keywords to apply functions to aggregate the data (e.g., “min”, “max”, “sum”..).
  • 9.
    Fast and flexiblemonitoring: StatsD StatsD Front-end application for Graphite (by Etsy) Buffers metrics locally Aggregates the data for us Flushes periodically data to Graphite Client libraries available in any language Send any metric you like import statsd HOST = 'hostname.server.com' PORT = 8181 PREFIX = 'myprefix' def initialize_client(host, port, prefix): client = statsd.StatsClient(host, port, prefix) return client def send_data(data_name, value, client): client.gauge(data_name, value) client = initialize_client(HOST, PORT, PREFIX) …..CODE..... send_data('Energy', 1000, client) https://github.com/etsy/statsd/
  • 10.
    Data Types inStatsD Graphite usually stores the most recent data in 1-minute averaged timestep, so when you’re looking at a graph, for each stat you are typically seeing the average value over that minute. Type Counters Timers Gauges Definition Per-second rates Event duration Values Sets Unique values passed to a key Example Page views Page latency How many views do you have Number of registered users accessing your website
  • 11.
    Fast and flexiblemonitoring: CollectD CollectD A unix daemon that gathers system statistics Plugin to send metrics to Carbon Very useful for system metrics Application-level statistics: StatsD System-level statistics: CollectD e.g. The number of times a function is called e.g. the memory usage We can combine them in a dashboard!
  • 12.
    Case study: “Company A” Aproject not testing friendly ... ...The Design phase was almost skipped! We were asked to translate an existing (Matlab!) application (into Python) Metrics Driven Development!
  • 13.
    Case study: “Company A” Task:exploring a space of solutions to find the best one Method: Simulated annealing Probability Random Number Metrics Driven Development! Track the evolution of the process instead of parsing a (boring) log file to (1) correlate the consequences of having P(x) > random number and (2) visually inspect the real-time changing of P(x) values during the simulation
  • 14.
    Case study: “Company B” Aproject where multiple applications have to interact in order to manage the elaboration of a huge number of pictures every day
  • 15.
    Case study: “Company B” Monitorto … 1) see the asynchronous activation of the applications 2) gather a regular pattern 3) CHECK FOR CHANGES IN THAT PATTERN! Monitor your system (cpu, ram...) and applications together to see if the hardware suits their requirements or not
  • 16.
    Case study: “Company B” Monitoryour system (cpu,ram...) and applications together to see if the hardware suits their requirements or not. E.g. picture upload time Vs packet received/transmitted Vs memory free/used and so on...
  • 17.
    Case study: “Company B” Databasequeries per second? Async tasks currently in queue? How is the application behaving? Images resized and stored? Error and warning rates?
  • 18.
    Case study: “Company B” Theseapplications are running on several hosts and their metrics end to the same point. You can monitor many different servers by looking at the same dashboard.
  • 19.
    Testing and Monitoring "measuretwice, cut once"- "Cut it quickly in several pieces and see which fits best (now!)” You can do both! Testing: just once during the development Monitoring: it keeps working once the application is released
  • 20.
    Testing and Monitoring Testsare logical properties of our application. Metrics are not. But Metrics offer you the possibility to see what is going on once the application/system is in production inevitable Failure is not accepted and detectable!
  • 21.
  • 22.
    Wait... I don'tlike Graphite Web Interface! No problem! The world of the interfaces is In continuous evolution About 56,100 results
  • 23.
    You can't optimizewhat you can't measure so monitor and... Optimize anything, Optimize everything
  • 24.
    Thank you foryour attention! Serena Lorenzini serena@biodec.com Incontro DevOps Italia Bologna, 21 Feb. 2014