Download as PDF, PPTX


![{
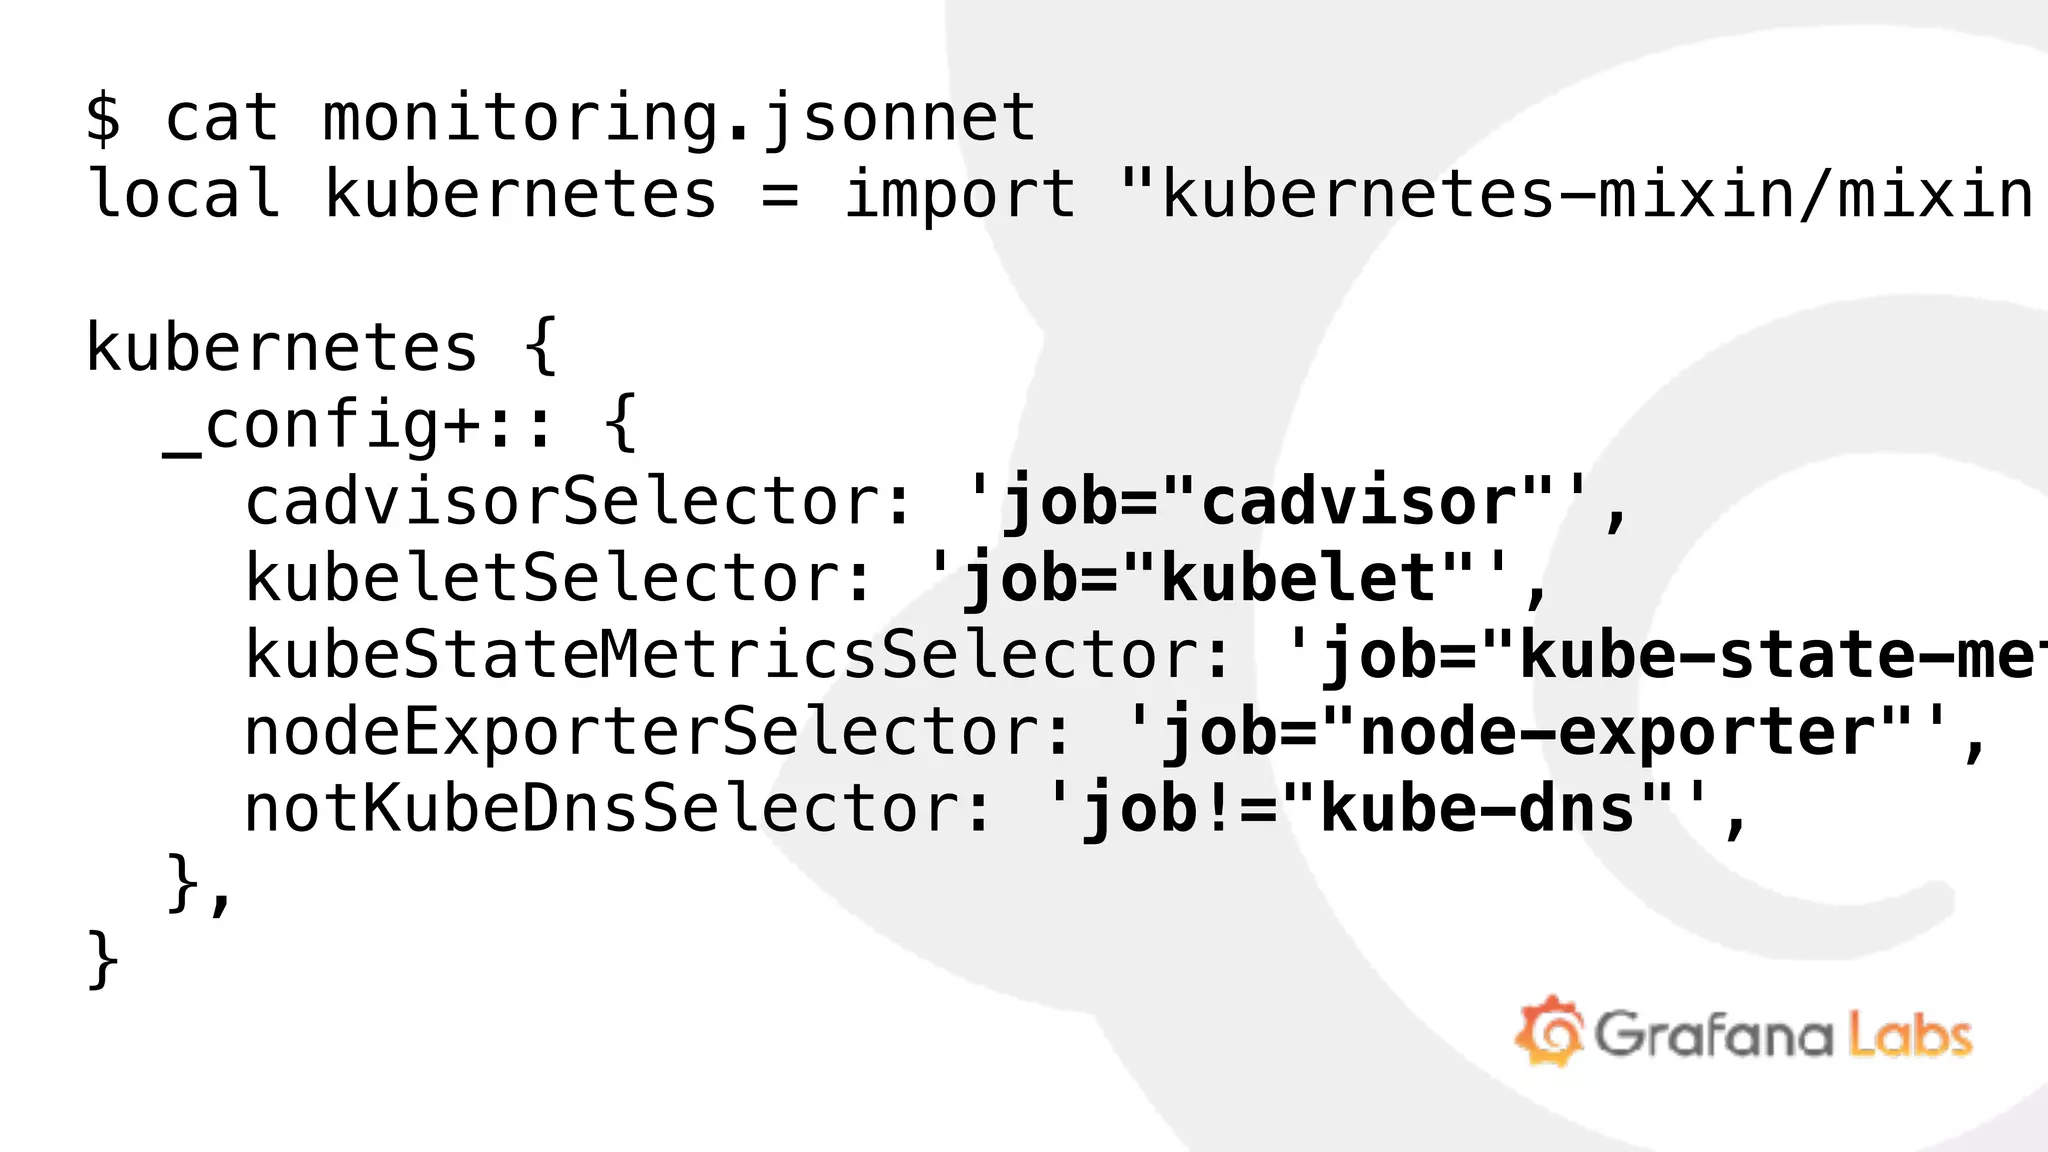
_config+:: {...},
grafanaDashboards+:: {
“dashboard-name.json”: {...},
},
prometheusAlerts+:: [...],
prometheusRules+:: [...],
}](https://image.slidesharecdn.com/monitoringmixins-180507104015/75/Prometheus-Monitoring-Mixins-17-2048.jpg)

![{
prometheusAlerts+:: {
groups+: [{
name: 'kubernetes-apps',
rules: [{
alert: 'KubePodCrashLooping',
'for': '1h',
expr: |||
rate(kube_pod_container_status_restarts
{%(kubeStateMetricsSelector)s}[15m])
> 0
||| % $._config,
...](https://image.slidesharecdn.com/monitoringmixins-180507104015/75/Prometheus-Monitoring-Mixins-19-2048.jpg)
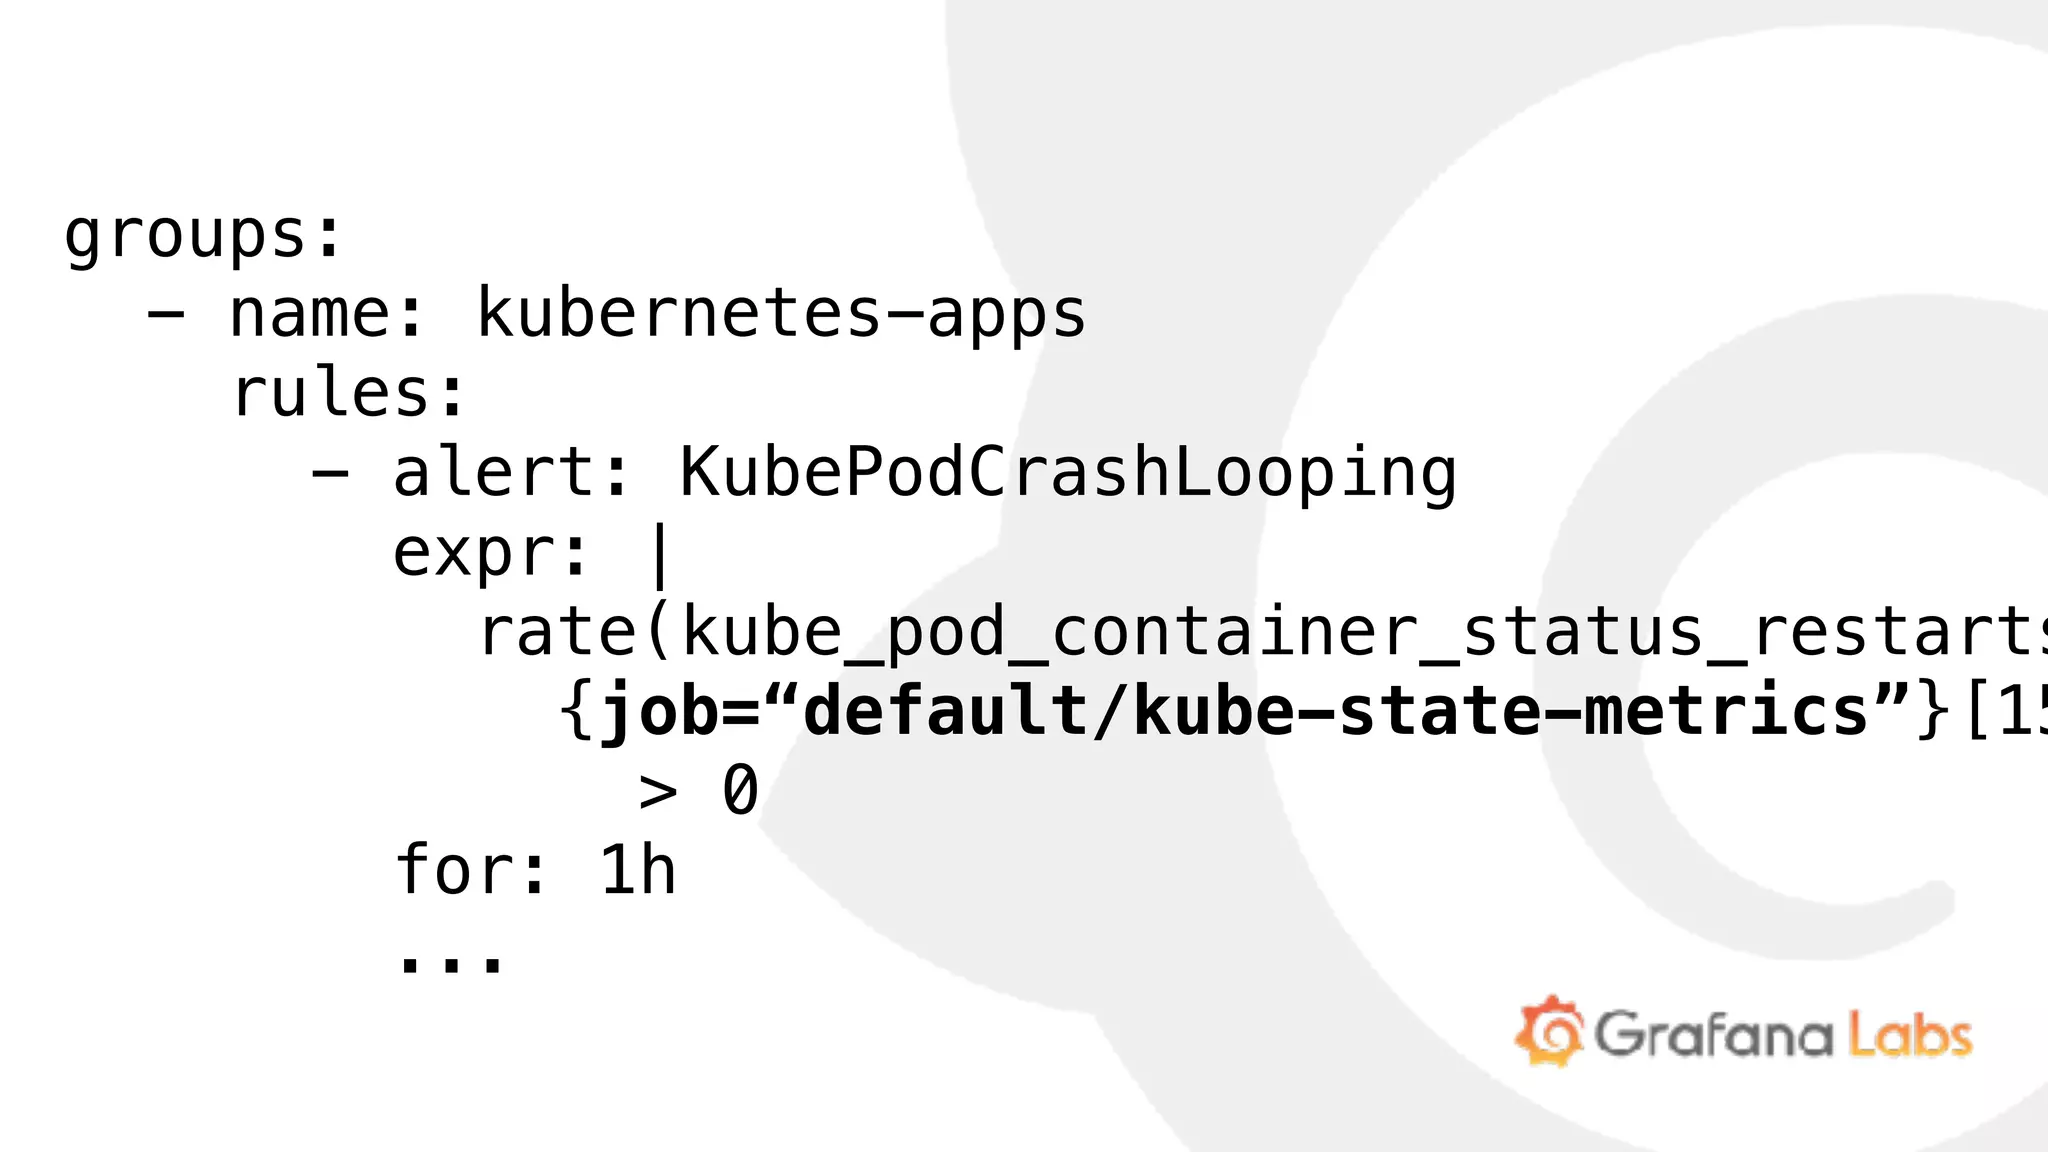


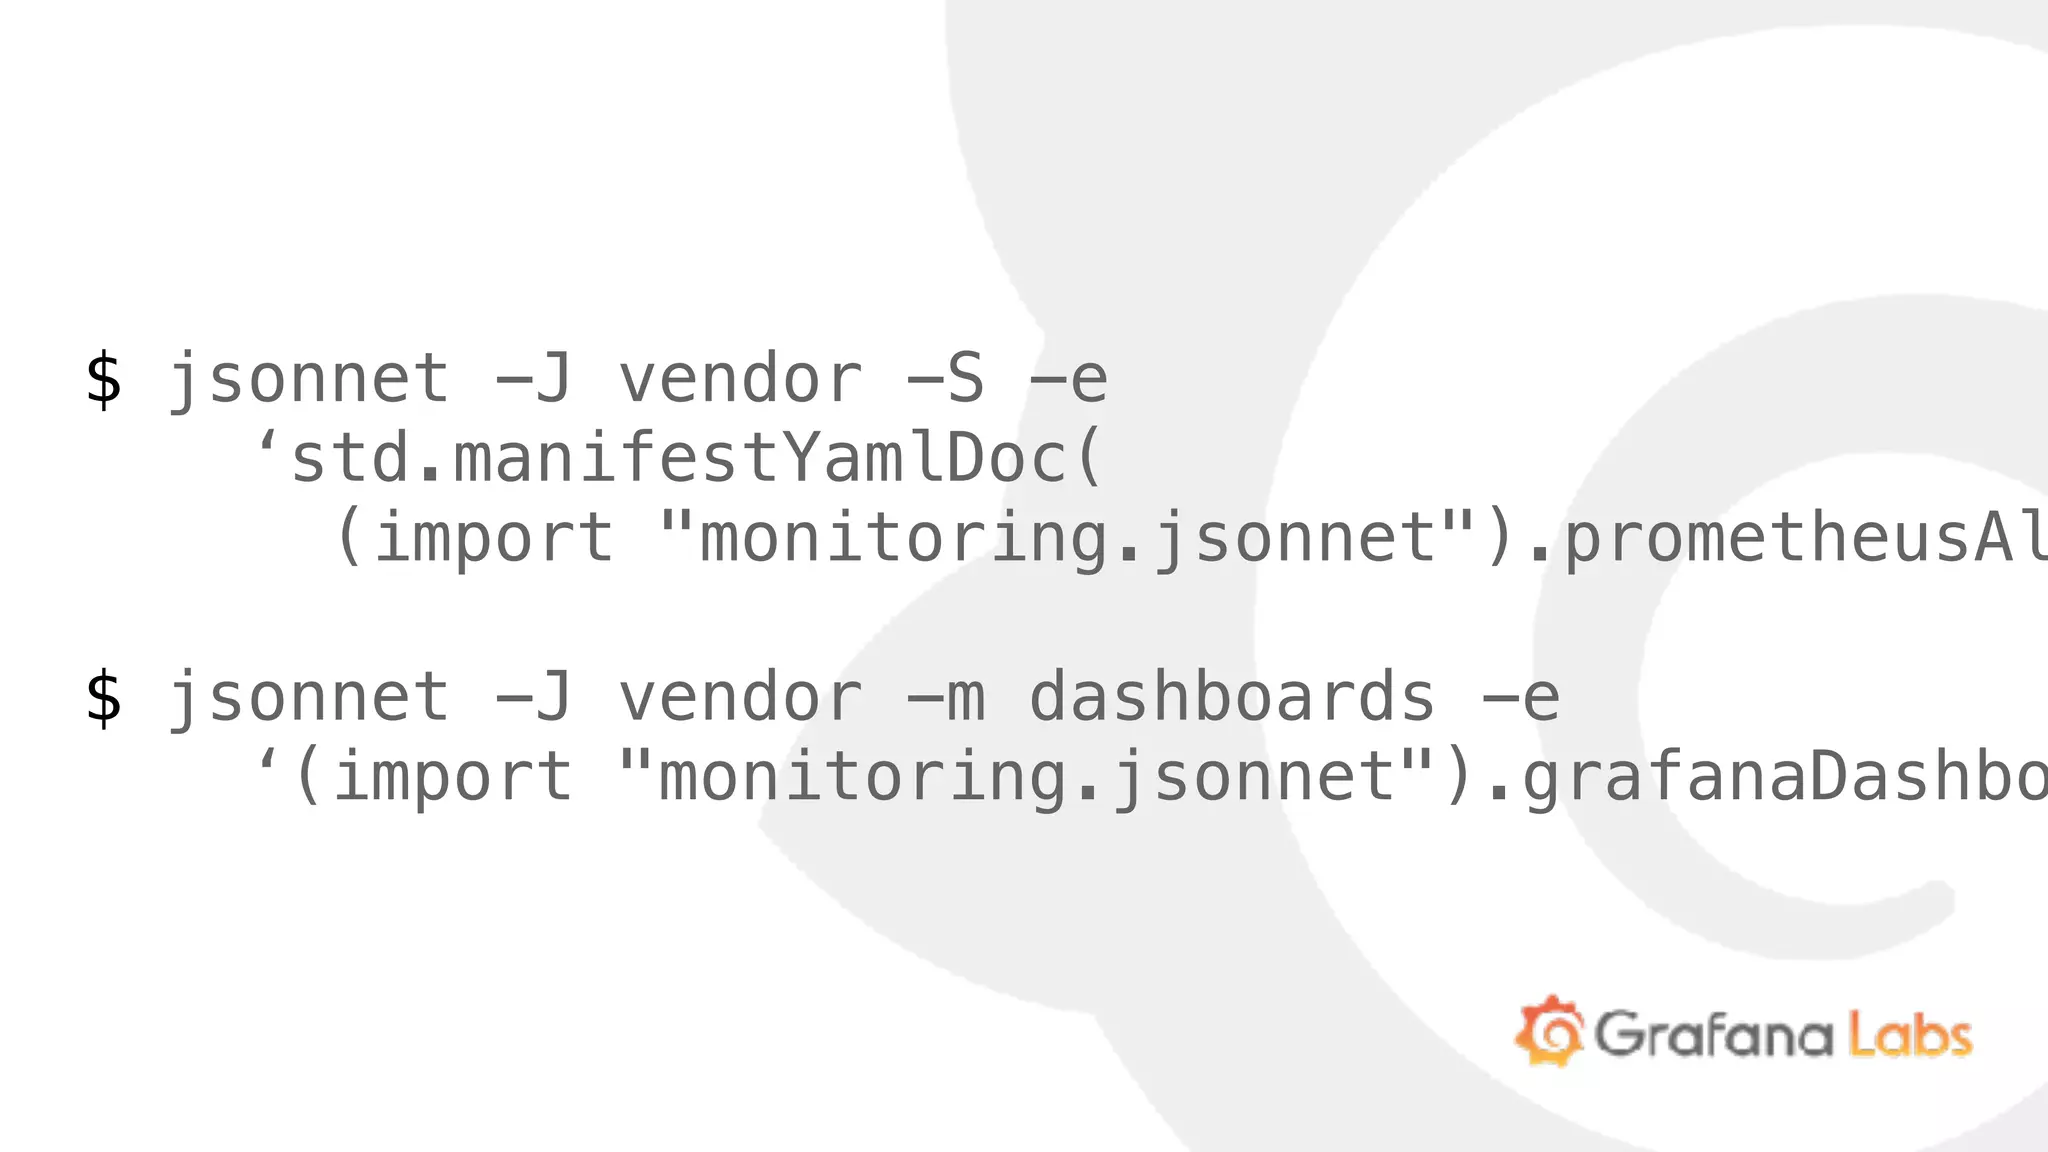
![$ jsonnet -J vendor -S -e 'std.manifestYamlDoc((impo
groups:
- name: kubernetes-apps
rules:
- alert: KubePodCrashLooping
annotations:
message: "{{ $labels.namespace }}/{{ $labels.p
expr: |
rate(kube_pod_container_status_restarts_total
{job="kube-state-metrics"}[15m]) > 0
for: "1h"
labels:
severity: critical
...](https://image.slidesharecdn.com/monitoringmixins-180507104015/75/Prometheus-Monitoring-Mixins-25-2048.jpg)


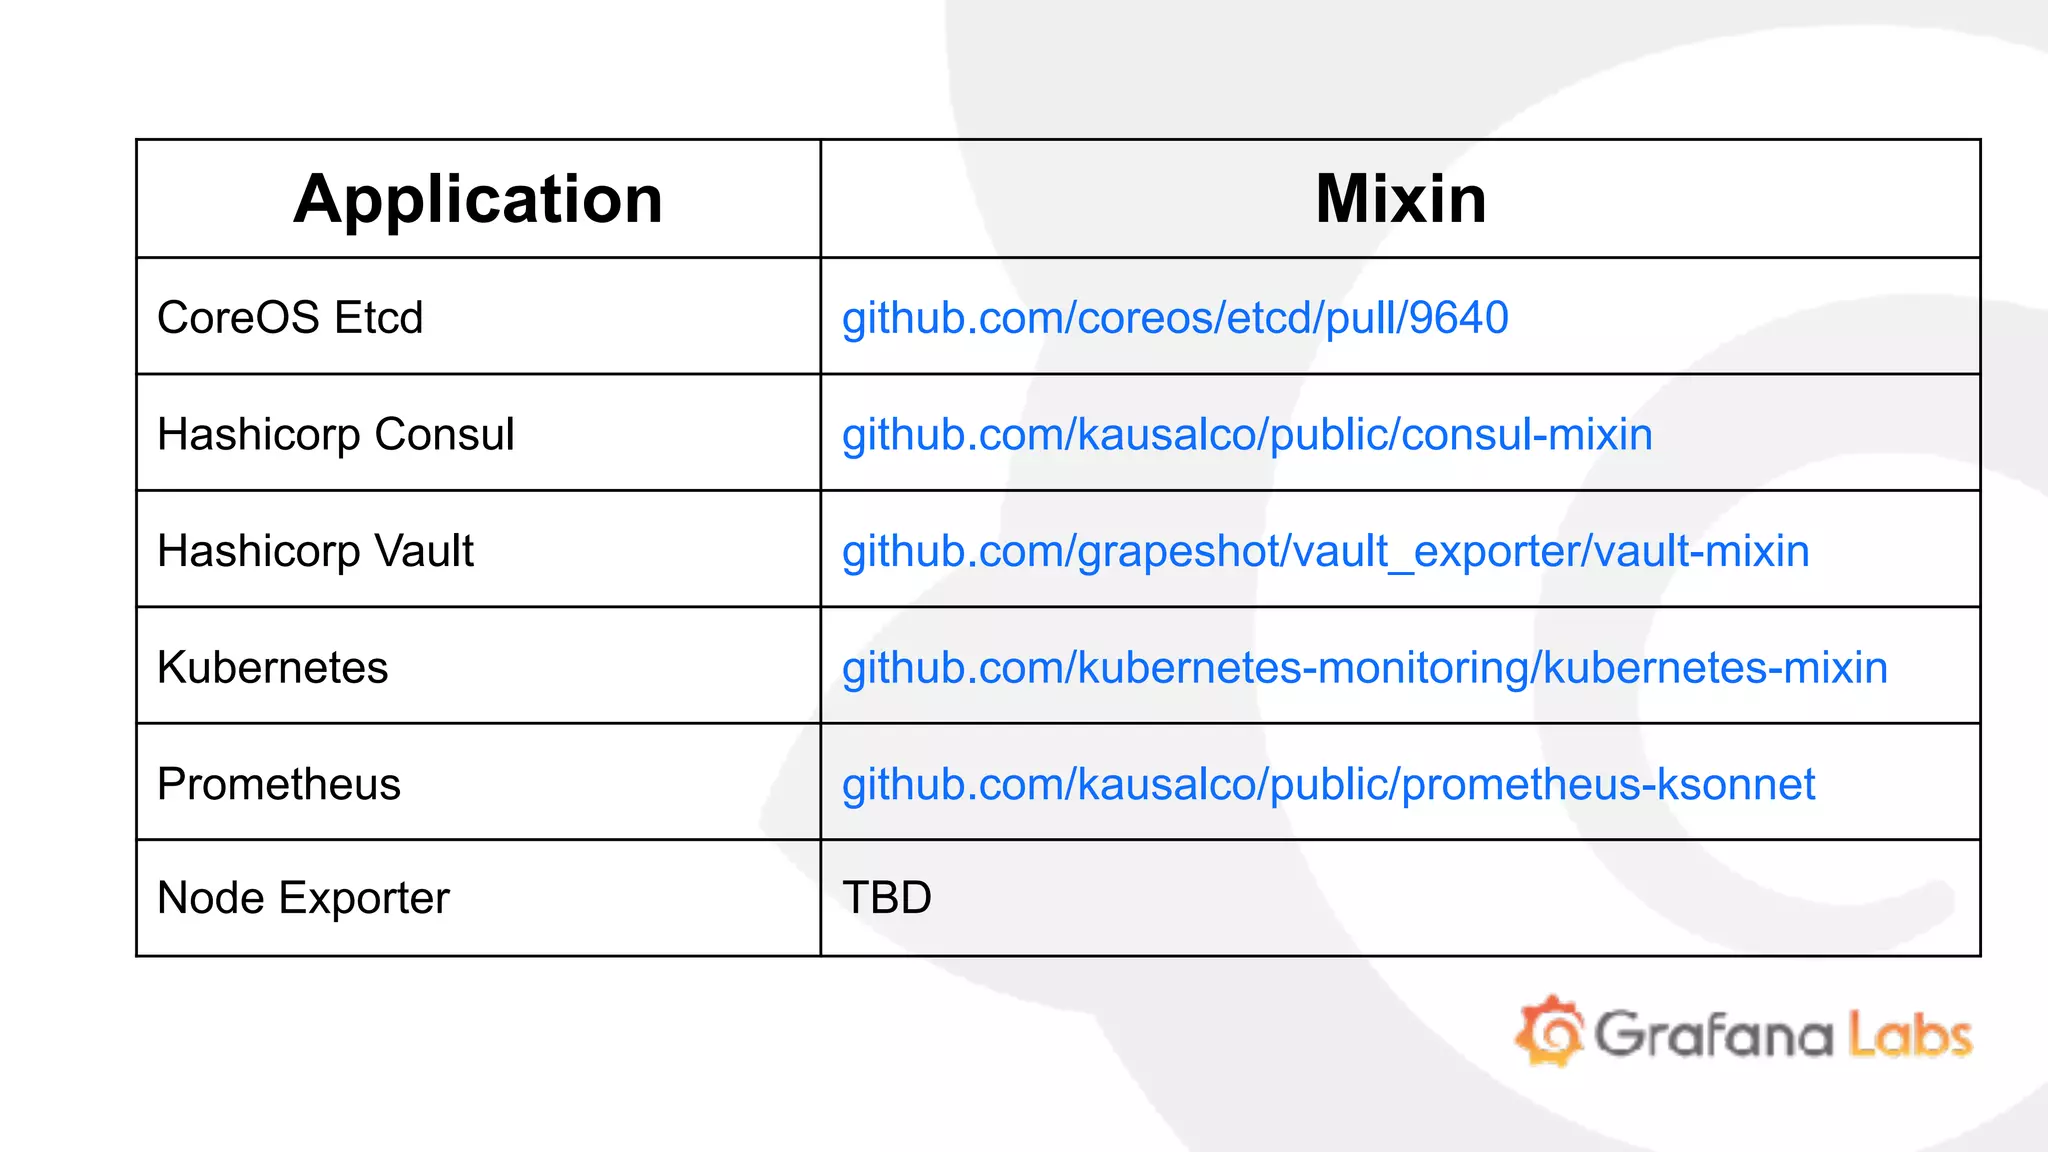

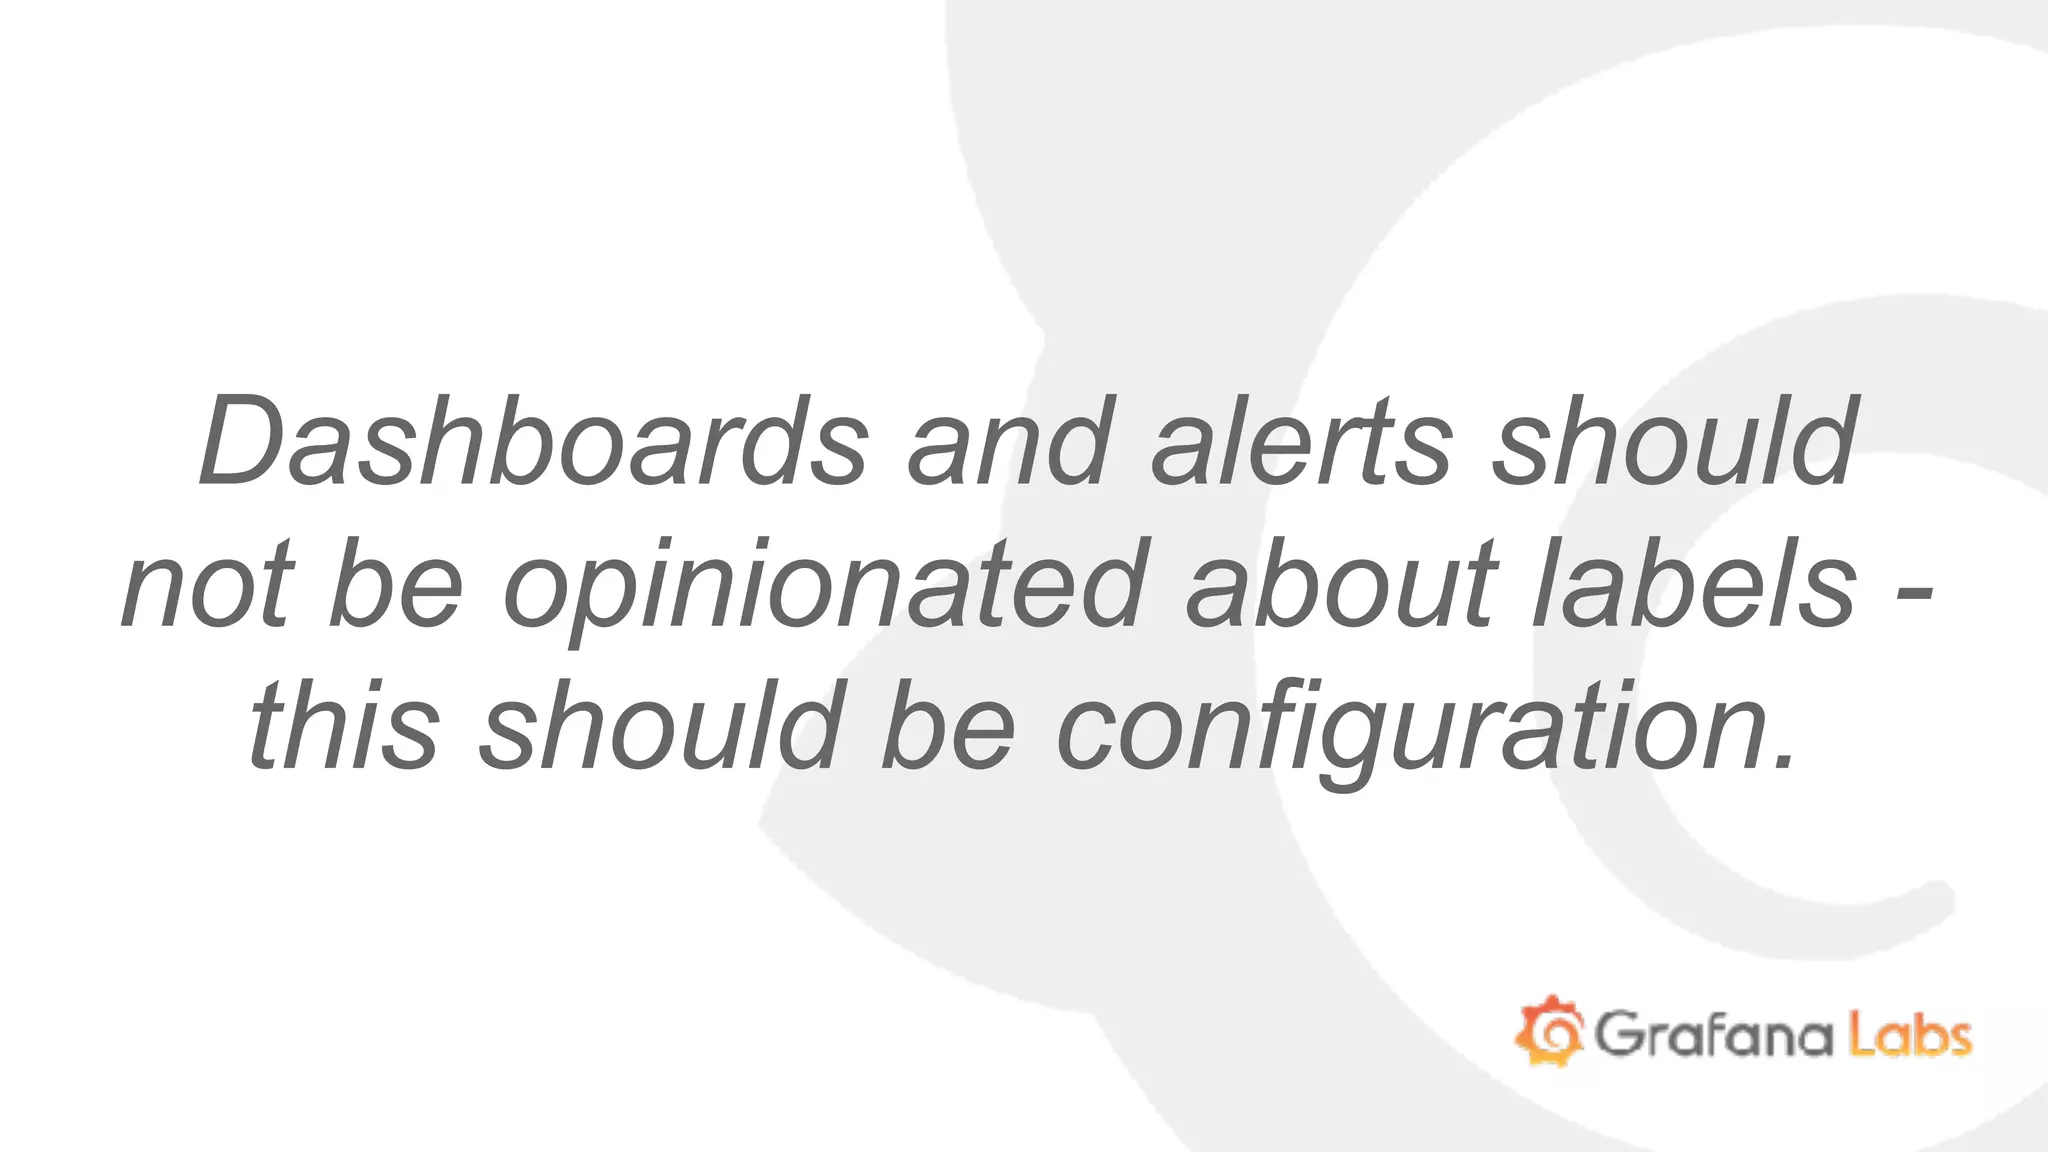
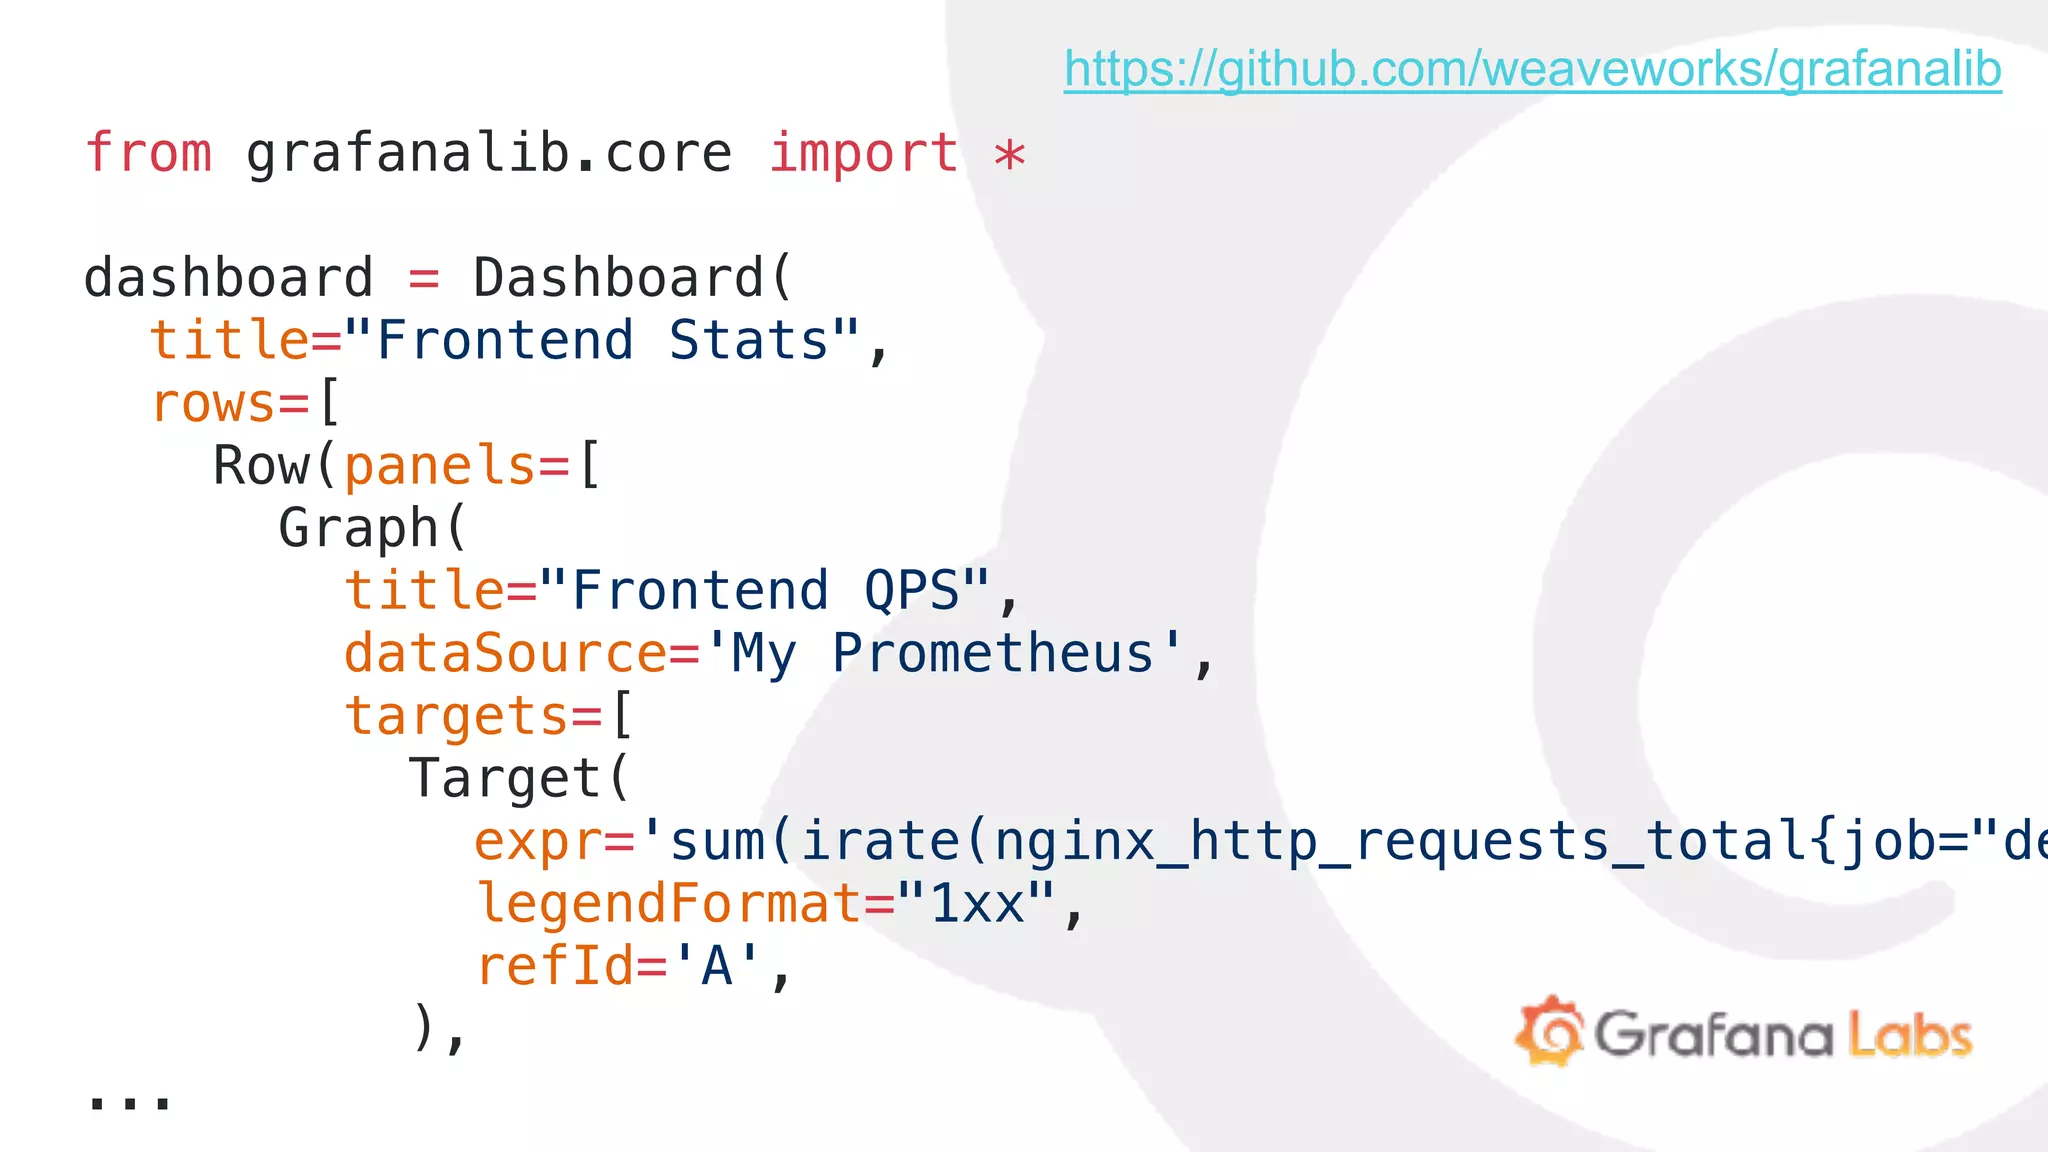
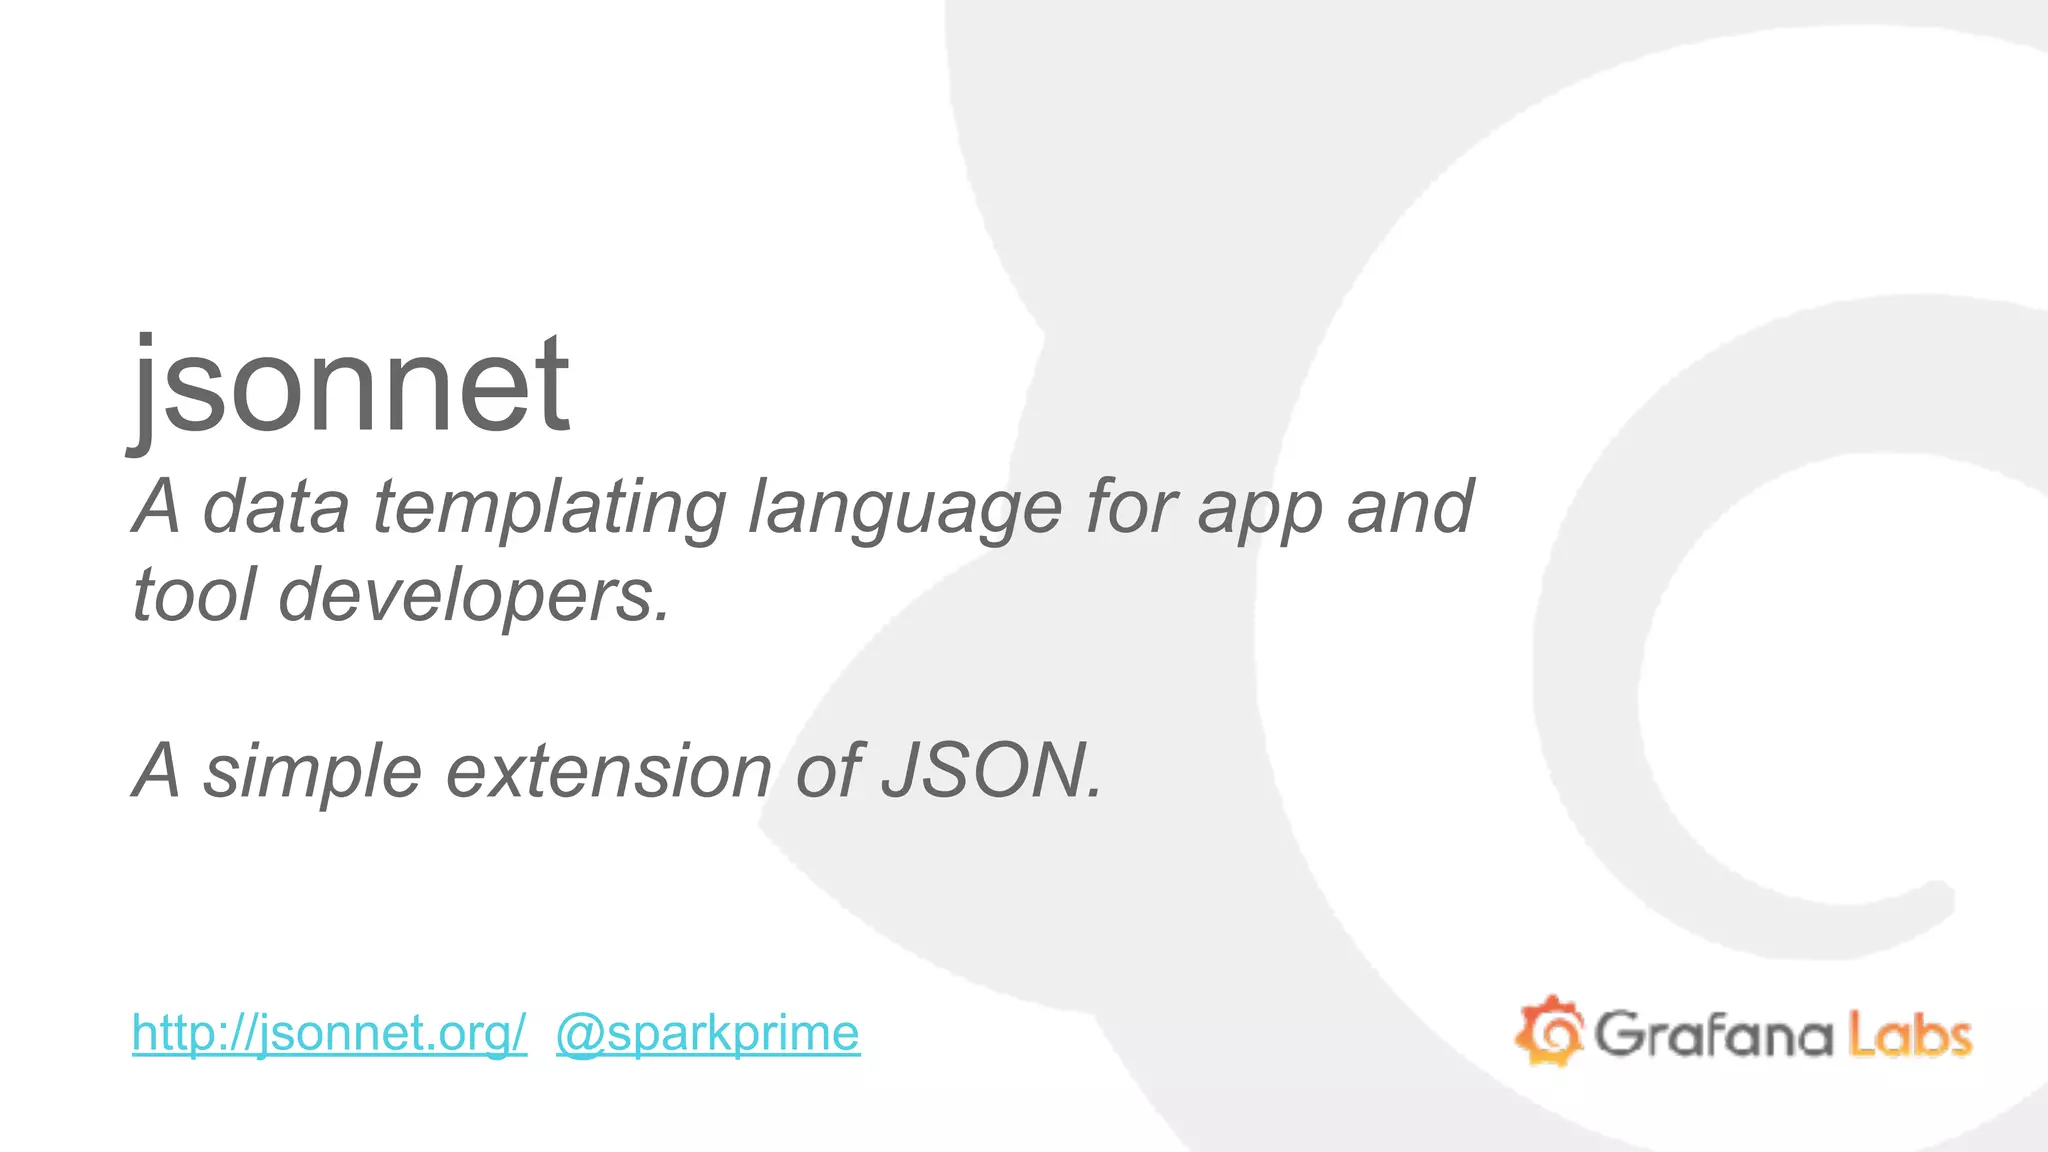
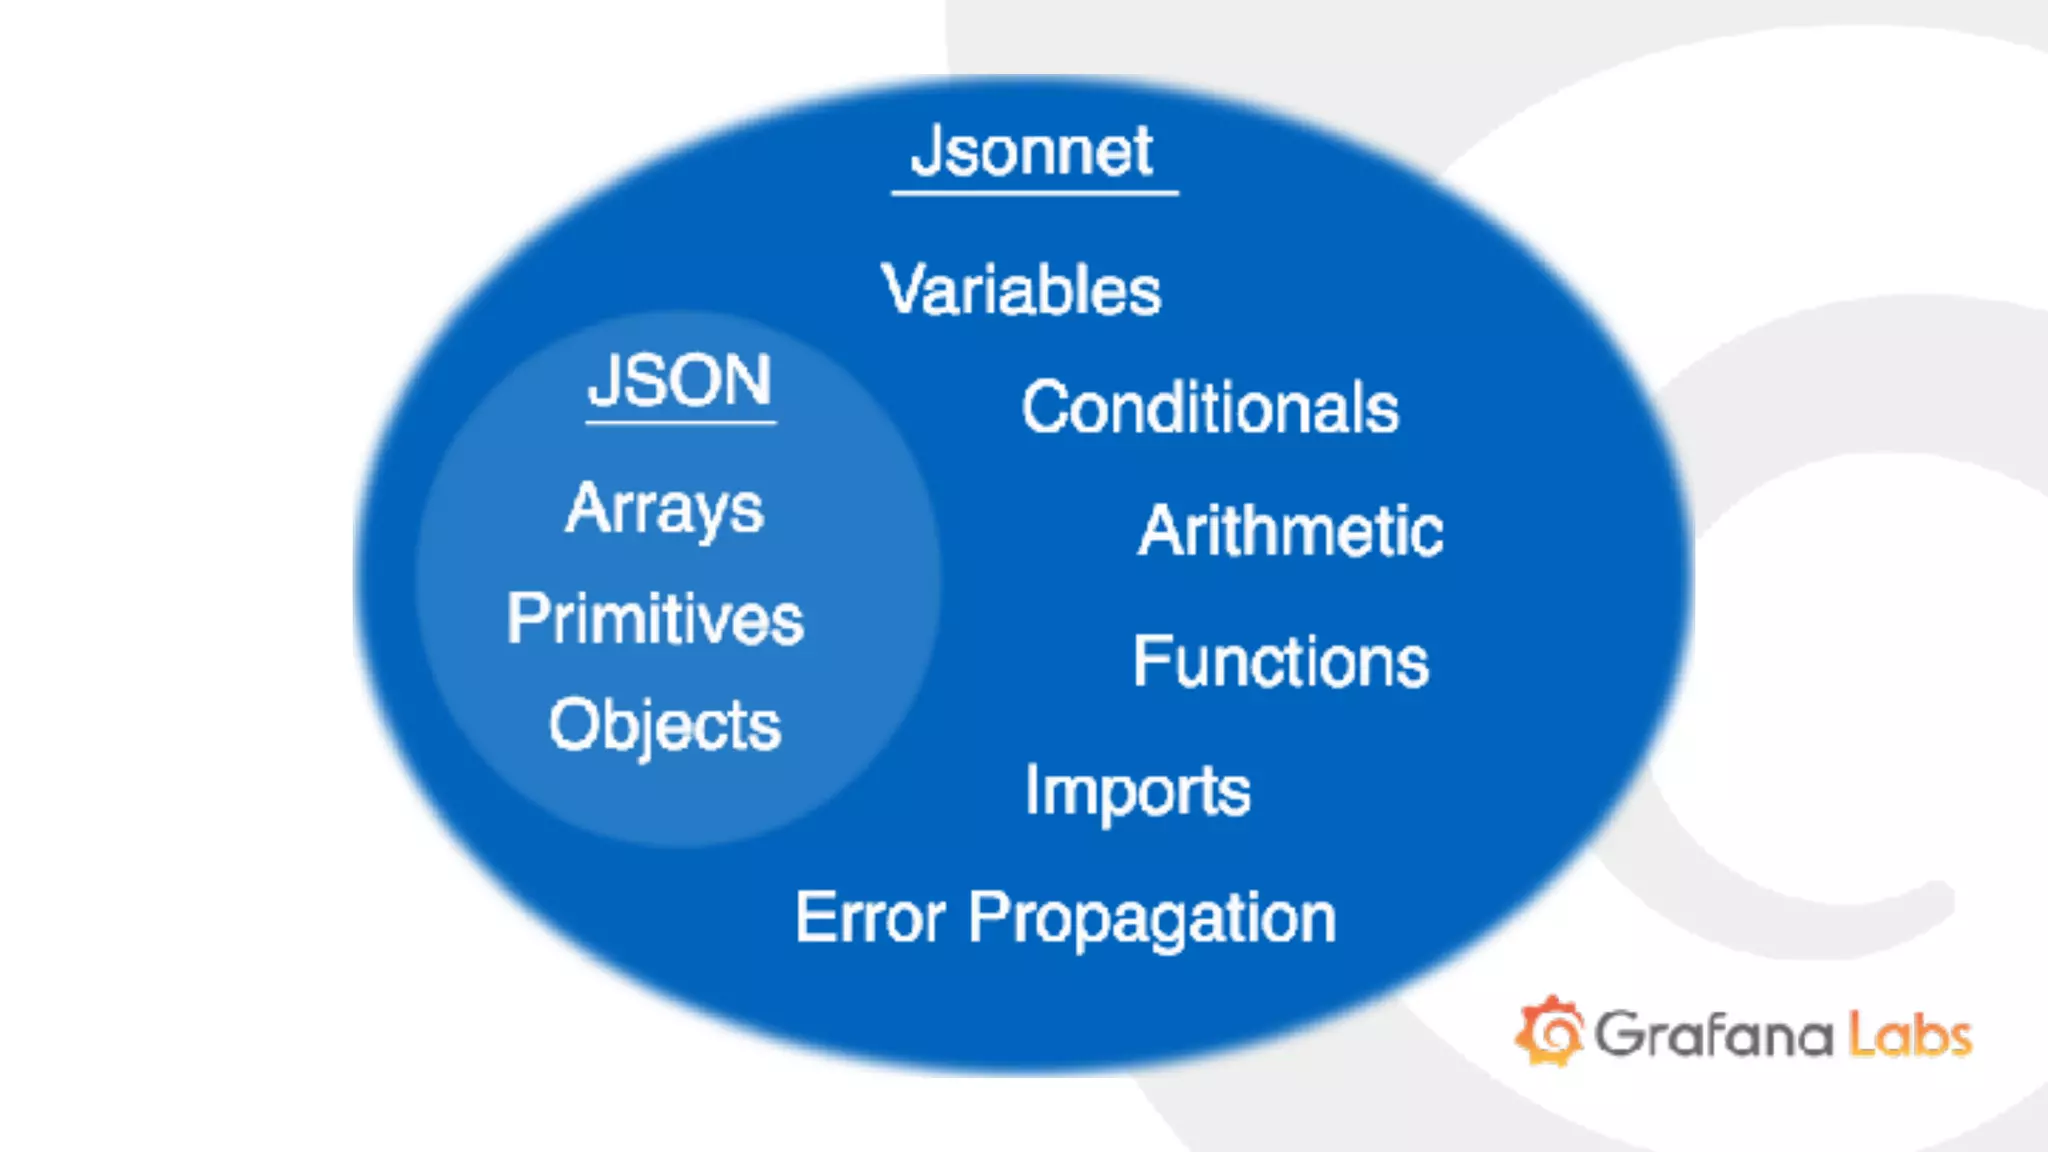
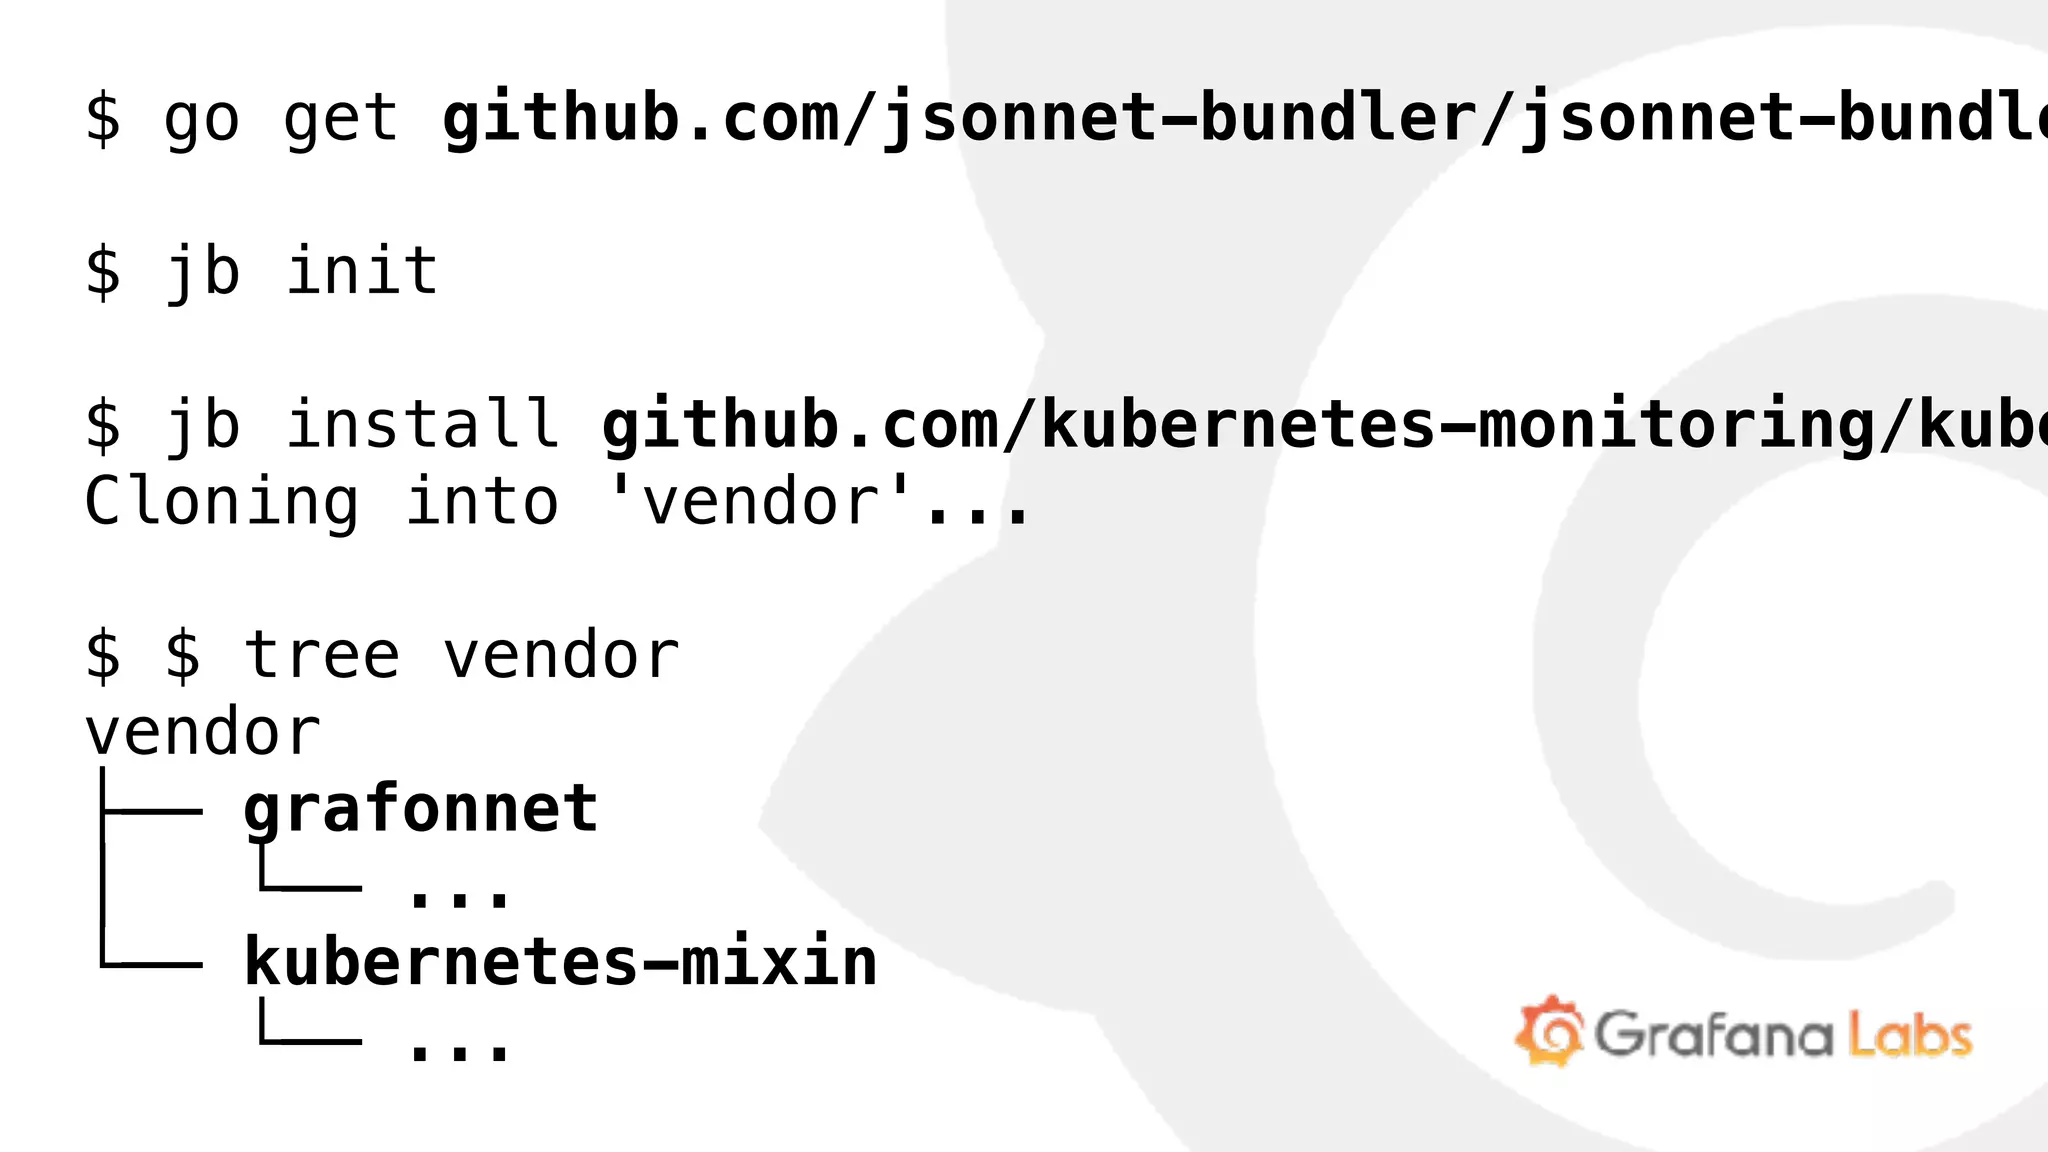
The document discusses the use of JSONNet for packaging Prometheus monitoring mixins, encompassing dashboards and alerts that are configurable, extensible, and deployment agnostic. It emphasizes the need for reusable components and provides examples of how to structure monitoring configurations using JSONNet, including setup for Kubernetes monitoring. The document highlights various tools and resources, including Grafana and JSONNet Bundler, necessary for implementing and managing these mixins.


![[오픈소스컨설팅] 아파치톰캣 운영가이드 v1.3](https://cdn.slidesharecdn.com/ss_thumbnails/opensourceconsultingtomcatoperationguidev1-181113020525-thumbnail.jpg?width=640&height=640&fit=bounds)


![[PromCon2018] Prometheus Monitoring Mixins: Using Jsonnet to Package Together...](https://cdn.slidesharecdn.com/ss_thumbnails/prometheusmonitoringmixins-180809132927-thumbnail.jpg?width=640&height=640&fit=bounds)


![Coded Agents – with UiPath SDK + LangGraph [Virtual Hands-on Workshop]](https://cdn.slidesharecdn.com/ss_thumbnails/codedagentsdeck-251215155422-5497c599-thumbnail.jpg?width=640&height=640&fit=bounds)


