"You are notplanning to fail, but you are failing
to plan“ – Benjamin Franklin
2.
Agenda:
Project Management Plan
Background
Process planning
Effort estimation
Schedule and resource estimation
Quality Planning
Risk management
Configuration Management
Project monitoring plans
2
3.
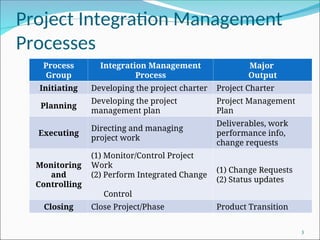
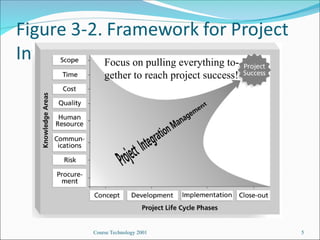
Project Integration Management
Processes
3
Process
Group
IntegrationManagement
Process
Major
Output
Initiating Developing the project charter Project Charter
Planning
Developing the project
management plan
Project Management
Plan
Executing
Directing and managing
project work
Deliverables, work
performance info,
change requests
Monitoring
and
Controlling
(1) Monitor/Control Project
Work
(2) Perform Integrated Change
Control
(1) Change Requests
(2) Status updates
Closing Close Project/Phase Product Transition
4.
Course Technology 20014
Note: The PMBOK Guide includes similar charts for each knowledge area.
5.
Course Technology 20015
Focus on pulling everything to-
gether to reach project success!
6.
Course Technology 20016
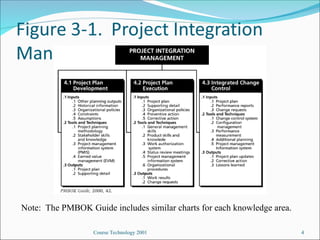
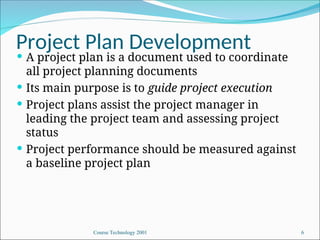
Project Plan Development
A project plan is a document used to coordinate
all project planning documents
Its main purpose is to guide project execution
Project plans assist the project manager in
leading the project team and assessing project
status
Project performance should be measured against
a baseline project plan
7.
Course Technology 20017
Attributes of Project Plans
Just as projects are unique, so are project plans
Plans should be dynamic
Plans should be flexible
Plans should be updated as changes occur
Plans should first and foremost guide project
execution
8.
Course Technology 20018
Common Elements of a
Project Plan
Introduction or overview of the project
Description of how the project is organized
Management and technical processes used on
the project
Work to be done, schedule, and budget
information
9.
Course Technology 20019
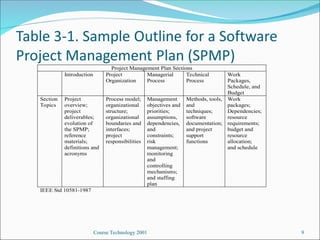
Project Management Plan Sections
Introduction Project
Organization
Managerial
Process
Technical
Process
Work
Packages,
Schedule, and
Budget
Section
Topics
Project
overview;
project
deliverables;
evolution of
the SPMP;
reference
materials;
definitions and
acronyms
Process model;
organizational
structure;
organizational
boundaries and
interfaces;
project
responsibilities
Management
objectives and
priorities;
assumptions,
dependencies,
and
constraints;
risk
management;
monitoring
and
controlling
mechanisms;
and staffing
plan
Methods, tools,
and
techniques;
software
documentation;
and project
support
functions
Work
packages;
Dependencies;
resource
requirements;
budget and
resource
allocation;
and schedule
IEEE Std 10581-1987
10.
Software Project
Goal:Build a software system to meet
commitments on cost, schedule, quality
Worldwide - many projects fail
one-third are runaways with cost or schedule
overrun of more than 125%
10
11.
Project Failures
Majorreasons for project runaways
unclear objectives
bad planning
no project management methodology
new technology
insufficient staff
All of these relate to project management
Effective project management is key to
successfully executing a project
11
12.
Why improve PM?
Better predictability leading to commitments
that can be met
Lower cost through reduced rework, better
resource mgmt, better planning,..
Improved quality through proper quality
planning and control
Better control through change control, CM,
monitoring etc.
12
13.
Why improve PM….
Better visibility into project health and state
leading to timely intervention
Better handling of risks reducing the chances of
failure
All this leads to higher customer satisfaction
And self and organization improvement
13
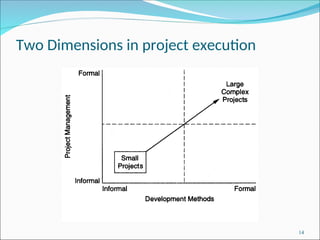
Process-based Project Execution
Small project both engg and PM can be done
informally
Large projects require formality
Formality: well defined processes used for each
task; measurements used to control
Here we focus on processes for PM only
15
16.
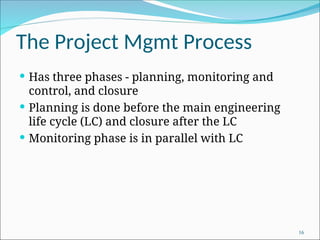
The Project MgmtProcess
Has three phases - planning, monitoring and
control, and closure
Planning is done before the main engineering
life cycle (LC) and closure after the LC
Monitoring phase is in parallel with LC
16
17.
Project Planning
Basicobjective:
To create a plan to meet the commitments of the
project
create a path that, if followed, will lead to a
successful project
Planning involves
defining the LC process to be followed, estimates,
detailed schedule, plan for quality, etc.
Main output
a project management plan, and
project schedule 17
18.
Key Planning Tasks
Define suitable processes for executing the project
Estimate effort
Define project milestones and create a schedule
Define quality objectives and a quality plan
Identify risks and make plans to mitigate them
Define measurement plan, project-tracking procedures,
training plan, team organization, etc.
18
19.
Process Planning
Planhow the project will be executed, (ie. the
process to be followed)
Process will decide the tasks, their ordering,
milestones
Hence process planning is an important project
planning task
Should plan for LC and PM processes as well as
supporting processes
19
20.
Life Cycle Process
Various LC models - waterfall, iterative,
prototyping; diff models suit different
projects
During planning can select the model that is
best for the project
This gives the overall process which has to be
fine-tuned to suit the project needs
Usually done by process tailoring - changing
the process to suit the project
Tailoring finally results in adding, deleting,
modifying some process steps
20
22.
Effort Estimation
Fora project total cost and duration has to be
committed in start
Requires effort estimation, often in terms of
person-months
Effort estimate is key to planning - schedule, cost,
resources depend on it
Many problems in project execution stem from
improper estimation
22
23.
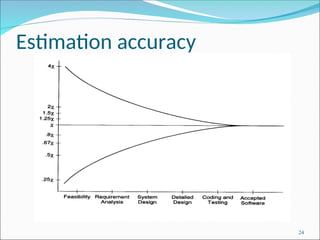
Estimation..
No easyway, no silver bullet
Estimation accuracy can improve with more
information about the project
Early estimates are more likely to be inaccurate
than later
More uncertainties in the start
With more info, estimation becomes easier
23
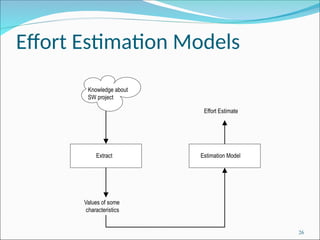
Effort Estimation Models..
A model tries to determine the effort estimate from
some parameter values
A model also requires input about the project, and
cannot work in vacuum
So to apply a model, we should be able to extract
properties about the system
Two types of models
top-down and
bottom-up
25
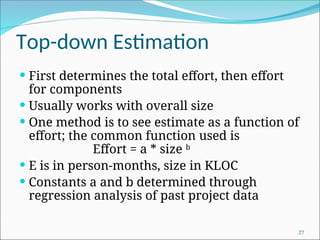
Top-down Estimation
Firstdetermines the total effort, then effort
for components
Usually works with overall size
One method is to see estimate as a function of
effort; the common function used is
Effort = a * size b
E is in person-months, size in KLOC
Constants a and b determined through
regression analysis of past project data
27
28.
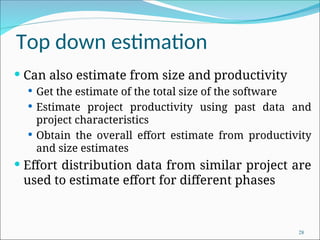
Top down estimation
Can also estimate from size and productivity
Get the estimate of the total size of the software
Estimate project productivity using past data and
project characteristics
Obtain the overall effort estimate from productivity
and size estimates
Effort distribution data from similar project are
used to estimate effort for different phases
28
29.
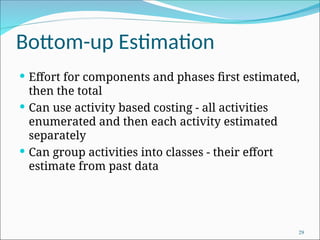
Bottom-up Estimation
Effortfor components and phases first estimated,
then the total
Can use activity based costing - all activities
enumerated and then each activity estimated
separately
Can group activities into classes - their effort
estimate from past data
29
30.
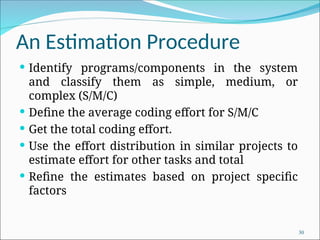
An Estimation Procedure
Identify programs/components in the system
and classify them as simple, medium, or
complex (S/M/C)
Define the average coding effort for S/M/C
Get the total coding effort.
Use the effort distribution in similar projects to
estimate effort for other tasks and total
Refine the estimates based on project specific
factors
30
31.
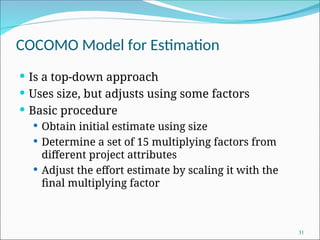
COCOMO Model forEstimation
Is a top-down approach
Uses size, but adjusts using some factors
Basic procedure
Obtain initial estimate using size
Determine a set of 15 multiplying factors from
different project attributes
Adjust the effort estimate by scaling it with the
final multiplying factor
31
32.
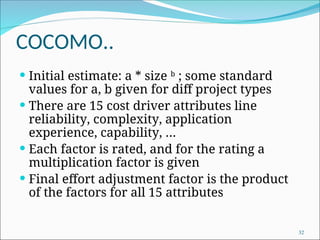
COCOMO..
Initial estimate:a * size b
; some standard
values for a, b given for diff project types
There are 15 cost driver attributes line
reliability, complexity, application
experience, capability, …
Each factor is rated, and for the rating a
multiplication factor is given
Final effort adjustment factor is the product
of the factors for all 15 attributes
32
33.
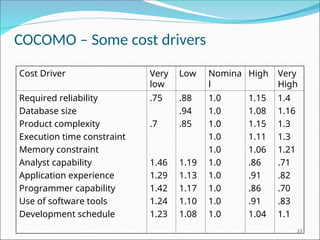
COCOMO – Somecost drivers
Cost Driver Very
low
Low Nomina
l
High Very
High
Required reliability
Database size
Product complexity
Execution time constraint
Memory constraint
Analyst capability
Application experience
Programmer capability
Use of software tools
Development schedule
.75
.7
1.46
1.29
1.42
1.24
1.23
.88
.94
.85
1.19
1.13
1.17
1.10
1.08
1.0
1.0
1.0
1.0
1.0
1.0
1.0
1.0
1.0
1.0
1.15
1.08
1.15
1.11
1.06
.86
.91
.86
.91
1.04
1.4
1.16
1.3
1.3
1.21
.71
.82
.70
.83
1.1
33
34.
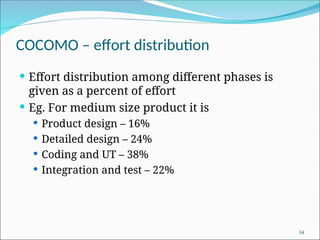
COCOMO – effortdistribution
Effort distribution among different phases is
given as a percent of effort
Eg. For medium size product it is
Product design – 16%
Detailed design – 24%
Coding and UT – 38%
Integration and test – 22%
34
35.
COCOMO Links
Centerfor Systems and Software Engineering –
COCOMO II Website:
http://sunset.usc.edu/csse/research/COCOMOII/co
como_main.html
Overview: http://en.wikipedia.org/wiki/COCOMO
35
37.
Project Schedule
Aproject Schedule is at two levels - overall
schedule and detailed schedule
Overall schedule comprises of major milestones
and final date
Detailed schedule is the assignment of lowest
level tasks to resources
37
38.
Overall Schedule
Dependsheavily on the effort estimate
For an effort estimate, some flexibility exists
depending on resources assigned
For example: a 56 PM project can be done in 8
months (7 people) or 7 months (8 people)
Stretching a schedule is easy; compressing is
hard and expensive
38
39.
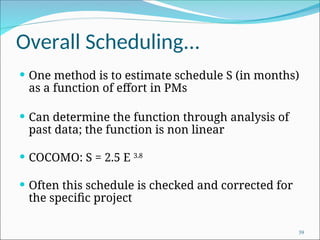
Overall Scheduling...
Onemethod is to estimate schedule S (in months)
as a function of effort in PMs
Can determine the function through analysis of
past data; the function is non linear
COCOMO: S = 2.5 E 3.8
Often this schedule is checked and corrected for
the specific project
39
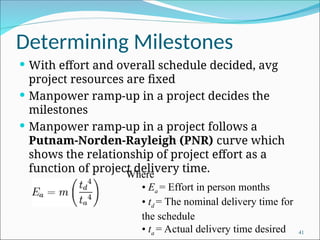
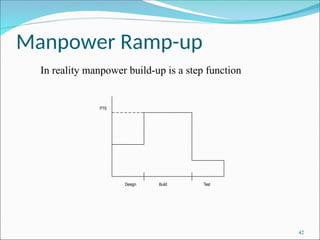
Determining Milestones
Witheffort and overall schedule decided, avg
project resources are fixed
Manpower ramp-up in a project decides the
milestones
Manpower ramp-up in a project follows a
Putnam-Norden-Rayleigh (PNR) curve which
shows the relationship of project effort as a
function of project delivery time.
41
Where
• Ea = Effort in person months
• td = The nominal delivery time for
the schedule
• ta = Actual delivery time desired
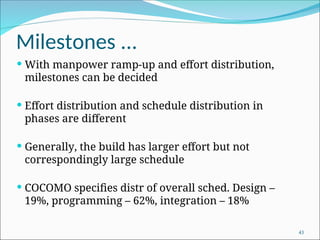
Milestones ...
Withmanpower ramp-up and effort distribution,
milestones can be decided
Effort distribution and schedule distribution in
phases are different
Generally, the build has larger effort but not
correspondingly large schedule
COCOMO specifies distr of overall sched. Design –
19%, programming – 62%, integration – 18%
43
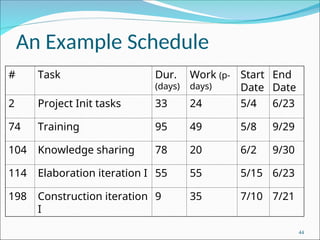
44.
An Example Schedule
#Task Dur.
(days)
Work (p-
days)
Start
Date
End
Date
2 Project Init tasks 33 24 5/4 6/23
74 Training 95 49 5/8 9/29
104 Knowledge sharing 78 20 6/2 9/30
114 Elaboration iteration I 55 55 5/15 6/23
198 Construction iteration
I
9 35 7/10 7/21
44
45.
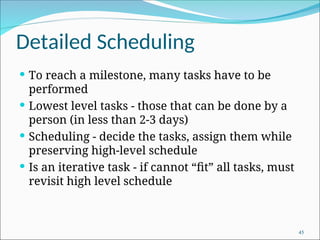
Detailed Scheduling
Toreach a milestone, many tasks have to be
performed
Lowest level tasks - those that can be done by a
person (in less than 2-3 days)
Scheduling - decide the tasks, assign them while
preserving high-level schedule
Is an iterative task - if cannot “fit” all tasks, must
revisit high level schedule
45
46.
Detailed Scheduling
Detailedschedule not done completely in the start -
it evolves
Can use MS Project for keeping it
Detailed Schedule is the most live document for
managing the project
Any activity to be done must get reflected in the
detailed schedule
46
47.
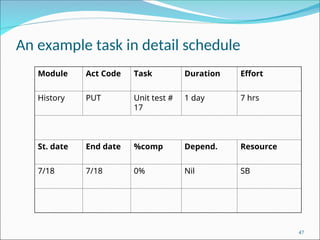
An example taskin detail schedule
Module Act Code Task Duration Effort
History PUT Unit test #
17
1 day 7 hrs
St. date End date %comp Depend. Resource
7/18 7/18 0% Nil SB
47
48.
Detail schedule
Eachtask has name, date, duration, resource etc
assigned
% done is for tracking (tools use it)
The detailed schedule has to be consistent with
milestones
Tasks are sub-activities of milestone level
activities, so effort should add up, total schedule
should be preserved
48
49.
Team Structure
Toassign tasks in detailed schedule, need to have
a clear team structure
Hierarchic team organization is most common
Project manager has overall responsibility; also
does design etc.
Has programmers and testers for executing
detailed tasks
May have config controller, db manager, etc
49
50.
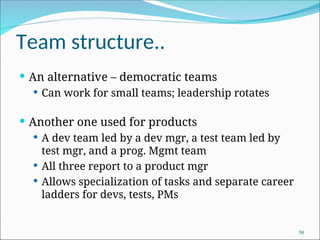
Team structure..
Analternative – democratic teams
Can work for small teams; leadership rotates
Another one used for products
A dev team led by a dev mgr, a test team led by
test mgr, and a prog. Mgmt team
All three report to a product mgr
Allows specialization of tasks and separate career
ladders for devs, tests, PMs
50
51.
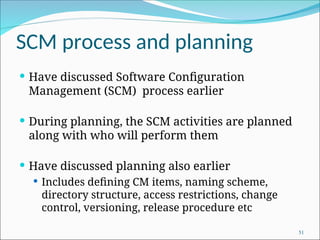
SCM process andplanning
Have discussed Software Configuration
Management (SCM) process earlier
During planning, the SCM activities are planned
along with who will perform them
Have discussed planning also earlier
Includes defining CM items, naming scheme,
directory structure, access restrictions, change
control, versioning, release procedure etc
51
53.
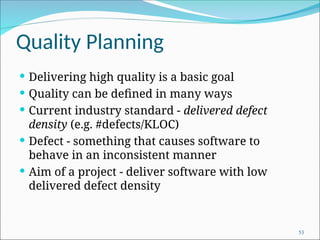
Quality Planning
Deliveringhigh quality is a basic goal
Quality can be defined in many ways
Current industry standard - delivered defect
density (e.g. #defects/KLOC)
Defect - something that causes software to
behave in an inconsistent manner
Aim of a project - deliver software with low
delivered defect density
53
54.
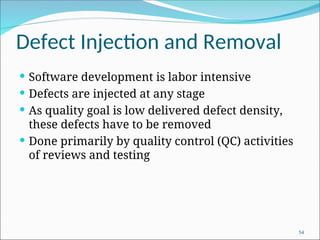
Defect Injection andRemoval
Software development is labor intensive
Defects are injected at any stage
As quality goal is low delivered defect density,
these defects have to be removed
Done primarily by quality control (QC) activities
of reviews and testing
54
55.
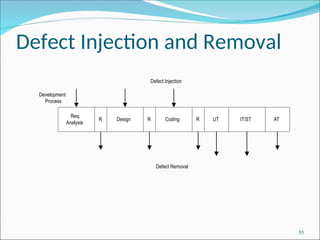
Defect Injection andRemoval
Req.
Analysis
Design R Coding R UT IT/ST AT
Development
Process
Defect Injection
R
Defect Removal
55
56.
Approaches to Quality
Management
Ad hoc - some testing, some reviews done as and
when needed
Procedural - defined procedures are followed in
a project
Quantitative - defect data analysis done to
manage the quality process
56
57.
Procedural Approach
Aquality plan defines what QC tasks will be
undertaken and when
Main QC tasks - reviews and testing
Guidelines and procedures for reviews and
testing are provided
During project execution, adherence to the plan
and procedures ensured
57
58.
Quantitative Approach
Goesbeyond asking “has the procedure been
executed”
Analyzes defect data to make judgements about
quality
Past data is very important
Key parameters - defect injection and removal
rates, defect removal efficiency (DRE)
58
59.
Quality Plan
Thequality plan drives the quality activities in
the project
Level of plan depends on models available
Must define QC tasks that have to be performed
in the project
Can specify defect levels for each QC tasks (if
models and data available)
59
61.
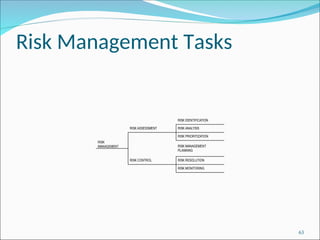
Risk Management
Anyproject can fail - reasons can be technical,
managerial, etc.
Project management aims to tackle the project
management aspect
Engineering life cycles aim to tackle the engineering
issues
A project may fail due to unforeseen events - risk
management aims to tackle this
61
62.
Risk Management
Risk:any condition or event whose occurrence is
not certain but which can cause the project to
fail
Aim of risk management: minimize the effect of
risks on a project
62
Risk Identification
Toidentify possible risks to a project, i.e. to those
events that might occur and which might cause
the project to fail
No “algorithm” possible, done by “what ifs”,
checklists, past experience
Can have a list of “top 10” risks that projects have
seen in past
64
65.
Top Risk Examples
Shortage of technically trained manpower
Too many requirement changes
Unclear requirements
Not meeting performance requirements
Unrealistic schedules
Insufficient business knowledge
Working on new technology
65
66.
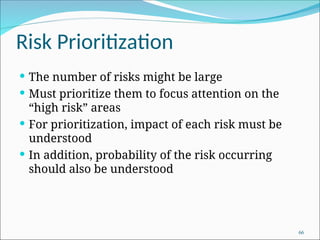
Risk Prioritization
Thenumber of risks might be large
Must prioritize them to focus attention on the
“high risk” areas
For prioritization, impact of each risk must be
understood
In addition, probability of the risk occurring
should also be understood
66
67.
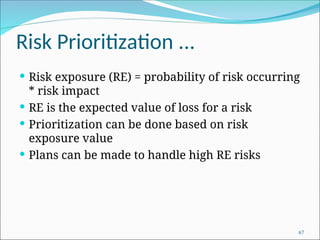
Risk Prioritization ...
Risk exposure (RE) = probability of risk occurring
* risk impact
RE is the expected value of loss for a risk
Prioritization can be done based on risk
exposure value
Plans can be made to handle high RE risks
67
68.
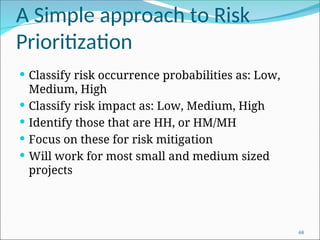
A Simple approachto Risk
Prioritization
Classify risk occurrence probabilities as: Low,
Medium, High
Classify risk impact as: Low, Medium, High
Identify those that are HH, or HM/MH
Focus on these for risk mitigation
Will work for most small and medium sized
projects
68
69.
Risk Control
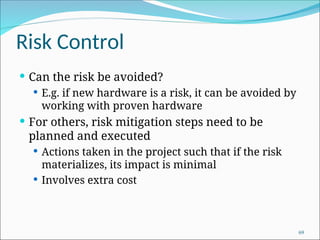
Canthe risk be avoided?
E.g. if new hardware is a risk, it can be avoided by
working with proven hardware
For others, risk mitigation steps need to be
planned and executed
Actions taken in the project such that if the risk
materializes, its impact is minimal
Involves extra cost
69
70.
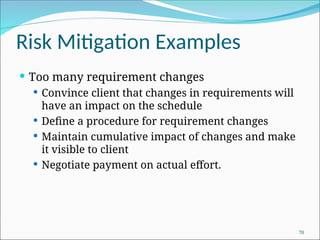
Risk Mitigation Examples
Too many requirement changes
Convince client that changes in requirements will
have an impact on the schedule
Define a procedure for requirement changes
Maintain cumulative impact of changes and make
it visible to client
Negotiate payment on actual effort.
70
71.
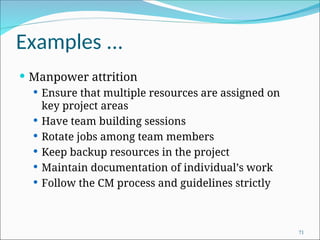
Examples ...
Manpowerattrition
Ensure that multiple resources are assigned on
key project areas
Have team building sessions
Rotate jobs among team members
Keep backup resources in the project
Maintain documentation of individual’s work
Follow the CM process and guidelines strictly
71
72.
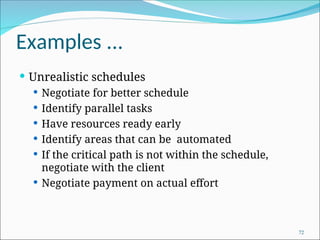
Examples ...
Unrealisticschedules
Negotiate for better schedule
Identify parallel tasks
Have resources ready early
Identify areas that can be automated
If the critical path is not within the schedule,
negotiate with the client
Negotiate payment on actual effort
72
73.
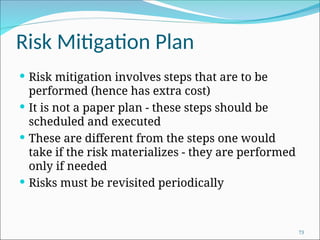
Risk Mitigation Plan
Risk mitigation involves steps that are to be
performed (hence has extra cost)
It is not a paper plan - these steps should be
scheduled and executed
These are different from the steps one would
take if the risk materializes - they are performed
only if needed
Risks must be revisited periodically
73
75.
Background
A planis a mere document that can guide
It must be executed
To ensure execution goes as per plan, it must be
monitored and controlled
Monitoring requires measurements
And methods for interpreting them
Monitoring plan has to plan for all the tasks
related to monitoring
75
76.
Measurements
Must planfor measurements in a project
Without planning, measurements will not be
done
Main measurements – effort, size, schedule,
and defects
Effort – as this is the main resource; often tracked
through effort reporting tools
Defects – as they determine quality; often defect
logging and tracking systems used
During planning – what will be measured,
how, tool support, and data management
76
77.
Project Tracking
Goal:To get visibility in project execution so
corrective actions can be taken when needed to
ensure project succeeds
Diff types of monitoring done at projects;
measurements provide data for it
77
78.
Tracking…
Activity-level monitoring
Each activity in detailed schd is getting done
Often done daily by managers
A task done marked 100%; tools can determine
status of higher level tasks
Status reports
Generally done weekly to take stock
Summary of activities completed, pending
Issues to be resolved
78
79.
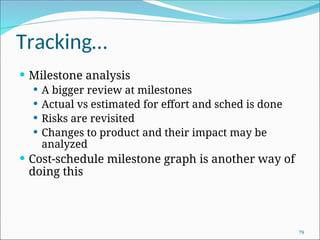
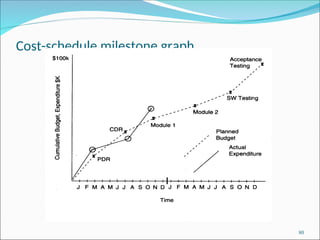
Tracking…
Milestone analysis
A bigger review at milestones
Actual vs estimated for effort and sched is done
Risks are revisited
Changes to product and their impact may be
analyzed
Cost-schedule milestone graph is another way of
doing this
79
Project Management Plan
The project management plan (PMP) contains
outcome of all planning activities - focuses on
overall project management
Besides PMP, a project schedule is needed
Reflects what activities get done in the project
Microsoft project (MSP) can be used for this
Based on project planning; is essential for day-to-day
management
Does not replace PMP !
81
82.
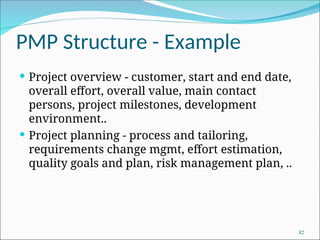
PMP Structure -Example
Project overview - customer, start and end date,
overall effort, overall value, main contact
persons, project milestones, development
environment..
Project planning - process and tailoring,
requirements change mgmt, effort estimation,
quality goals and plan, risk management plan, ..
82
83.
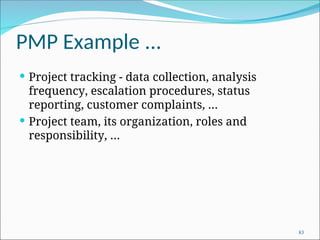
PMP Example ...
Project tracking - data collection, analysis
frequency, escalation procedures, status
reporting, customer complaints, …
Project team, its organization, roles and
responsibility, …
83
84.
Project Planning -Summary
Project planning forms the foundation of project
management
Key aspects: effort and schedule estimation, quality
planning, risk mgmt., …
Outputs of all can be documented in a PMP, which
carries all relevant info about project
Besides PMP, a detailed project schedule maintains
tasks to be done in the project
84