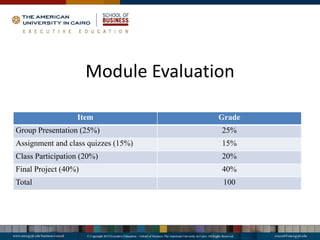
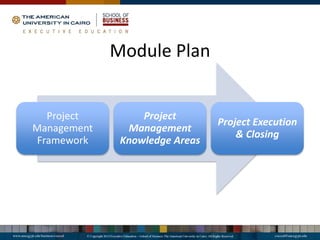
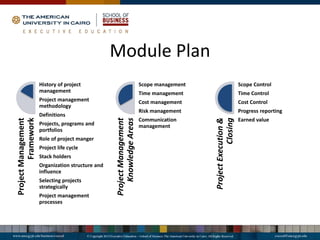
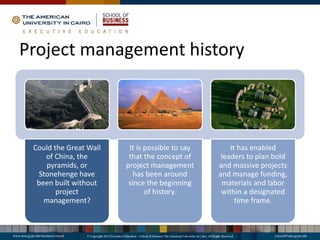
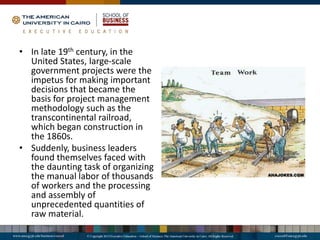
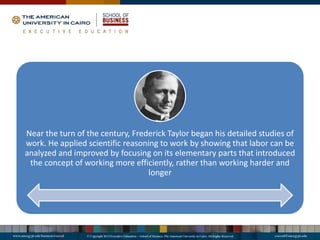
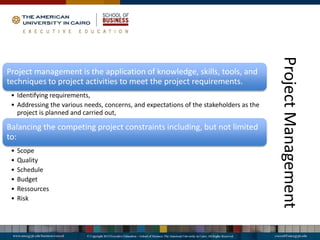
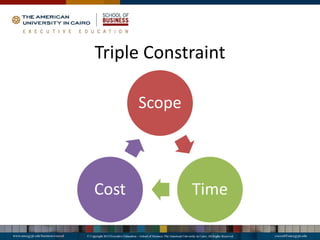
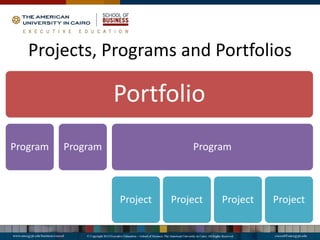
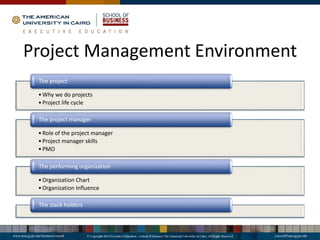
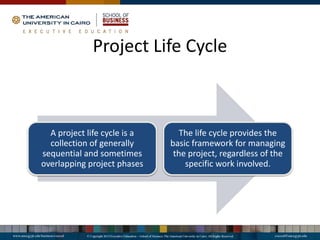
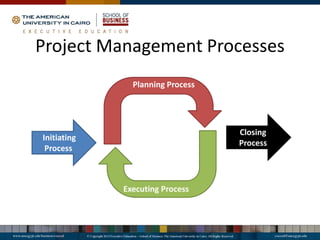
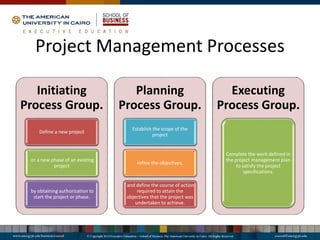
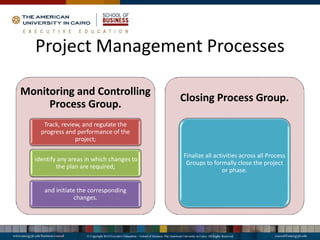
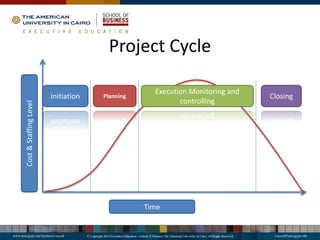
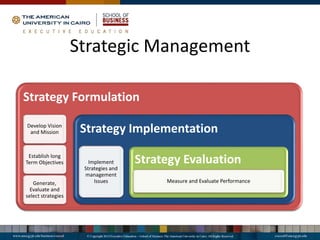
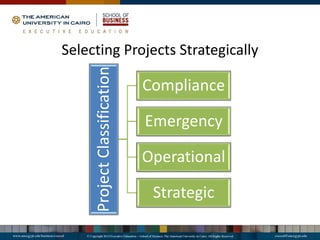
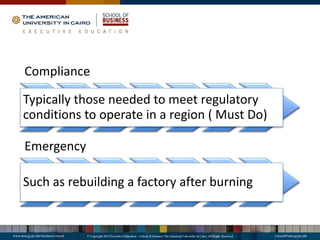
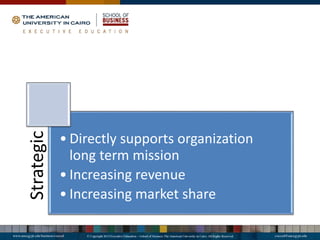
Introduce Your Self
Why Project Management
Expectations
By the end of this module :
• Understand, implement various project
Management Techniques
• You will be able to prepare a full project plan
including scope, time and cost management
using MS Project.
Module Evaluation
Item Grade
Group Presentation (25%) 25%
Assignment and class quizzes (15%) 15%
Class Participation (20%) 20%
Final Project (40%) 40%
Total 100
Project
Management
Framework
Project
Management
Knowledge Areas
Project Execution
& Closing
Module Plan
Module Plan
Project
Management
Framework
History of project
management
Project management
methodology
Definitions
Projects, programs and
portfolios
Role of project manger
Project life cycle
Stack holders
Organization structure and
influence
Selecting projects
strategically
Project management
processes
Project
Management
Knowledge
Areas
Scope management
Time management
Cost management
Risk management
Communication
management
Project
Execution
&
Closing
Scope Control
Time Control
Cost Control
Progress reporting
Earned value
Project management history
Could the Great Wall
of China, the
pyramids, or
Stonehenge have
been built without
project
management?
It is possible to say
that the concept of
project management
has been around
since the beginning
of history.
It has enabled
leaders to plan bold
and massive projects
and manage funding,
materials and labor
within a designated
time frame.
• In late 19th century, in the
United States, large-scale
government projects were the
impetus for making important
decisions that became the
basis for project management
methodology such as the
transcontinental railroad,
which began construction in
the 1860s.
• Suddenly, business leaders
found themselves faced with
the daunting task of organizing
the manual labor of thousands
of workers and the processing
and assembly of
unprecedented quantities of
raw material.
Near the turn of the century, Frederick Taylor began his detailed studies of
work. He applied scientific reasoning to work by showing that labor can be
analyzed and improved by focusing on its elementary parts that introduced
the concept of working more efficiently, rather than working harder and
longer
Taylor’s associate, Henry Gantt, studied in great detail the order of
operations in work and is most famous for developing the Gantt Chart
in the 1910s.
A Gantt chart is a popular type of bar chart that illustrates a project
schedule and have become a common technique for representing the
phases and activities of a project work breakdown structure, so they
can be understood by a wide audience.
Although now considered a common charting technique, Gantt charts
were considered quite revolutionary at the time they were introduced.
Gantt charts were employed on major infrastructure projects including
the Hoover Dam and the Interstate highway system and are still
accepted today as an important tool in project.
• By the mid Twentieth century, the
Manhattan project was initiated and its
complexity was only possible because of
project management methods.
• The Manhattan project was the codename
given to the Allied effort to develop the first
nuclear weapons during World War II.
• It involved over thirty different project sites
in the US and Canada, and thousands of
personnel from US, Canada and UK. Born out
of a small research program that began in
1939, the Manhattan Project would
eventually employ 130,000 people and cost a
total of nearly 2 billion USD and result in the
creation of multiple production and research
sites operated in secret. The project
succeeded in developing and detonating
three nuclear weapons in 1945.
• The 1950s marked the beginning of
the modern Project Management
era. Two mathematical project-
scheduling models were developed:
– The Program Evaluation and Review
Technique or PERT, developed by Booz-
Allen & Hamilton as part of the United
States Navy’s (in conjunction with the
Lockheed Corporation) Polaris missile
submarine program.
– Pert is basically a method for analyzing
the tasks involved for completing a given
project, especially the time needed to
complete each task, and identifying the
minimum time needed to complete the
total project .
The Critical Path Method (CPM)
• developed in a joint venture by both DuPont Corporation and Remington
Rand Corporation for managing plant maintenance projects.
• The critical path determines the float, or schedule flexibility, for each
activity by calculating the earliest start date, earliest finish date, latest
start date, and latest finish date for each activity.
• The critical path is generally the longest full path on the project. Any
activity with a float time that equals zero is considered a critical path
task.
• CPM can help you figure out how long your complex project will take to
complete and which activities are critical; meaning they have to be done
on time or else the whole project will take longer. These mathematical
techniques quickly spread into many private enterprises.
PM Methodology
• Methodology
Definitions
Project
A project is a
temporary endeavor
undertaken to
create a unique
product, service, or
result.
Is
It
A
Project
?
Temporary indicates a
definite beginning and end.
The end is
reached when the
project’s
objectives have
been achieved
Project is
terminated
because its
objectives will not
or cannot be met.
The need for the
project no longer
exists.
Project
Management
Project management is the application of knowledge, skills, tools, and
techniques to project activities to meet the project requirements.
• Identifying requirements,
• Addressing the various needs, concerns, and expectations of the stakeholders as the
project is planned and carried out,
Balancing the competing project constraints including, but not limited
to:
• Scope
• Quality
• Schedule
• Budget
• Ressources
• Risk
Triple Constraint
Scope
Time
Cost
Projects, Programs and Portfolios
Portfolio
Program Program Program
Project Project Project Project
Project Management Environment
•Why we do projects
•Project life cycle
The project
•Role of the project manager
•Project manager skills
•PMO
The project manager
•Organization Chart
•Organization Influence
The performing organization
The stack holders
Project Management Environment
•Why we do projects
•Project life cycle
The project
Projects ….Where they come from?
• Market demand
• Strategic opportunity/business
need
• Customer request
• Technological advance
• Legal requirements
Projects are
often utilized
as a means of
achieving an
organization’s
strategic plan.
Why we do projects ?
Project
Classification
Compliance
Emergency
Operational
Strategic
Compliance
Typically those needed to meet regulatory
conditions to operate in a region ( Must Do)
Emergency
Such as rebuilding a factory after burning
Operational
• Needed to support current operation
• Improve efficiency
• Reduce product cost
• Increase performance
Strategic Management
Strategy Formulation
Develop Vision
and Mission
Establish long
Term Objectives
Generate,
Evaluate and
select strategies
Strategy Implementation
Implement
Strategies and
management
Issues
Strategy Evaluation
Measure and Evaluate Performance
Strategic
• Directly supports organization
long term mission
• Increasing revenue
• Increasing market share
Project Life Cycle
A project life cycle is a
collection of generally
sequential and sometimes
overlapping project phases
The life cycle provides the
basic framework for managing
the project, regardless of the
specific work involved.
Project Management Processes
Initiating
Process
Planning Process
Closing
Process
Project Management Processes
Initiating
Process Group.
Define a new project
or a new phase of an existing
project
by obtaining authorization to
start the project or phase.
Planning
Process Group.
Establish the scope of the
project
refine the objectives,
and define the course of action
required to attain the
objectives that the project was
undertaken to achieve.
Executing
Process Group.
Complete the work defined in
the project management plan
to satisfy the project
specifications.
Project Management Processes
Monitoring and Controlling
Process Group.
Track, review, and regulate the
progress and performance of the
project;
identify any areas in which changes to
the plan are required;
and initiate the corresponding
changes.
Closing Process Group.
Finalize all activities across all Process
Groups to formally close the project
or phase.
Project Cycle
Time
Cost
&
Staffing
Level
Initiation Planning
Execution Monitoring and
controlling
Closing
Project Cycle
Project Time
D
e
g
r
e
e
Low
Stakeholder influence, risk, and uncertainty
Cost of changes
Quiz
Think of the major
differences between
project and product
life cycle
Project Management Environment
• Why we do projects
• Project life cycle
The project
• Role of the project manager
• Project manager skills
• PMO
The project manager
Role of a Project Manager
The project manager is the person assigned by the performing
organization to achieve the project objectives.
effective project management requires that the project
manager possess the following characteristics:
Knowledge.
•This refers to what the project manager knows about
project management.
Performance.
•his refers to what the project manager is able to do or
accomplish while applying their project management
knowledge.
Personal.
•This refers to how the project manager behaves when
performing the project or related activity. Personal
effectiveness encompasses attitudes, core personality
characteristics and leadership—the ability to guide
the project team while achieving project objectives
and balancing the project constraints.
Key General Management Skills
General management is a broad subject dealing
with every aspect of managing an ongoing
enterprise. Among other topics, it includes:
Finance and
accounting, sales
and marketing,
research and
development,
manufacturing and
distribution.
Strategic planning,
tactical planning,
and operational
planning.
Organizational
structures,
organizational
behavior,
personnel
administration,
compensation,
benefits, and
career paths.
Managing work
relationships
through
motivation,
delegation,
supervision, team
building, conflict
management, and
other techniques.
Managing oneself
through personal
time management,
stress
management, and
other techniques.
Leadership
Drive
• Leaders exhibit a high effort level. They have a relatively high
desire for achievement, have a lot of energy, show initiative,
and they’re persistent in their activities
Desire to Lead
• Leaders have a strong desire to influence and lead others,
they demonstrate the willingness to take responsibility
Integrity
• Leaders build trusting relationship between themselves and
followers by being truthful and by showing consistency
between word and deed
Leadership
Self-Confidence
•Followers look to leaders for an absence of self-doubt. Leaders, therefore,
need to show self-confidence in order to convince followers of the
rightness of goals and decisions
Intelligence
•Leaders need to be intelligent enough to gather, synthesize, and
interpret large amounts of information; and to be able to create
visions, solve problem, and make correct decisions
Job-Relevant Knowledge
•Effective leaders have a high degree of knowledge about the company,
industry, and technical matters. In-depth knowledge allows leaders to
make well-informed decisions and to understand the implications of
those decisions.
Communication
Receiver
Decoding
Reaction
Feedback
Message
Channel
Sender
Encoding
Communication
Sender
is responsible for
making the
information clear,
unambiguous, and
complete so that
the receiver can
receive it correctly.
Receiver
is responsible for
making sure that
the information is
received in its
entirety and
understood
correctly.
Message
Written and oral,
listening and speaking.
Internal (within the project)
and external (to the customer,
the media, the public, etc.).
Formal (reports, briefings,
etc.) and informal (memos,
ad hoc conversations, etc.).
Vertical (up and down the
organization) and horizontal
(with peers).
Negotiation
Involves conferring with others in order to come to terms or reach an agreement. Agreements may be
negotiated directly or with assistance; mediation and arbitration are two types of assisted negotiation.
Negotiations occur around many issues, at many times, and at many levels of the project.
During the course of a typical project, project staff are likely to negotiate for any or all of the following:
• Scope, cost, and schedule objectives.
• Changes to scope, cost, or schedule.
• Contract terms and conditions.
• Assignments.
• Resources.
Problem Solving
Problem solving involves a combination of problem definition and decision making.
It is concerned with problems that have already occurred (as opposed to risk
management that addresses potential problems).
•requires distinguishing between causes and symptoms.
Problems may be internal or external. Problems may be
technical, managerial , or interpersonal .
Problem definition
•includes analyzing the problem to identify viable solutions,
and then making a choice from among them. Decisions can be
made or obtained . Once made, decisions must be
implemented. Decisions also have a time element to them—
the “right” decision may not be the “best” decision if it is
made too early or too late.
Decision making
PMO
A project management office (PMO) is an organizational
body or entity assigned various responsibilities related to the
centralized and coordinated management of those projects
under its domain.
The responsibilities of a PMO can range from providing
project management support functions to actually being
responsible for the direct management of a project.
PMO
A primary function of a PMO is to support project
managers in a variety of ways which may include, but are
not limited to:
• Managing shared resources across all projects administered by the PMO
• Identifying and developing project management methodology, best
practices, and standards
• Coaching, mentoring, training, and oversight
• Monitoring compliance with project management standards, policies,
procedures, and templates via project audits
• Developing and managing project policies, procedures, templates, and
other shared documentation (organizational process assets)
• Coordinating communication across projects
Project Management Environment
• Why we do projects
• Project life cycle
The project
• Role of the project manager
• Project manager skills
• PMO
The project manager
• Organization Chart
• Organization Influence
The performing organization
Functional
Organization
CEO
Functional
Manager
Staff
Staff
Functional
Manager
Staff
Staff
Functional
Manager
Staff
Staff
Project
Coordination
Level
CEO
Project
Manager
Staff
Staff
Project
Manager
Staff
Staff
Project
Manager
Staff
Staff
Projectized
Organization
Project
coordination
level
CEO
Functional
Manager
Staff
Staff
Functional
Manager
Staff
Staff
Functional
Manager
Staff
Staff
Weak matrix
Co
ordination
Level
CEO
Functional
Manager
Staff
Project
Manager
Functional
Manager
Staff
Staff
Functional
Manager
Staff
Staff
Balanced matrix
Co
ordination
Level
CEO
Functional
Manager
Staff
Staff
Functional
Manager
Staff
Staff
Functional
Manager
Staff
Staff
Projects
Manager
Project
Manager
Project
Manager
Strong matrix
Co ordination
Level
Organization Influence
Cultures and styles may have a strong influence on
a project’s ability to meet its objectives. Cultures
and styles are typically known as “cultural norms.
Shared visions,
values, norms,
beliefs, and
expectations
Policies,
methods, and
procedures
View of
authority
relationships
Work ethic and
work hours.
Project Management Environment
•Why we do projects
•Project life cycle
The project
•Role of the project manager
•Project manager skills
•PMO
The project manager
•Organization Chart
•Organization Influence
The performing organization
The stack holders
Stake Holders
• The first step in your stakeholder
analysis is to brainstorm who your
stakeholders are. As part of this,
think of all the people who are
affected by your work, who have
influence or power over it, or have
an interest in its successful or
unsuccessful conclusion.
Identifying
Your
Stakeholders
Your boss
Shareholders
Government
Senior executives
Alliance partners
Trades associations
Your coworkers
Suppliers
The press
Your team
Lenders
Interest groups
Customers
The public
Prospective custo
The community
Stake Holders
Prioritize
Your
Stakeholders
You may now have a long list of people and
organizations that are affected by your work.
Some of these may have the power either to
block or advance it. Some may be interested
in what you are doing, others may not care.
Map out your stakeholders on a
Power/Interest Grid , and classify them by
their power over your work and by their
interest in your work.
Stake Holders
Keep Satisfied Manage Closely
Monitor Keep Informed
Interest
P
o
w
e
r
High power,
interested
people
these are the
people you must
fully engage and
make the
greatest efforts
to satisfy.
High power,
less
interested
people
put enough
work in with
these people to
keep them
satisfied, but
not so much
that they
become bored
with your
message.
Low power,
interested
people
keep these
people
adequately
informed, and
talk to them to
ensure that no
major issues are
arising. These
people can
often be very
helpful with the
detail of your
project.
Low power,
less
interested
people
again, monitor
these people,
but do not bore
them with
excessive
communication.
Selecting Projects Strategically
Strategic Management
Strategy Formulation
Develop Vision
and Mission
Establish long
Term Objectives
Generate,
Evaluate and
select strategies
Strategy Implementation
Implement
Strategies and
management
Issues
Strategy Evaluation
Measure and Evaluate Performance
Selecting Projects Strategically
Project
Classification
Compliance
Emergency
Operational
Strategic
Compliance
Typically those needed to meet regulatory
conditions to operate in a region ( Must Do)
Emergency
Such as rebuilding a factory after burning
Operational
• Needed to support current operation
• Improve efficiency
• Reduce product cost
• Increase performance
Strategic
• Directly supports organization
long term mission
• Increasing revenue
• Increasing market share
Ranking and prioritizing projects
Payback
period.
Net present
value.
Internal rate
of return.
Ranking and prioritizing projects
Payback Period
•The no. of periods it will take the
results of the project to recover
the investment from net cash
flow
Payback Period
Year 1 Year 2 Year 3 Year 4 Year 5 Year 6
Income 0 1000 5000 7000 9000 9000
Expendutuer 5000 4000 3000 1000 1000 1000
Net -5000 -3000 2000 6000 8000 8000
Cunulative
Net -5000 -8000 -6000 0 8000 16000
Payback Period
-5000
-3000
2000
6000
8000 8000
Year 1, -5000
Year 2, -8000
Year 3, -6000
Year 4, 0
Year 5, 8000
Year 6, 16000
-10000
-5000
0
5000
10000
15000
20000
Year 1 Year 2 Year 3 Year 4 Year 5 Year 6
Net Cunulative Net Poly. (Cunulative Net)
Net Present Value
Finding the present value
of each cash flow
NPV = Amount / (1+DR)^T
• DR = Discount Rate
• T = Time Period(s)
Ranking and prioritizing projects
• This the discount rate that causes NPV to
equal zero
Internal rate of return
• The potential return on an investment
contemplated
Return on investment
Project A
Time Period Project A (DR + 1) ^ T NPV
0 (1,000,000.00) - (1,000,000.00)
1 450,000.00 1.08 416,666.67
2 400,000.00 1.17 342,935.53
3 350,000.00 1.26 277,841.28
4 300,000.00 1.36 220,508.96
5 250,000.00 1.47 170,145.80
750,000.00 428,098.23
Project A
Time Period Project A (DR + 1) ^ T NPV IRR
0 (1,000,000.00) - (1,000,000.00) (1,000,000.00)
1 450,000.00 1.08 416,666.67 1.25 360,000.00
2 400,000.00 1.17 342,935.53 1.56 256,000.00
3 350,000.00 1.26 277,841.28 1.95 179,200.00
4 300,000.00 1.36 220,508.96 2.44 122,880.00
5 250,000.00 1.47 170,145.80 3.05 81,920.00
750,000.00 428,098.23 25% -
Case Study
Time Period Project A Project B
0 (1,000,000.00) (1,000,000.00)
1 450,000.00 250,000.00
2 400,000.00 300,000.00
3 350,000.00 350,000.00
4 300,000.00 400,000.00
5 250,000.00 450,000.00
In group kindly identify :
Which project can be chosen based on financial returns ??
Compare
Year A B
0 -250 -50
1 35 18
2 80 22
3 130 25
4 160 30
5 175 32
Year A B
- - 250 - 250 - 50 - 50
1 35 32 18 16
2 80 66 22 18
3 130 98 25 19
4 160 109 30 20
5 175 109 32 20
330 164 77 44
28% 37%
Project Management Knowledge Areas
Scope Management
Time Management
Cost Management
Risk Management
Communication Management
Project Scope Management
Project Scope Management includes the processes
required to ensure that the project includes all the
work required, and only the work required, to
complete the project successfully.
Managing the project scope is primarily concerned
with defining and controlling what is and is not
included in the project.
Collect Requirements
• The process of defining and
documenting stakeholders’
needs to meet the project
objectives.
Define Scope
• The process of developing a
detailed description of the
project and product.
Create WBS
• The process of subdividing
project deliverables and
project work into smaller,
more mangeable components.
Define Activities
• The process of identifying the
specific actions to be
performed to produce the
project deliverables.
Collect Requirements
Focus
groups
Focus groups bring together prequalified
stakeholders and subject matter experts to
learn about their expectations and attitudes
about a proposed product, service, or result.
A trained moderator guides the group
through an interactive discussion, designed
to be more conversational than a one on-
one interview.
Group Creativity Techniques
Several group activities can be organized to identify project and product
requirements. Some of the group creativity techniques that can be used are:
Brainstorming.
A technique used to generate and
collect multiple ideas related to
project and product requirements.
Nominal group
technique.
This technique enhances
brainstorming with a voting process
used to rank the most useful ideas
for further brainstorming or for
prioritization.
Idea/mind mapping.
Ideas created through individual
brainstorming are consolidated into a
single map to reflect commonality
and differences in understanding,
and generate new ideas.
Mind Mapping Six Thinking Hats
Questionnaires and Surveys
•Questionnaires and surveys are written sets of questions
designed to quickly accumulate information from a wide
number of respondents.
•Questionnaires and/or surveys are most appropriate with broad
audiences, when quick turnaround is needed, and where
statistical analysis is appropriate.
Prototypes
•Prototyping is a method of obtaining early feedback on
requirements by providing a working model of the
expected product before actually building it.
•Since prototypes are tangible, it allows stakeholders to
experiment with a model of their final product rather
than only discussing abstract representations of their
requirements.
Requirements
Documentation
Requirements documentation describes how individual
requirements meet the business need for the project.
Requirements may start out at a high level and become
progressively more detailed as more is known.
Before being baselined, requirements must be unambiguous
(measurable and testable), traceable, complete, consistent, and
acceptable to key stakeholders.
The format of a requirements document may range from a simple
document listing all the requirements categorized by stakeholder
and priority, to more elaborate forms containing executive
summary, detailed descriptions, and attachments.
• Business need or opportunity to be seized, describing the
limitations of the current situation
• why the project has been undertaken
• Business and project objectives for traceability
• Functional requirements, describing business processes,
information, and interaction with the product
• Quality requirements
• Acceptance criteria
• Business rules stating the guiding principles of the
organization
• Impacts to other organizational areas, such as the call
center, sales force, technology groups
Requirement Document
Define Scope
Is the process of
developing a
detailed description
of the project and
product.
The preparation of a
detailed project
scope statement is
critical to project
success and builds
upon the major
deliverables,
assumptions, and
constraints that are
documented during
project initiation.
During planning, the
project scope is
defined and
described with
greater specificity
as more information
about the project is
known.
Project Scope Statement
The project scope statement describes, in detail, the project’s deliverables and
the work required to create those deliverables.
The project scope statement also provides a common understanding of the
project scope among project stakeholders.
It may contain explicit scope exclusions that can assist in managing stakeholder
expectations.
It enables the project team to perform more detailed planning, guides the project
team’s work during execution, and provides the baseline for evaluating whether
requests for changes or additional work are contained within or outside the
project’s boundaries.
Project Statement
Product
scope
description
Product
acceptance
criteria.
Project
deliverables.
Project
exclusions.
Project
constraints.
Create W.B.S.
Is the process of subdividing project deliverables and project work
into smaller, more manageable components.
The work breakdown structure (WBS) is a deliverable-oriented
hierarchical decomposition of the work to be executed by the
project team to accomplish the project objectives and create the
required deliverables, with each descending level of the WBS
representing an increasingly detailed definition of the project work.
The WBS organizes and defines the total scope of the project, and
represents the work specified in the current approved project scope
statement.
Decomposition
subdivision of project deliverables into
smaller, more manageable components
until the work and deliverables are defined
to the work package level. The work
package level is the lowest level in the
WBS, and is the point at which the cost
and activity durations for the work can be
reliably estimated and managed.
Define Activities
Define Activities is the
process of identifying the
specific actions to be
performed to produce the
project deliverables.
The Create WBS process
identifies the deliverables
at the lowest level in the
Work Breakdown Structure
(WBS), the work package.
Define Activities
Project work packages are
typically decomposed into smaller
components called activities that
represent the work necessary to
complete the work package.
Activities provide a basis for
estimating, scheduling, executing,
and monitoring and controlling
the project work.
WBS Sample
Touristic Villa
Villas
Type A
Sub Structure
Excavation
Foundations
Backfilling
Super Structure
Ground Floor
Columns
Slabs
First Floor
Columns
Slabs
Finishes
Type B
Sub Structure
Super Structure
Finishes
Chalets
Services
Boundary Walls
WBS Sample
• Touristic Villa
1. Villas
1. Type A
1. Sub Structure
1. Excavation
2. Foundations
3. Backfilling
2. Super Structure
1. Ground Floor
1. Columns
2. Slabs
2. First Floor
1. Columns
2. Slabs
3. Finishes
2. Type B
1. Sub Structure
2. Super Structure
3. Finishes
2. Chalets
3. Services
4. Boundary Walls
Time Management
Estimate Activity Resources
The process of
estimating the type
and quantities of
material, people,
equipment, or
supplies required to
perform each
activity.
Estimate Activity Durations
The process of
approximating the
number of work
periods needed to
complete individual
activities with
estimated resources.
Sequence Activities
The process of
identifying and
documenting
relationships among
the project activities.
Develop Schedule
The process of
analyzing activity
sequences,
durations, resource
requirements, and
schedule constraints
to create the project
schedule.
Estimate Activity Resources
Work Packaging
• is the process of estimating the type and quantities of
resources required to perform each activity.
4M
• Manpower
• Material
• Machinery
• Money
Estimate Activity Resources
WBS Activity Qty. Manpower Machinery Material Money
1.1.2.1.1 Columns 20 M3 4 C 2 M3
Shuttering
8 H 10 Kg
Nails
Estimate
Activity
Durations
Estimate Activity Durations is the process of
approximating the number of work periods
needed to complete individual activities
with estimated resources.
Estimating activity durations uses
information on activity scope of work,
required resource types, estimated resource
quantities, and resource calendars.
Estimation
Tools
Previous History.
• If your organization keeps track of actual effort hours and costs from
previous projects, you may have information that will help you estimate
similar new work.
• In this method, the characteristics of the prior work, along with the actual
effort hours and cost, are saved so that the information can be leveraged
for future projects.
Analogy.
• Even if you do not keep actual effort hours from previous projects, you may
still be able to leverage previous work.
• Analogy means that you find similar projects, even if the project team did
not collect actual effort hours worked. For example, let's say a prior project
was estimated to take six months and 2000 hours to complete. If the
project actually was completed in six months, there is a good likelihood that
the project also took approximately 2000 hours of effort.
Estimation
Tools
Ratio.
•Ratio is similar to analogy except that you have some basis for comparing work that has
similar characteristics, but on a larger or smaller scale.
•For instance, you may find that the effort required to complete an office move for the
Miami office was 500 hours and that one of the big drivers for the effort is the number of
people at the office.
•If there are twice as many people in the Chicago office, you may be able to conclude the
work may take 1000 hours there.
Expert Opinion.
•In many cases you may need to go to an internal or external expert to get help estimating
the work.
•For instance, if this is the first time you have used a new technology, you may need the help
of an outside research firm to provide estimating information.
•Many times these estimates are based on what other companies in the industry are
experiencing.
•You may also have an internal expert who can help. Although this may be your first time
estimating a certain piece of work, perhaps someone else has done it many times.
Estimation
Tools
PERT
• (Program Evaluation and Review Technique). PERT is an estimating
technique that used a weighted average of three numbers to come up
with a final estimate.
• Using the PERT technique, if you are asked to estimate the effort
required to complete an activity, you would start with three estimates -
the most pessimistic (P) case when everything goes wrong, the most
optimistic (O) case when everything goes right, and the most likely (M)
case given normal problems and opportunities. The resulting PERT
estimate is (O + 4M + P)/6.
• For example, if the most likely estimate is 10 hours, the optimistic
estimate is 6 hours and the pessimistic estimate is 26 hours. The PERT
estimate is (6 + 4(10) + 26)/6. The answer is 72/6, or 12 hours. Notice
that the number was pulled a little toward the pessimistic estimate, but
not by much, since the result is still weighted heavily toward the most
likely value.
Estimation
Tools
Parametric Modeling.
• In this technique, a pattern must exist in
the work that allows you to use an
algorithm to drive the overall estimate.
• For instance, if you know that you can build
one mile of flat one-lane highway for one
million dollars, you should be able to easily
calculate an estimate for ten miles of flat
four-lane highway (40 million dollars).
Sequence Activities
Sequence Activities is the
process of identifying and
documenting relationships
among the project activities.
Activities are sequenced using
logical relationships. Every
activity and milestone except
the first and last are
connected to at least one
predecessor and one
successor.
It may be necessary to use
lead or lag time between
activities to support a realistic
and achievable project
schedule.
Dependencies
Mandatory dependencies.
Are those that are contractually required or
inherent in the nature of the work.
The project team determines which
dependencies are mandatory during the
process of sequencing the activities.
Dependencies
Discretionary dependencies.
The project team determines which dependencies are discretionary during the process of
sequencing the activities.
Discretionary dependencies are sometimes referred to as preferred logic, preferential
logic, or soft logic.
Discretionary dependencies are established based on knowledge of best practices within
a particular application area or some unusual aspect of the project where a specific
sequence is desired, even though there may be other acceptable sequences
Dependencies
External dependencies.
The project management team determines
which dependencies are external during the
process of sequencing the activities.
External dependencies involve a relationship
between project activities and non-project
activities.
Leads and Lags
A lead
Allows an
acceleration of
the successor
activity.
A lag
Directs a delay
in the
successor
activity.
Dependencies
A
B
Finish to Start
F.S.
Dependencies
A
B
Start to Start
S.S.
Dependencies
A
B
Finish to Finish
F.F.
PDM
/
AON
Schedule Development
Develop
Scheduleis the process of analyzing activity
sequences, durations, resource
requirements, and schedule
constraints to create the project
schedule. Entering the activities,
durations, and resources into the
scheduling tool generates a
schedule with planned dates for
completing project activities.
Schedule Development
Project
Calendar
• What are the working hours, days off of the
project
Resource
Calendar
• When each resource will be available to each
activity
Mile Stones • Any mile stones for any of the deliverables
Forced Dates
• Any forced date for activity, sub deliverable
or deliverable
Fixed Duration
• Project given duration. For example allowing
1 year for the project to be finished
CPM
Calculates the theoretical early start and finish
dates, and late start and finish dates, for all
activities without regard for any resource
limitations, by performing a forward and
backward pass analysis through the schedule
network.
The resulting early and late start and finish dates
are not necessarily the project schedule; rather,
they indicate the time periods within which the
activity could be scheduled, given activity
durations, logical relationships, leads, lags, and
other known constraints.
Forward Scheduling
Project
Start
Date
Add
Duration
Examine
Relationship
Activity Early
Start and
Finish Date
Project End
Date
Project
Duration
Backward Scheduling
Calculated
Project End
Date
Subtract
Duration
Examine
Relationship
Activity's Late
Start & Finish
Dates
Critical
Activities
Critical Path
Non Critical
Activities
Activity’s Float
Resource Leveling
Resource leveling is a schedule network analysis technique
applied to a schedule that has already been analyzed by the
critical path method.
Resource leveling can be used when shared or critical required
resources are only available at certain times, are only available in
limited quantities, or to keep Resource usage at a constant level.
Crashing
• A schedule compression technique in which cost and schedule
tradeoffs are analyzed to determine how to obtain the greatest
amount of compression for the least incremental cost.
• Examples of crashing could include approving overtime,
bringing in additional resources, or paying to expedite delivery
to activities on the critical path.
• Crashing only works for activities where additional resources
will shorten the duration. Crashing does not always produce a
viable alternative and may result in increased risk and/or cost.
Fast
tracking
• A schedule compression technique in which phases or
activities normally performed in sequence are performed
in parallel.
• An example is constructing the foundation for a building
before completing all of the architectural drawings.
• Fast tracking may result in rework and increased risk.
• Fast tracking only works if activities can be overlapped to
shorten the duration.
Cost Management
Estimate Costs
• The process of developing an
approximation of the monetary
resources needed to complete project
activities.
Determine Budget
• The process of aggregating the
estimated costs of individual activities
or work packages to establish an
authorized cost baseline.
Cost Estimate
Estimate Costs
•is the process of developing
an approximation of the
monetary resources needed
to complete project activities.
Analogous Estimating
Analogous cost estimating uses the values of parameters, such as
scope, cost, budget, and duration or measures of scale such as size,
weight, and complexity, from a previous, similar project as the basis
for estimating the same parameter or measure for a current project.
is generally less costly and time consuming than other techniques,
but it is also generally less accurate.
Parametric
Estimating
• Parametric estimating uses a statistical
relationship between historical data and
other variables (e.g., square footage in
construction) to calculate an estimate for
activity parameters, such as cost, budget,
and duration.
Bottom-Up Estimating
• Bottom-up estimating is a method o estimating a
component of work.
• The cost of individual work packages or activities
is estimated with the greatest level of specified
detail.
Three-Point Estimates
The accuracy of single-point
activity cost estimates can be
improved by considering
estimation uncertainty and risk.
This concept originated with
the program evaluation and
review technique (PERT).
PERT uses three estimates to define an approximate range for an activity’s cost:
Most likely (cM). The cost of
the activity, based on realistic
effort assessment for the
required work and any
predicted expenses.
Optimistic (cO). The activity
cost based on analysis of the
best-case scenario for the
activity.
Pessimistic (cP). The activity
cost based on analysis of the
worst-case scenario for the
activity.
Determine Budget
Determine Budget is the process
of aggregating the estimated
costs of individual activities or
work packages to establish an
authorized cost baseline.
• The cost performance baseline is an
authorized time-phased budget at completion
(BAC) used to measure, monitor, and control
overall cost performance on the project.
• It is developed as a summation of the
approved budgets by time period and is
typically displayed in the form of an S-curve
Cost Performance Baseline
Risk Management
• Project Risk Management includes the
processes of conducting risk management
planning, identification, analysis, response
planning, and monitoring and control on a
project. The objectives of Project Risk
Management are to increase the probability
and impact of positive events, and decrease
the probability and impact of negative events
in the project.
• The process of defining how to conduct risk management activities for
a project.
Plan Risk Management
• The process of determining which risks may affect the project and
documenting their characteristics.
Identify Risks
• The process of prioritizing risks for further analysis or action by
assessing and combining their probability of occurrence and impact.
Perform Qualitative Risk Analysis
• The process of numerically analyzing the effect
of identified risks on overall project objectives.
Perform Quantitative Risk Analysis
• The process of developing options and actions to
enhance opportunities and to reduce threats to
project objectives.
Plan Risk Responses
Plan
Risk
Management
Plan Risk Management is the process of defining how to
conduct risk management activities for a project
Planning is also important to provide sufficient
resources and time for risk management activities, and
to establish an agreed-upon basis for evaluating risks.
The Plan Risk Management process should begin as a
project is conceived and should be completed early
during project planning.
Risk
Management
Plan The risk management
plan describes how risk
management will be
structured and performed
on the project.
The risk
management
plan includes
the
following:
Methodology. Defines the approaches,
tools, and data sources that
may be used to perform risk
management on the project.
Roles and
responsibilities.
Defines the lead, support,
and risk management team
members for each type of
activity in the risk
management plan, and
clarifies their responsibilities.
Budgeting. Assigns resources, estimates funds needed for risk
management for inclusion in the cost performance baseline
Timing. Defines when and how often the risk management process
will be performed throughout the project life cycle
Risk
categories.
Provides a structure that ensures a comprehensive process
of systematically identifying risks to a consistent level of
detail and contributes to the effectiveness and quality of the
Identify Risks process.
Definitions
of risk
probability
and
impact.
The quality and credibility
of the Perform Qualitative
Risk Analysis process
requires that different levels
of the risks’ probabilities
and impacts be defined.
Identify Risks
Identify Risks is the process of determining which risks may affect the project
and documenting their characteristics
Participants in risk identification activities can include the following:
project manager, project team members, risk management team (if assigned),
customers, subject matter experts from outside the project team, end users,
other project managers, stakeholders
While these personnel are often key participants for risk identification, all
project personnel should be encouraged to identify risks.
Risk Identification Tools
Information
gathering
Techniques
Brainstorming.
The goal of brainstorming is to obtain a
comprehensive list of project risks. The
project team usually perform
brainstorming, often with a
multidisciplinary set of experts who are
not part of the team.
Interviewing.
Interviewing experienced project
participants, stakeholders, and subject
matter experts can identify risks.
Root cause
analysis
is a specific technique to identify a
problem, discover the underlying causes
that lead to it, and develop preventive
action.
Risk Identification Tools
Diagramming
Techniques Cause and
effect
diagrams
also known as
Ishikawa or fishbone
diagrams, and are
useful for identifying
causes of risks.
System or
process flow
charts.
These show how
various elements of a
system interrelate,
and the mechanism
of causation
Design Review
Revise
Yes
No
Risk Identification Tools
SWOT Analysis
• This technique examines the project from each of the SWOT (strengths,
weaknesses, opportunities, and threats) perspectives to increase the
breadth of identified risks by including internally generated risks.
• The technique starts with identification of strengths and weaknesses of
the organization, focusing on either the project organization or the wider
business. These factors are often identified using brainstorming.
• SWOT analysis then identifies any opportunities for the project that arise
from organizational strengths, and any threats arising from organizational
weaknesses.
• SWOT analysis also examines the degree to which organizational
strengths offset threats and opportunities that may serve to overcome
weaknesses.
Risk Identification Outputs
Risk Register The primary outputs from Identify Risks are the initial
entries into the risk register.
List of identified risks.
• The identified risks are described in as much detail as is reasonable. A simple
structure for risks in the list may be applied
List of potential responses.
• Potential responses to a risk may sometimes be identified during the Identify Risks
process. These responses, if identified in this process, may be useful as inputs to
the Plan Risk Responses process
Perform Qualitative Risk Analysis
Perform Qualitative Risk Analysis is the process of prioritizing risks for further analysis or action
by assessing and combining their probability of occurrence and impact
Organizations can improve the project’s performance by focusing on high-priority risks.
Perform Qualitative Risk Analysis assesses the priority of identified risks using their relative
probability or likelihood of occurrence, the corresponding impact on project objectives if the
risks occur, as well as other factors such as the time frame for response and the organization’s
risk tolerance associated with the project constraints of cost, schedule, scope, and quality.
Perform Qualitative Risk Analysis Tools
Probability and Impact Matrix
• Risks can be prioritized for further quantitative
analysis and response based on their risk rating.
• Usually, these risk-rating rules are specified by
the organization in advance of the project and
included in organizational process assets. Risk-
rating rules can be tailored to the specific
project in the Plan Risk Management process
Perform Qualitative Risk Analysis Tools
Risk Data
Quality
Assessment
A qualitative risk analysis requires accurate and unbiased
data if it is to be credible.
Analysis of the quality of risk data is a technique to evaluate
the degree to which the data about risks are useful for risk
management.
It involves examining the degree to which the risk is
understood and the accuracy, quality, reliability, and integrity
of the data regarding the risk. If data quality is unacceptable,
it may be necessary to gather higher-quality data.
Perform Qualitative Risk Analysis Tools
Risk
Categorization Risks to the project can be categorized by
sources of risk (e.g., using the RBS), the
area of the project affected (e.g., using
the WBS), or other useful category (e.g.,
project phase) to determine areas of the
project most exposed to the effects of
uncertainty. Grouping risks by common
root causes can lead to developing
effective risk responses.
Perform Quantitative Risk Analysis
Perform Quantitative Risk Analysis is the process of
numerically analyzing the effect of identified risks on
overall project objectives
Perform Quantitative Risk Analysis is performed on risks
that have been prioritized by the Perform Qualitative
Risk Analysis process as potentially and substantially
impacting the project’s competing demands
Perform Quantitative Risk Analysis Tools
Quantitative
Risk Analysis
and
Modeling
Techniques
Expected
monetary
value
analysis.
Expected monetary
value (EMV) analysis
is a statistical concept
that calculates the
average outcome
when the future
includes scenarios
that may or may not
happen
Quiz
You have to decide whether to approve an aggressive time
schedule or a conservative one.
The probability to achieve with an aggressive time schedule
are 20 %, while with the conservative one is 70%.
The return on the achievement are 100,000 $ for aggressive
and 10,000 $ for a conservative.
In all of the cases non achievement is subjected to 20,000 $
benalty
Use EMV to clarify your decision.
Perform Quantitative Risk Analysis Output
• With the risks facing the project, the probability of achieving
project objectives under the current plan can be estimated using
quantitative risk analysis results.
Probability of achieving cost and time objectives.
• This list of risks includes those that pose the greatest threat or
present the greatest opportunity to the project.
• These include the risks that may have the greatest effect on cost
contingency and those that are most likely to influence the
critical path.
Prioritized list of quantified risks.
Plan Risk Responses
• is the process of developing options and
actions to enhance opportunities and to
reduce threats to project objectives
Strategies for Negative Risks or Threats
Avoid Transfer
Mitigate Accept
Avoid. Risk avoidance involves changing the project management
plan to eliminate the threat entirely.
The project manager may also isolate the project objectives
from the risk’s impact or change the objective that is in
jeopardy.
Examples of this include extending the schedule, changing
the strategy, or reducing scope.
The most radical avoidance strategy is to shut down the
project entirely.
Transfer. Risk transfer requires shifting some
or all of the negative impact of a
threat, along with ownership of the
response, to a third party.
Transferring the risk simply gives
another party responsibility for its
management—it does not eliminate
it.
Transferring liability for risk is most
effective in dealing with financial risk
exposure.
Transference tools
insurance
Performance bonds
Warranties
Guarantees
Contracts may be used to transfer liability for specified risks to another party.
Mitigate. Risk mitigation implies a reduction in
the probability and/or impact of an
adverse risk event to be within
acceptable threshold limits.
Where it is not possible to reduce
probability, a mitigation response might
address the risk impact by targeting
linkages that determine the severity.
Accept. This strategy is adopted because it is seldom possible to
eliminate all threats from a project.
This strategy can be either passive or active.
Passive acceptance requires no action except to document
the strategy, leaving the project team to deal with the risks
as they occur.
The most common active acceptance strategy is to establish
a contingency reserve, including amounts of time, money, or
resources to handle the risks.
Strategies for Positive Risks or Opportunities
Exploit Share
Enhance Accept
Exploit. This strategy may be selected for risks with
positive impacts where the organization
wishes to ensure that the opportunity is
realized.
Examples of directly exploiting responses
include assigning an organization’s most
talented resources to the project to reduce
the time to completion or to provide lower
cost than originally planned.
Share. Sharing a positive risk involves allocating some or all of
the ownership of the opportunity to a third party who
is best able to capture the opportunity for the benefit
of the project.
Examples of sharing actions include forming risk-
sharing partnerships, teams, special-purpose
companies, or joint ventures, which can be established
with the express purpose of taking advantage of the
opportunity so that all parties gain from their actions.
Enhance. This strategy is used to increase the
probability and/or the positive
impacts of an opportunity.
Identifying and maximizing key
drivers of these positive-impact risks
may increase the probability of their
occurrence.
Accept.
Accepting an opportunity
is being willing to take
advantage of it if it comes
along, but not actively
pursuing it
Plan Risk Response Outputs
• Identified risks
• Risk owners and assigned responsibilities
• Outputs from the Perform Qualitative Analysis process
• Agreed-upon response strategies
• Specific actions to implement the chosen response strategy
• Triggers, symptoms, and warning signs of risks’ occurrence
• Budget and schedule activities required to implement the chosen
responses
• Contingency plans and triggers that call for their execution
• Residual risks that are expected to remain after planned responses have
been taken, as well as those that have been deliberately accepted
• Secondary risks that arise as a direct outcome of implementing a risk
response
• Contingency reserves that are calculated based on the quantitative risk
analysis of the project and the organization’s risk thresholds.
Communication Management
Identify Stakeholders
•The process of
identifying all
people or
organizations
impacted by the
project, and
documenting
relevant
information
regarding their
interests,
involvement, and
impact on project
success.
Plan
Communications
•The process of
determining the
project
stakeholder
information
needs and
defining a
communication
approach.
Manage Stakeholder
Expectations
•The process of
communicating
and working with
stakeholders to
meet their needs
and addressing
issues as they
occur.
Stake Holders
• The first step in your stakeholder
analysis is to brainstorm who your
stakeholders are. As part of this,
think of all the people who are
affected by your work, who have
influence or power over it, or have
an interest in its successful or
unsuccessful conclusion.
Identifying
Your
Stakeholders
Stake Holders
Keep Satisfied Manage Closely
Monitor Keep Informed
Interest
P
o
w
e
r
Plan Communications
Plan Communications is the process of determining the project
stakeholder information needs and defining a communication
approach.
who needs what information, when they will need it, how it will be
given to them, and by whom.
While all projects share the need to communicate project information,
the informational needs and methods of distribution vary widely.
Identifying the information needs of the stakeholders and determining
a suitable means of meeting those needs are important factors for
project success.
Communication Methods
Interactive
communication.
Between two or more parties performing a multidirectional exchange of information.
It is the most efficient way to ensure a common understanding by all participants on specified topics,
and includes meetings, phone calls, video conferencing, etc.
Push
communication.
Sent to specific recipients who need to know the information.
This ensures that the information is distributed but does not certify that it actually reached or was
understood by the intended audience.
Push communication includes letters, memos, reports, emails, faxes, voice mails, press releases etc.
Pull
communication.
Used for very large volumes of information, or for very large audiences, that requires the recipients to
access the communication content at their own discretion.
These methods include intranet sites, e-learning, and knowledge repositories, etc.
Communication Management Plan
Stakeholder communication requirements;
Information to be communicated, including language, format, content, and level of detail;
Reason for the distribution of that information;
Time frame and frequency for the distribution of required information;
Person responsible for communicating the information;
Person responsible for authorizing release of confidential information;
Person or groups who will receive the information;
Methods or technologies used to convey the information, such as memos, e-mail, and/or press releases;
Communication Management Plan
Resources allocated for communication activities, including time and budget;
Escalation process identifying time frames and the management chain
(names) for escalation of issues that cannot be resolved at a lower staff level;
Method for updating and refining the communications management plan as
the project progresses and develops;
Glossary of common terminology;
Flow charts of the information flow in the project, workflows with possible
sequence of authorization, list of reports, and meeting plans, etc.
Communication constraints, usually derived from specific legislation or
regulation, technology, and organizational policies, etc.
Manage Stakeholder Expectations
Is the process of communicating and
working with stakeholders to meet their
needs and addressing issues as they
occur.
Actively
Addressing concerns
Clarifying and resolving
•managing the expectations of stakeholders to
increase the likelihood of project acceptance by
negotiating and influencing their desires to
achieve and maintain the project goals,
•that have not become issues yet, usually related
to the anticipation of future problems.
•These concerns need to be uncovered and
discussed, and the risks need to be assessed
•issues that have been identified. The resolution
may result in a change request or may be
addressed outside of the project, for example,
postponed for another project or phase or
deferred to another organizational entity.
Project Monitoring & Control
Scope
Control
Time
Control
Cost
Control
Scope Control
Is the process of formalizing
acceptance of the completed
project deliverables.
Includes reviewing deliverables
with the customer or sponsor to
ensure that they are completed
satisfactorily and obtaining formal
acceptance of deliverables by the
customer or sponsor. Scope
verification differs from quality
control in that scope verification is
primarily concerned with
acceptance of the deliverables,
while quality control is primarily
concerned with correctness of the
deliverables and meeting the
quality requirements specified for
the deliverables.
Verify Scope
Control Scope
Is the process of monitoring the status of the project and product
scope and managing changes to the scope baseline.
Controlling the project scope ensures all requested changes and
recommended corrective or preventive actions are processed
through the Perform Integrated Change Control process
Project scope control is also used to manage the actual changes
when they occur and is integrated with the
other control processes.
Control Schedule
Is the process of monitoring the status of the project to update
project progress and manage Changes to the schedule baseline.
Determining the current status of the project schedule
Influencing the factors that create schedule changes
Determining that the project schedule has changed, Managing
the actual changes as they occur.
Earned value analysis.
• in its various forms is the most commonly used method of performance
measurement. It integrates scope, cost, and schedule measures to help
the project management team assess project performance.
Performance reporting
• The budget, also called the budgeted cost of work scheduled (BCWS), is that
portion of the approved cost estimate planned to be spent on the activity during a
given period.
• The actual cost, also called the actual cost of work performed (ACWP), is the total
of direct and indirect costs incurred in accomplishing work on the activity during a
given period.
• The earned value, also called the budgeted cost of work performed (BCWP), is a
percentage of the total budget equal to the percentage of the work actually
completed.
• The most commonly used measures are
• the cost variance (CV = BCWP – ACWP), the schedule variance (SV = BCWP –
BCWS).
Earned value involves calculating three key values for each activity:
Performance reporting
Performance Assessment
Earned Value
Planned Value
Budgeted Cost of
Work Scheduled
(BCWS)
Jan Feb Mar Apr May Jun Jul Aug Sep Oct Nov Dec
PV 0 1.5 2.5 3 4 6 8 10 12 14 15 16
0
1.5
2.5 3
4
6
8
10
12
14
15
16
0
2
4
6
8
10
12
14
16
18
Axis
Title
PV
Performance Assessment
Earned Value
Earned Value (EV)
Budgeted Cost of
Work Performed
(BCWP)
Jan Feb Mar Apr May Jun Jul Aug Sep Oct Nov Dec
PV 0 1.5 2.5 3 4 6 8 10 12 14 15 16
EV 0 1.5 2.5 2.6 3 4.5 6 7
0
1.5
2.5 3
4
6
8
10
12
14
15
16
0
1.5
2.5 2.6 3
4.5
6
7
0
2
4
6
8
10
12
14
16
18
Axis
Title
Performance Assessment
Earned Value
Actual Cost (AC)
Actual Cost of Work
Performed (ACWP)
Jan Feb Mar Apr May Jun Jul Aug Sep Oct Nov Dec
PV 0 1.5 2.5 3 4 6 8 10 12 14 15 16
AC 0 1.5 2.5 2.6 3 4 5 5.5
0
1.5
2.5 3
4
6
8
10
12
14
15
16
0
1.5
2.5 2.6 3
4
5 5.5
0
2
4
6
8
10
12
14
16
18
Axis
Title
Performance Assessment
Earned Value
Jan Feb Mar Apr May Jun Jul Aug Sep Oct Nov Dec
PV 0 1.5 2.5 3 4 6 8 10 12 14 15 16
EV 0 1.5 2.5 2.6 3 4.5 6 7
AC 0 1.5 2.5 2.6 3 4 5 5.5
0
1.5
2.5 3
4
6
8
10
12
14
15
16
0
1.5
2.5 2.6 3
4.5
6
7
0
1.5
2.5 2.6 3
4
5 5.5
0
2
4
6
8
10
12
14
16
18
Axis
Title
Performance Assessment
Earned Value
• SV = EV – PV
• SV = 7 -10 =-3
Schedule
Variance SV
• SPI = EV / PV
• SPI = 7 / 10 = 0.7
Schedule
Performance
Indicator SPI
• ETC = (BAC/SPI)/ (BAC/month)
• ETC = (16 / o.7) / (16 /12 ) = 17.2
Estimated Time
to Completion
ETC
Performance Assessment
Earned Value
Cost
Variance CV
CV = EV –
AC
CV = 7 –
5.5 = 1.5
Cost
Performance
Index CPI
CPI = EV /
AC
CPI = 7 /
5.5 = 1.27
Estimated
Cost @
Completion
ECC = BAC
/ CPI
ECC = 16 /
1.27 = 12.6

Project management fundamentals PM_Auc_2015.pptx

  • 2.
  • 3.
    Why Project Management Expectations Bythe end of this module : • Understand, implement various project Management Techniques • You will be able to prepare a full project plan including scope, time and cost management using MS Project.
  • 4.
    Module Evaluation Item Grade GroupPresentation (25%) 25% Assignment and class quizzes (15%) 15% Class Participation (20%) 20% Final Project (40%) 40% Total 100
  • 5.
  • 6.
    Module Plan Project Management Framework History ofproject management Project management methodology Definitions Projects, programs and portfolios Role of project manger Project life cycle Stack holders Organization structure and influence Selecting projects strategically Project management processes Project Management Knowledge Areas Scope management Time management Cost management Risk management Communication management Project Execution & Closing Scope Control Time Control Cost Control Progress reporting Earned value
  • 7.
    Project management history Couldthe Great Wall of China, the pyramids, or Stonehenge have been built without project management? It is possible to say that the concept of project management has been around since the beginning of history. It has enabled leaders to plan bold and massive projects and manage funding, materials and labor within a designated time frame.
  • 8.
    • In late19th century, in the United States, large-scale government projects were the impetus for making important decisions that became the basis for project management methodology such as the transcontinental railroad, which began construction in the 1860s. • Suddenly, business leaders found themselves faced with the daunting task of organizing the manual labor of thousands of workers and the processing and assembly of unprecedented quantities of raw material.
  • 9.
    Near the turnof the century, Frederick Taylor began his detailed studies of work. He applied scientific reasoning to work by showing that labor can be analyzed and improved by focusing on its elementary parts that introduced the concept of working more efficiently, rather than working harder and longer
  • 10.
    Taylor’s associate, HenryGantt, studied in great detail the order of operations in work and is most famous for developing the Gantt Chart in the 1910s. A Gantt chart is a popular type of bar chart that illustrates a project schedule and have become a common technique for representing the phases and activities of a project work breakdown structure, so they can be understood by a wide audience. Although now considered a common charting technique, Gantt charts were considered quite revolutionary at the time they were introduced. Gantt charts were employed on major infrastructure projects including the Hoover Dam and the Interstate highway system and are still accepted today as an important tool in project.
  • 11.
    • By themid Twentieth century, the Manhattan project was initiated and its complexity was only possible because of project management methods. • The Manhattan project was the codename given to the Allied effort to develop the first nuclear weapons during World War II. • It involved over thirty different project sites in the US and Canada, and thousands of personnel from US, Canada and UK. Born out of a small research program that began in 1939, the Manhattan Project would eventually employ 130,000 people and cost a total of nearly 2 billion USD and result in the creation of multiple production and research sites operated in secret. The project succeeded in developing and detonating three nuclear weapons in 1945.
  • 12.
    • The 1950smarked the beginning of the modern Project Management era. Two mathematical project- scheduling models were developed: – The Program Evaluation and Review Technique or PERT, developed by Booz- Allen & Hamilton as part of the United States Navy’s (in conjunction with the Lockheed Corporation) Polaris missile submarine program. – Pert is basically a method for analyzing the tasks involved for completing a given project, especially the time needed to complete each task, and identifying the minimum time needed to complete the total project .
  • 13.
    The Critical PathMethod (CPM) • developed in a joint venture by both DuPont Corporation and Remington Rand Corporation for managing plant maintenance projects. • The critical path determines the float, or schedule flexibility, for each activity by calculating the earliest start date, earliest finish date, latest start date, and latest finish date for each activity. • The critical path is generally the longest full path on the project. Any activity with a float time that equals zero is considered a critical path task. • CPM can help you figure out how long your complex project will take to complete and which activities are critical; meaning they have to be done on time or else the whole project will take longer. These mathematical techniques quickly spread into many private enterprises.
  • 14.
  • 15.
  • 16.
    Project A project isa temporary endeavor undertaken to create a unique product, service, or result. Is It A Project ?
  • 17.
    Temporary indicates a definitebeginning and end. The end is reached when the project’s objectives have been achieved Project is terminated because its objectives will not or cannot be met. The need for the project no longer exists.
  • 18.
    Project Management Project management isthe application of knowledge, skills, tools, and techniques to project activities to meet the project requirements. • Identifying requirements, • Addressing the various needs, concerns, and expectations of the stakeholders as the project is planned and carried out, Balancing the competing project constraints including, but not limited to: • Scope • Quality • Schedule • Budget • Ressources • Risk
  • 19.
  • 20.
    Projects, Programs andPortfolios Portfolio Program Program Program Project Project Project Project
  • 21.
    Project Management Environment •Whywe do projects •Project life cycle The project •Role of the project manager •Project manager skills •PMO The project manager •Organization Chart •Organization Influence The performing organization The stack holders
  • 22.
    Project Management Environment •Whywe do projects •Project life cycle The project
  • 23.
    Projects ….Where theycome from? • Market demand • Strategic opportunity/business need • Customer request • Technological advance • Legal requirements Projects are often utilized as a means of achieving an organization’s strategic plan.
  • 24.
    Why we doprojects ? Project Classification Compliance Emergency Operational Strategic
  • 25.
    Compliance Typically those neededto meet regulatory conditions to operate in a region ( Must Do) Emergency Such as rebuilding a factory after burning
  • 26.
    Operational • Needed tosupport current operation • Improve efficiency • Reduce product cost • Increase performance
  • 27.
    Strategic Management Strategy Formulation DevelopVision and Mission Establish long Term Objectives Generate, Evaluate and select strategies Strategy Implementation Implement Strategies and management Issues Strategy Evaluation Measure and Evaluate Performance
  • 28.
    Strategic • Directly supportsorganization long term mission • Increasing revenue • Increasing market share
  • 29.
    Project Life Cycle Aproject life cycle is a collection of generally sequential and sometimes overlapping project phases The life cycle provides the basic framework for managing the project, regardless of the specific work involved.
  • 30.
  • 31.
    Project Management Processes Initiating ProcessGroup. Define a new project or a new phase of an existing project by obtaining authorization to start the project or phase. Planning Process Group. Establish the scope of the project refine the objectives, and define the course of action required to attain the objectives that the project was undertaken to achieve. Executing Process Group. Complete the work defined in the project management plan to satisfy the project specifications.
  • 32.
    Project Management Processes Monitoringand Controlling Process Group. Track, review, and regulate the progress and performance of the project; identify any areas in which changes to the plan are required; and initiate the corresponding changes. Closing Process Group. Finalize all activities across all Process Groups to formally close the project or phase.
  • 33.
  • 34.
    Project Cycle Project Time D e g r e e Low Stakeholderinfluence, risk, and uncertainty Cost of changes
  • 35.
    Quiz Think of themajor differences between project and product life cycle
  • 36.
    Project Management Environment •Why we do projects • Project life cycle The project • Role of the project manager • Project manager skills • PMO The project manager
  • 37.
    Role of aProject Manager The project manager is the person assigned by the performing organization to achieve the project objectives. effective project management requires that the project manager possess the following characteristics: Knowledge. •This refers to what the project manager knows about project management. Performance. •his refers to what the project manager is able to do or accomplish while applying their project management knowledge. Personal. •This refers to how the project manager behaves when performing the project or related activity. Personal effectiveness encompasses attitudes, core personality characteristics and leadership—the ability to guide the project team while achieving project objectives and balancing the project constraints.
  • 38.
    Key General ManagementSkills General management is a broad subject dealing with every aspect of managing an ongoing enterprise. Among other topics, it includes: Finance and accounting, sales and marketing, research and development, manufacturing and distribution. Strategic planning, tactical planning, and operational planning. Organizational structures, organizational behavior, personnel administration, compensation, benefits, and career paths. Managing work relationships through motivation, delegation, supervision, team building, conflict management, and other techniques. Managing oneself through personal time management, stress management, and other techniques.
  • 39.
    Leadership Drive • Leaders exhibita high effort level. They have a relatively high desire for achievement, have a lot of energy, show initiative, and they’re persistent in their activities Desire to Lead • Leaders have a strong desire to influence and lead others, they demonstrate the willingness to take responsibility Integrity • Leaders build trusting relationship between themselves and followers by being truthful and by showing consistency between word and deed
  • 40.
    Leadership Self-Confidence •Followers look toleaders for an absence of self-doubt. Leaders, therefore, need to show self-confidence in order to convince followers of the rightness of goals and decisions Intelligence •Leaders need to be intelligent enough to gather, synthesize, and interpret large amounts of information; and to be able to create visions, solve problem, and make correct decisions Job-Relevant Knowledge •Effective leaders have a high degree of knowledge about the company, industry, and technical matters. In-depth knowledge allows leaders to make well-informed decisions and to understand the implications of those decisions.
  • 41.
  • 42.
    Communication Sender is responsible for makingthe information clear, unambiguous, and complete so that the receiver can receive it correctly. Receiver is responsible for making sure that the information is received in its entirety and understood correctly. Message Written and oral, listening and speaking. Internal (within the project) and external (to the customer, the media, the public, etc.). Formal (reports, briefings, etc.) and informal (memos, ad hoc conversations, etc.). Vertical (up and down the organization) and horizontal (with peers).
  • 43.
    Negotiation Involves conferring withothers in order to come to terms or reach an agreement. Agreements may be negotiated directly or with assistance; mediation and arbitration are two types of assisted negotiation. Negotiations occur around many issues, at many times, and at many levels of the project. During the course of a typical project, project staff are likely to negotiate for any or all of the following: • Scope, cost, and schedule objectives. • Changes to scope, cost, or schedule. • Contract terms and conditions. • Assignments. • Resources.
  • 44.
    Problem Solving Problem solvinginvolves a combination of problem definition and decision making. It is concerned with problems that have already occurred (as opposed to risk management that addresses potential problems). •requires distinguishing between causes and symptoms. Problems may be internal or external. Problems may be technical, managerial , or interpersonal . Problem definition •includes analyzing the problem to identify viable solutions, and then making a choice from among them. Decisions can be made or obtained . Once made, decisions must be implemented. Decisions also have a time element to them— the “right” decision may not be the “best” decision if it is made too early or too late. Decision making
  • 45.
    PMO A project managementoffice (PMO) is an organizational body or entity assigned various responsibilities related to the centralized and coordinated management of those projects under its domain. The responsibilities of a PMO can range from providing project management support functions to actually being responsible for the direct management of a project.
  • 46.
    PMO A primary functionof a PMO is to support project managers in a variety of ways which may include, but are not limited to: • Managing shared resources across all projects administered by the PMO • Identifying and developing project management methodology, best practices, and standards • Coaching, mentoring, training, and oversight • Monitoring compliance with project management standards, policies, procedures, and templates via project audits • Developing and managing project policies, procedures, templates, and other shared documentation (organizational process assets) • Coordinating communication across projects
  • 47.
    Project Management Environment •Why we do projects • Project life cycle The project • Role of the project manager • Project manager skills • PMO The project manager • Organization Chart • Organization Influence The performing organization
  • 48.
  • 49.
  • 50.
  • 51.
  • 52.
  • 55.
    Organization Influence Cultures andstyles may have a strong influence on a project’s ability to meet its objectives. Cultures and styles are typically known as “cultural norms. Shared visions, values, norms, beliefs, and expectations Policies, methods, and procedures View of authority relationships Work ethic and work hours.
  • 56.
    Project Management Environment •Whywe do projects •Project life cycle The project •Role of the project manager •Project manager skills •PMO The project manager •Organization Chart •Organization Influence The performing organization The stack holders
  • 57.
    Stake Holders • Thefirst step in your stakeholder analysis is to brainstorm who your stakeholders are. As part of this, think of all the people who are affected by your work, who have influence or power over it, or have an interest in its successful or unsuccessful conclusion. Identifying Your Stakeholders
  • 58.
    Your boss Shareholders Government Senior executives Alliancepartners Trades associations Your coworkers Suppliers The press Your team Lenders Interest groups Customers The public Prospective custo The community
  • 59.
    Stake Holders Prioritize Your Stakeholders You maynow have a long list of people and organizations that are affected by your work. Some of these may have the power either to block or advance it. Some may be interested in what you are doing, others may not care. Map out your stakeholders on a Power/Interest Grid , and classify them by their power over your work and by their interest in your work.
  • 60.
    Stake Holders Keep SatisfiedManage Closely Monitor Keep Informed Interest P o w e r
  • 61.
    High power, interested people these arethe people you must fully engage and make the greatest efforts to satisfy. High power, less interested people put enough work in with these people to keep them satisfied, but not so much that they become bored with your message. Low power, interested people keep these people adequately informed, and talk to them to ensure that no major issues are arising. These people can often be very helpful with the detail of your project. Low power, less interested people again, monitor these people, but do not bore them with excessive communication.
  • 62.
  • 63.
    Strategic Management Strategy Formulation DevelopVision and Mission Establish long Term Objectives Generate, Evaluate and select strategies Strategy Implementation Implement Strategies and management Issues Strategy Evaluation Measure and Evaluate Performance
  • 64.
  • 65.
    Compliance Typically those neededto meet regulatory conditions to operate in a region ( Must Do) Emergency Such as rebuilding a factory after burning
  • 66.
    Operational • Needed tosupport current operation • Improve efficiency • Reduce product cost • Increase performance
  • 67.
    Strategic • Directly supportsorganization long term mission • Increasing revenue • Increasing market share
  • 68.
    Ranking and prioritizingprojects Payback period. Net present value. Internal rate of return.
  • 69.
    Ranking and prioritizingprojects Payback Period •The no. of periods it will take the results of the project to recover the investment from net cash flow
  • 70.
    Payback Period Year 1Year 2 Year 3 Year 4 Year 5 Year 6 Income 0 1000 5000 7000 9000 9000 Expendutuer 5000 4000 3000 1000 1000 1000 Net -5000 -3000 2000 6000 8000 8000 Cunulative Net -5000 -8000 -6000 0 8000 16000
  • 71.
    Payback Period -5000 -3000 2000 6000 8000 8000 Year1, -5000 Year 2, -8000 Year 3, -6000 Year 4, 0 Year 5, 8000 Year 6, 16000 -10000 -5000 0 5000 10000 15000 20000 Year 1 Year 2 Year 3 Year 4 Year 5 Year 6 Net Cunulative Net Poly. (Cunulative Net)
  • 72.
    Net Present Value Findingthe present value of each cash flow NPV = Amount / (1+DR)^T
  • 73.
    • DR =Discount Rate • T = Time Period(s)
  • 74.
    Ranking and prioritizingprojects • This the discount rate that causes NPV to equal zero Internal rate of return • The potential return on an investment contemplated Return on investment
  • 75.
    Project A Time PeriodProject A (DR + 1) ^ T NPV 0 (1,000,000.00) - (1,000,000.00) 1 450,000.00 1.08 416,666.67 2 400,000.00 1.17 342,935.53 3 350,000.00 1.26 277,841.28 4 300,000.00 1.36 220,508.96 5 250,000.00 1.47 170,145.80 750,000.00 428,098.23
  • 76.
    Project A Time PeriodProject A (DR + 1) ^ T NPV IRR 0 (1,000,000.00) - (1,000,000.00) (1,000,000.00) 1 450,000.00 1.08 416,666.67 1.25 360,000.00 2 400,000.00 1.17 342,935.53 1.56 256,000.00 3 350,000.00 1.26 277,841.28 1.95 179,200.00 4 300,000.00 1.36 220,508.96 2.44 122,880.00 5 250,000.00 1.47 170,145.80 3.05 81,920.00 750,000.00 428,098.23 25% -
  • 77.
    Case Study Time PeriodProject A Project B 0 (1,000,000.00) (1,000,000.00) 1 450,000.00 250,000.00 2 400,000.00 300,000.00 3 350,000.00 350,000.00 4 300,000.00 400,000.00 5 250,000.00 450,000.00 In group kindly identify : Which project can be chosen based on financial returns ??
  • 78.
    Compare Year A B 0-250 -50 1 35 18 2 80 22 3 130 25 4 160 30 5 175 32
  • 79.
    Year A B -- 250 - 250 - 50 - 50 1 35 32 18 16 2 80 66 22 18 3 130 98 25 19 4 160 109 30 20 5 175 109 32 20 330 164 77 44 28% 37%
  • 80.
    Project Management KnowledgeAreas Scope Management Time Management Cost Management Risk Management Communication Management
  • 81.
    Project Scope Management ProjectScope Management includes the processes required to ensure that the project includes all the work required, and only the work required, to complete the project successfully. Managing the project scope is primarily concerned with defining and controlling what is and is not included in the project.
  • 82.
    Collect Requirements • Theprocess of defining and documenting stakeholders’ needs to meet the project objectives. Define Scope • The process of developing a detailed description of the project and product. Create WBS • The process of subdividing project deliverables and project work into smaller, more mangeable components. Define Activities • The process of identifying the specific actions to be performed to produce the project deliverables.
  • 83.
    Collect Requirements Focus groups Focus groupsbring together prequalified stakeholders and subject matter experts to learn about their expectations and attitudes about a proposed product, service, or result. A trained moderator guides the group through an interactive discussion, designed to be more conversational than a one on- one interview.
  • 84.
    Group Creativity Techniques Severalgroup activities can be organized to identify project and product requirements. Some of the group creativity techniques that can be used are: Brainstorming. A technique used to generate and collect multiple ideas related to project and product requirements. Nominal group technique. This technique enhances brainstorming with a voting process used to rank the most useful ideas for further brainstorming or for prioritization. Idea/mind mapping. Ideas created through individual brainstorming are consolidated into a single map to reflect commonality and differences in understanding, and generate new ideas.
  • 85.
    Mind Mapping SixThinking Hats
  • 86.
    Questionnaires and Surveys •Questionnairesand surveys are written sets of questions designed to quickly accumulate information from a wide number of respondents. •Questionnaires and/or surveys are most appropriate with broad audiences, when quick turnaround is needed, and where statistical analysis is appropriate. Prototypes •Prototyping is a method of obtaining early feedback on requirements by providing a working model of the expected product before actually building it. •Since prototypes are tangible, it allows stakeholders to experiment with a model of their final product rather than only discussing abstract representations of their requirements.
  • 87.
    Requirements Documentation Requirements documentation describeshow individual requirements meet the business need for the project. Requirements may start out at a high level and become progressively more detailed as more is known. Before being baselined, requirements must be unambiguous (measurable and testable), traceable, complete, consistent, and acceptable to key stakeholders. The format of a requirements document may range from a simple document listing all the requirements categorized by stakeholder and priority, to more elaborate forms containing executive summary, detailed descriptions, and attachments.
  • 88.
    • Business needor opportunity to be seized, describing the limitations of the current situation • why the project has been undertaken • Business and project objectives for traceability • Functional requirements, describing business processes, information, and interaction with the product • Quality requirements • Acceptance criteria • Business rules stating the guiding principles of the organization • Impacts to other organizational areas, such as the call center, sales force, technology groups Requirement Document
  • 89.
    Define Scope Is theprocess of developing a detailed description of the project and product. The preparation of a detailed project scope statement is critical to project success and builds upon the major deliverables, assumptions, and constraints that are documented during project initiation. During planning, the project scope is defined and described with greater specificity as more information about the project is known.
  • 90.
    Project Scope Statement Theproject scope statement describes, in detail, the project’s deliverables and the work required to create those deliverables. The project scope statement also provides a common understanding of the project scope among project stakeholders. It may contain explicit scope exclusions that can assist in managing stakeholder expectations. It enables the project team to perform more detailed planning, guides the project team’s work during execution, and provides the baseline for evaluating whether requests for changes or additional work are contained within or outside the project’s boundaries.
  • 91.
  • 92.
    Create W.B.S. Is theprocess of subdividing project deliverables and project work into smaller, more manageable components. The work breakdown structure (WBS) is a deliverable-oriented hierarchical decomposition of the work to be executed by the project team to accomplish the project objectives and create the required deliverables, with each descending level of the WBS representing an increasingly detailed definition of the project work. The WBS organizes and defines the total scope of the project, and represents the work specified in the current approved project scope statement.
  • 93.
    Decomposition subdivision of projectdeliverables into smaller, more manageable components until the work and deliverables are defined to the work package level. The work package level is the lowest level in the WBS, and is the point at which the cost and activity durations for the work can be reliably estimated and managed.
  • 97.
    Define Activities Define Activitiesis the process of identifying the specific actions to be performed to produce the project deliverables. The Create WBS process identifies the deliverables at the lowest level in the Work Breakdown Structure (WBS), the work package.
  • 98.
    Define Activities Project workpackages are typically decomposed into smaller components called activities that represent the work necessary to complete the work package. Activities provide a basis for estimating, scheduling, executing, and monitoring and controlling the project work.
  • 99.
    WBS Sample Touristic Villa Villas TypeA Sub Structure Excavation Foundations Backfilling Super Structure Ground Floor Columns Slabs First Floor Columns Slabs Finishes Type B Sub Structure Super Structure Finishes Chalets Services Boundary Walls
  • 100.
    WBS Sample • TouristicVilla 1. Villas 1. Type A 1. Sub Structure 1. Excavation 2. Foundations 3. Backfilling 2. Super Structure 1. Ground Floor 1. Columns 2. Slabs 2. First Floor 1. Columns 2. Slabs 3. Finishes 2. Type B 1. Sub Structure 2. Super Structure 3. Finishes 2. Chalets 3. Services 4. Boundary Walls
  • 101.
    Time Management Estimate ActivityResources The process of estimating the type and quantities of material, people, equipment, or supplies required to perform each activity. Estimate Activity Durations The process of approximating the number of work periods needed to complete individual activities with estimated resources. Sequence Activities The process of identifying and documenting relationships among the project activities. Develop Schedule The process of analyzing activity sequences, durations, resource requirements, and schedule constraints to create the project schedule.
  • 102.
    Estimate Activity Resources WorkPackaging • is the process of estimating the type and quantities of resources required to perform each activity. 4M • Manpower • Material • Machinery • Money
  • 103.
    Estimate Activity Resources WBSActivity Qty. Manpower Machinery Material Money 1.1.2.1.1 Columns 20 M3 4 C 2 M3 Shuttering 8 H 10 Kg Nails
  • 104.
    Estimate Activity Durations Estimate Activity Durationsis the process of approximating the number of work periods needed to complete individual activities with estimated resources. Estimating activity durations uses information on activity scope of work, required resource types, estimated resource quantities, and resource calendars.
  • 105.
    Estimation Tools Previous History. • Ifyour organization keeps track of actual effort hours and costs from previous projects, you may have information that will help you estimate similar new work. • In this method, the characteristics of the prior work, along with the actual effort hours and cost, are saved so that the information can be leveraged for future projects. Analogy. • Even if you do not keep actual effort hours from previous projects, you may still be able to leverage previous work. • Analogy means that you find similar projects, even if the project team did not collect actual effort hours worked. For example, let's say a prior project was estimated to take six months and 2000 hours to complete. If the project actually was completed in six months, there is a good likelihood that the project also took approximately 2000 hours of effort.
  • 106.
    Estimation Tools Ratio. •Ratio is similarto analogy except that you have some basis for comparing work that has similar characteristics, but on a larger or smaller scale. •For instance, you may find that the effort required to complete an office move for the Miami office was 500 hours and that one of the big drivers for the effort is the number of people at the office. •If there are twice as many people in the Chicago office, you may be able to conclude the work may take 1000 hours there. Expert Opinion. •In many cases you may need to go to an internal or external expert to get help estimating the work. •For instance, if this is the first time you have used a new technology, you may need the help of an outside research firm to provide estimating information. •Many times these estimates are based on what other companies in the industry are experiencing. •You may also have an internal expert who can help. Although this may be your first time estimating a certain piece of work, perhaps someone else has done it many times.
  • 107.
    Estimation Tools PERT • (Program Evaluationand Review Technique). PERT is an estimating technique that used a weighted average of three numbers to come up with a final estimate. • Using the PERT technique, if you are asked to estimate the effort required to complete an activity, you would start with three estimates - the most pessimistic (P) case when everything goes wrong, the most optimistic (O) case when everything goes right, and the most likely (M) case given normal problems and opportunities. The resulting PERT estimate is (O + 4M + P)/6. • For example, if the most likely estimate is 10 hours, the optimistic estimate is 6 hours and the pessimistic estimate is 26 hours. The PERT estimate is (6 + 4(10) + 26)/6. The answer is 72/6, or 12 hours. Notice that the number was pulled a little toward the pessimistic estimate, but not by much, since the result is still weighted heavily toward the most likely value.
  • 108.
    Estimation Tools Parametric Modeling. • Inthis technique, a pattern must exist in the work that allows you to use an algorithm to drive the overall estimate. • For instance, if you know that you can build one mile of flat one-lane highway for one million dollars, you should be able to easily calculate an estimate for ten miles of flat four-lane highway (40 million dollars).
  • 109.
    Sequence Activities Sequence Activitiesis the process of identifying and documenting relationships among the project activities. Activities are sequenced using logical relationships. Every activity and milestone except the first and last are connected to at least one predecessor and one successor. It may be necessary to use lead or lag time between activities to support a realistic and achievable project schedule.
  • 110.
    Dependencies Mandatory dependencies. Are thosethat are contractually required or inherent in the nature of the work. The project team determines which dependencies are mandatory during the process of sequencing the activities.
  • 111.
    Dependencies Discretionary dependencies. The projectteam determines which dependencies are discretionary during the process of sequencing the activities. Discretionary dependencies are sometimes referred to as preferred logic, preferential logic, or soft logic. Discretionary dependencies are established based on knowledge of best practices within a particular application area or some unusual aspect of the project where a specific sequence is desired, even though there may be other acceptable sequences
  • 112.
    Dependencies External dependencies. The projectmanagement team determines which dependencies are external during the process of sequencing the activities. External dependencies involve a relationship between project activities and non-project activities.
  • 113.
    Leads and Lags Alead Allows an acceleration of the successor activity. A lag Directs a delay in the successor activity.
  • 114.
  • 115.
  • 116.
  • 117.
  • 118.
    Schedule Development Develop Scheduleis theprocess of analyzing activity sequences, durations, resource requirements, and schedule constraints to create the project schedule. Entering the activities, durations, and resources into the scheduling tool generates a schedule with planned dates for completing project activities.
  • 119.
    Schedule Development Project Calendar • Whatare the working hours, days off of the project Resource Calendar • When each resource will be available to each activity Mile Stones • Any mile stones for any of the deliverables Forced Dates • Any forced date for activity, sub deliverable or deliverable Fixed Duration • Project given duration. For example allowing 1 year for the project to be finished
  • 120.
    CPM Calculates the theoreticalearly start and finish dates, and late start and finish dates, for all activities without regard for any resource limitations, by performing a forward and backward pass analysis through the schedule network. The resulting early and late start and finish dates are not necessarily the project schedule; rather, they indicate the time periods within which the activity could be scheduled, given activity durations, logical relationships, leads, lags, and other known constraints.
  • 121.
  • 122.
    Backward Scheduling Calculated Project End Date Subtract Duration Examine Relationship Activity'sLate Start & Finish Dates Critical Activities Critical Path Non Critical Activities Activity’s Float
  • 123.
    Resource Leveling Resource levelingis a schedule network analysis technique applied to a schedule that has already been analyzed by the critical path method. Resource leveling can be used when shared or critical required resources are only available at certain times, are only available in limited quantities, or to keep Resource usage at a constant level.
  • 124.
    Crashing • A schedulecompression technique in which cost and schedule tradeoffs are analyzed to determine how to obtain the greatest amount of compression for the least incremental cost. • Examples of crashing could include approving overtime, bringing in additional resources, or paying to expedite delivery to activities on the critical path. • Crashing only works for activities where additional resources will shorten the duration. Crashing does not always produce a viable alternative and may result in increased risk and/or cost.
  • 125.
    Fast tracking • A schedulecompression technique in which phases or activities normally performed in sequence are performed in parallel. • An example is constructing the foundation for a building before completing all of the architectural drawings. • Fast tracking may result in rework and increased risk. • Fast tracking only works if activities can be overlapped to shorten the duration.
  • 126.
    Cost Management Estimate Costs •The process of developing an approximation of the monetary resources needed to complete project activities. Determine Budget • The process of aggregating the estimated costs of individual activities or work packages to establish an authorized cost baseline.
  • 127.
    Cost Estimate Estimate Costs •isthe process of developing an approximation of the monetary resources needed to complete project activities.
  • 128.
    Analogous Estimating Analogous costestimating uses the values of parameters, such as scope, cost, budget, and duration or measures of scale such as size, weight, and complexity, from a previous, similar project as the basis for estimating the same parameter or measure for a current project. is generally less costly and time consuming than other techniques, but it is also generally less accurate.
  • 129.
    Parametric Estimating • Parametric estimatinguses a statistical relationship between historical data and other variables (e.g., square footage in construction) to calculate an estimate for activity parameters, such as cost, budget, and duration.
  • 130.
    Bottom-Up Estimating • Bottom-upestimating is a method o estimating a component of work. • The cost of individual work packages or activities is estimated with the greatest level of specified detail.
  • 131.
    Three-Point Estimates The accuracyof single-point activity cost estimates can be improved by considering estimation uncertainty and risk. This concept originated with the program evaluation and review technique (PERT). PERT uses three estimates to define an approximate range for an activity’s cost: Most likely (cM). The cost of the activity, based on realistic effort assessment for the required work and any predicted expenses. Optimistic (cO). The activity cost based on analysis of the best-case scenario for the activity. Pessimistic (cP). The activity cost based on analysis of the worst-case scenario for the activity.
  • 132.
    Determine Budget Determine Budgetis the process of aggregating the estimated costs of individual activities or work packages to establish an authorized cost baseline.
  • 133.
    • The costperformance baseline is an authorized time-phased budget at completion (BAC) used to measure, monitor, and control overall cost performance on the project. • It is developed as a summation of the approved budgets by time period and is typically displayed in the form of an S-curve Cost Performance Baseline
  • 134.
    Risk Management • ProjectRisk Management includes the processes of conducting risk management planning, identification, analysis, response planning, and monitoring and control on a project. The objectives of Project Risk Management are to increase the probability and impact of positive events, and decrease the probability and impact of negative events in the project.
  • 135.
    • The processof defining how to conduct risk management activities for a project. Plan Risk Management • The process of determining which risks may affect the project and documenting their characteristics. Identify Risks • The process of prioritizing risks for further analysis or action by assessing and combining their probability of occurrence and impact. Perform Qualitative Risk Analysis
  • 136.
    • The processof numerically analyzing the effect of identified risks on overall project objectives. Perform Quantitative Risk Analysis • The process of developing options and actions to enhance opportunities and to reduce threats to project objectives. Plan Risk Responses
  • 137.
    Plan Risk Management Plan Risk Managementis the process of defining how to conduct risk management activities for a project Planning is also important to provide sufficient resources and time for risk management activities, and to establish an agreed-upon basis for evaluating risks. The Plan Risk Management process should begin as a project is conceived and should be completed early during project planning.
  • 138.
    Risk Management Plan The riskmanagement plan describes how risk management will be structured and performed on the project.
  • 139.
    The risk management plan includes the following: Methodology.Defines the approaches, tools, and data sources that may be used to perform risk management on the project. Roles and responsibilities. Defines the lead, support, and risk management team members for each type of activity in the risk management plan, and clarifies their responsibilities.
  • 140.
    Budgeting. Assigns resources,estimates funds needed for risk management for inclusion in the cost performance baseline Timing. Defines when and how often the risk management process will be performed throughout the project life cycle Risk categories. Provides a structure that ensures a comprehensive process of systematically identifying risks to a consistent level of detail and contributes to the effectiveness and quality of the Identify Risks process.
  • 141.
    Definitions of risk probability and impact. The qualityand credibility of the Perform Qualitative Risk Analysis process requires that different levels of the risks’ probabilities and impacts be defined.
  • 143.
    Identify Risks Identify Risksis the process of determining which risks may affect the project and documenting their characteristics Participants in risk identification activities can include the following: project manager, project team members, risk management team (if assigned), customers, subject matter experts from outside the project team, end users, other project managers, stakeholders While these personnel are often key participants for risk identification, all project personnel should be encouraged to identify risks.
  • 145.
    Risk Identification Tools Information gathering Techniques Brainstorming. Thegoal of brainstorming is to obtain a comprehensive list of project risks. The project team usually perform brainstorming, often with a multidisciplinary set of experts who are not part of the team. Interviewing. Interviewing experienced project participants, stakeholders, and subject matter experts can identify risks. Root cause analysis is a specific technique to identify a problem, discover the underlying causes that lead to it, and develop preventive action.
  • 146.
    Risk Identification Tools Diagramming TechniquesCause and effect diagrams also known as Ishikawa or fishbone diagrams, and are useful for identifying causes of risks. System or process flow charts. These show how various elements of a system interrelate, and the mechanism of causation
  • 148.
  • 149.
    Risk Identification Tools SWOTAnalysis • This technique examines the project from each of the SWOT (strengths, weaknesses, opportunities, and threats) perspectives to increase the breadth of identified risks by including internally generated risks. • The technique starts with identification of strengths and weaknesses of the organization, focusing on either the project organization or the wider business. These factors are often identified using brainstorming. • SWOT analysis then identifies any opportunities for the project that arise from organizational strengths, and any threats arising from organizational weaknesses. • SWOT analysis also examines the degree to which organizational strengths offset threats and opportunities that may serve to overcome weaknesses.
  • 150.
    Risk Identification Outputs RiskRegister The primary outputs from Identify Risks are the initial entries into the risk register. List of identified risks. • The identified risks are described in as much detail as is reasonable. A simple structure for risks in the list may be applied List of potential responses. • Potential responses to a risk may sometimes be identified during the Identify Risks process. These responses, if identified in this process, may be useful as inputs to the Plan Risk Responses process
  • 151.
    Perform Qualitative RiskAnalysis Perform Qualitative Risk Analysis is the process of prioritizing risks for further analysis or action by assessing and combining their probability of occurrence and impact Organizations can improve the project’s performance by focusing on high-priority risks. Perform Qualitative Risk Analysis assesses the priority of identified risks using their relative probability or likelihood of occurrence, the corresponding impact on project objectives if the risks occur, as well as other factors such as the time frame for response and the organization’s risk tolerance associated with the project constraints of cost, schedule, scope, and quality.
  • 152.
    Perform Qualitative RiskAnalysis Tools Probability and Impact Matrix • Risks can be prioritized for further quantitative analysis and response based on their risk rating. • Usually, these risk-rating rules are specified by the organization in advance of the project and included in organizational process assets. Risk- rating rules can be tailored to the specific project in the Plan Risk Management process
  • 153.
    Perform Qualitative RiskAnalysis Tools Risk Data Quality Assessment A qualitative risk analysis requires accurate and unbiased data if it is to be credible. Analysis of the quality of risk data is a technique to evaluate the degree to which the data about risks are useful for risk management. It involves examining the degree to which the risk is understood and the accuracy, quality, reliability, and integrity of the data regarding the risk. If data quality is unacceptable, it may be necessary to gather higher-quality data.
  • 154.
    Perform Qualitative RiskAnalysis Tools Risk Categorization Risks to the project can be categorized by sources of risk (e.g., using the RBS), the area of the project affected (e.g., using the WBS), or other useful category (e.g., project phase) to determine areas of the project most exposed to the effects of uncertainty. Grouping risks by common root causes can lead to developing effective risk responses.
  • 155.
    Perform Quantitative RiskAnalysis Perform Quantitative Risk Analysis is the process of numerically analyzing the effect of identified risks on overall project objectives Perform Quantitative Risk Analysis is performed on risks that have been prioritized by the Perform Qualitative Risk Analysis process as potentially and substantially impacting the project’s competing demands
  • 156.
    Perform Quantitative RiskAnalysis Tools Quantitative Risk Analysis and Modeling Techniques Expected monetary value analysis. Expected monetary value (EMV) analysis is a statistical concept that calculates the average outcome when the future includes scenarios that may or may not happen
  • 158.
    Quiz You have todecide whether to approve an aggressive time schedule or a conservative one. The probability to achieve with an aggressive time schedule are 20 %, while with the conservative one is 70%. The return on the achievement are 100,000 $ for aggressive and 10,000 $ for a conservative. In all of the cases non achievement is subjected to 20,000 $ benalty Use EMV to clarify your decision.
  • 159.
    Perform Quantitative RiskAnalysis Output • With the risks facing the project, the probability of achieving project objectives under the current plan can be estimated using quantitative risk analysis results. Probability of achieving cost and time objectives. • This list of risks includes those that pose the greatest threat or present the greatest opportunity to the project. • These include the risks that may have the greatest effect on cost contingency and those that are most likely to influence the critical path. Prioritized list of quantified risks.
  • 160.
    Plan Risk Responses •is the process of developing options and actions to enhance opportunities and to reduce threats to project objectives
  • 161.
    Strategies for NegativeRisks or Threats Avoid Transfer Mitigate Accept
  • 162.
    Avoid. Risk avoidanceinvolves changing the project management plan to eliminate the threat entirely. The project manager may also isolate the project objectives from the risk’s impact or change the objective that is in jeopardy. Examples of this include extending the schedule, changing the strategy, or reducing scope. The most radical avoidance strategy is to shut down the project entirely.
  • 163.
    Transfer. Risk transferrequires shifting some or all of the negative impact of a threat, along with ownership of the response, to a third party. Transferring the risk simply gives another party responsibility for its management—it does not eliminate it. Transferring liability for risk is most effective in dealing with financial risk exposure. Transference tools insurance Performance bonds Warranties Guarantees Contracts may be used to transfer liability for specified risks to another party.
  • 164.
    Mitigate. Risk mitigationimplies a reduction in the probability and/or impact of an adverse risk event to be within acceptable threshold limits. Where it is not possible to reduce probability, a mitigation response might address the risk impact by targeting linkages that determine the severity.
  • 165.
    Accept. This strategyis adopted because it is seldom possible to eliminate all threats from a project. This strategy can be either passive or active. Passive acceptance requires no action except to document the strategy, leaving the project team to deal with the risks as they occur. The most common active acceptance strategy is to establish a contingency reserve, including amounts of time, money, or resources to handle the risks.
  • 166.
    Strategies for PositiveRisks or Opportunities Exploit Share Enhance Accept
  • 167.
    Exploit. This strategymay be selected for risks with positive impacts where the organization wishes to ensure that the opportunity is realized. Examples of directly exploiting responses include assigning an organization’s most talented resources to the project to reduce the time to completion or to provide lower cost than originally planned.
  • 168.
    Share. Sharing apositive risk involves allocating some or all of the ownership of the opportunity to a third party who is best able to capture the opportunity for the benefit of the project. Examples of sharing actions include forming risk- sharing partnerships, teams, special-purpose companies, or joint ventures, which can be established with the express purpose of taking advantage of the opportunity so that all parties gain from their actions.
  • 169.
    Enhance. This strategyis used to increase the probability and/or the positive impacts of an opportunity. Identifying and maximizing key drivers of these positive-impact risks may increase the probability of their occurrence.
  • 170.
    Accept. Accepting an opportunity isbeing willing to take advantage of it if it comes along, but not actively pursuing it
  • 171.
    Plan Risk ResponseOutputs • Identified risks • Risk owners and assigned responsibilities • Outputs from the Perform Qualitative Analysis process • Agreed-upon response strategies • Specific actions to implement the chosen response strategy • Triggers, symptoms, and warning signs of risks’ occurrence • Budget and schedule activities required to implement the chosen responses • Contingency plans and triggers that call for their execution • Residual risks that are expected to remain after planned responses have been taken, as well as those that have been deliberately accepted • Secondary risks that arise as a direct outcome of implementing a risk response • Contingency reserves that are calculated based on the quantitative risk analysis of the project and the organization’s risk thresholds.
  • 172.
    Communication Management Identify Stakeholders •Theprocess of identifying all people or organizations impacted by the project, and documenting relevant information regarding their interests, involvement, and impact on project success. Plan Communications •The process of determining the project stakeholder information needs and defining a communication approach. Manage Stakeholder Expectations •The process of communicating and working with stakeholders to meet their needs and addressing issues as they occur.
  • 173.
    Stake Holders • Thefirst step in your stakeholder analysis is to brainstorm who your stakeholders are. As part of this, think of all the people who are affected by your work, who have influence or power over it, or have an interest in its successful or unsuccessful conclusion. Identifying Your Stakeholders
  • 174.
    Stake Holders Keep SatisfiedManage Closely Monitor Keep Informed Interest P o w e r
  • 175.
    Plan Communications Plan Communicationsis the process of determining the project stakeholder information needs and defining a communication approach. who needs what information, when they will need it, how it will be given to them, and by whom. While all projects share the need to communicate project information, the informational needs and methods of distribution vary widely. Identifying the information needs of the stakeholders and determining a suitable means of meeting those needs are important factors for project success.
  • 176.
    Communication Methods Interactive communication. Between twoor more parties performing a multidirectional exchange of information. It is the most efficient way to ensure a common understanding by all participants on specified topics, and includes meetings, phone calls, video conferencing, etc. Push communication. Sent to specific recipients who need to know the information. This ensures that the information is distributed but does not certify that it actually reached or was understood by the intended audience. Push communication includes letters, memos, reports, emails, faxes, voice mails, press releases etc. Pull communication. Used for very large volumes of information, or for very large audiences, that requires the recipients to access the communication content at their own discretion. These methods include intranet sites, e-learning, and knowledge repositories, etc.
  • 177.
    Communication Management Plan Stakeholdercommunication requirements; Information to be communicated, including language, format, content, and level of detail; Reason for the distribution of that information; Time frame and frequency for the distribution of required information; Person responsible for communicating the information; Person responsible for authorizing release of confidential information; Person or groups who will receive the information; Methods or technologies used to convey the information, such as memos, e-mail, and/or press releases;
  • 178.
    Communication Management Plan Resourcesallocated for communication activities, including time and budget; Escalation process identifying time frames and the management chain (names) for escalation of issues that cannot be resolved at a lower staff level; Method for updating and refining the communications management plan as the project progresses and develops; Glossary of common terminology; Flow charts of the information flow in the project, workflows with possible sequence of authorization, list of reports, and meeting plans, etc. Communication constraints, usually derived from specific legislation or regulation, technology, and organizational policies, etc.
  • 179.
    Manage Stakeholder Expectations Isthe process of communicating and working with stakeholders to meet their needs and addressing issues as they occur. Actively Addressing concerns Clarifying and resolving •managing the expectations of stakeholders to increase the likelihood of project acceptance by negotiating and influencing their desires to achieve and maintain the project goals, •that have not become issues yet, usually related to the anticipation of future problems. •These concerns need to be uncovered and discussed, and the risks need to be assessed •issues that have been identified. The resolution may result in a change request or may be addressed outside of the project, for example, postponed for another project or phase or deferred to another organizational entity.
  • 180.
    Project Monitoring &Control Scope Control Time Control Cost Control
  • 181.
    Scope Control Is theprocess of formalizing acceptance of the completed project deliverables. Includes reviewing deliverables with the customer or sponsor to ensure that they are completed satisfactorily and obtaining formal acceptance of deliverables by the customer or sponsor. Scope verification differs from quality control in that scope verification is primarily concerned with acceptance of the deliverables, while quality control is primarily concerned with correctness of the deliverables and meeting the quality requirements specified for the deliverables. Verify Scope
  • 182.
    Control Scope Is theprocess of monitoring the status of the project and product scope and managing changes to the scope baseline. Controlling the project scope ensures all requested changes and recommended corrective or preventive actions are processed through the Perform Integrated Change Control process Project scope control is also used to manage the actual changes when they occur and is integrated with the other control processes.
  • 183.
    Control Schedule Is theprocess of monitoring the status of the project to update project progress and manage Changes to the schedule baseline. Determining the current status of the project schedule Influencing the factors that create schedule changes Determining that the project schedule has changed, Managing the actual changes as they occur.
  • 184.
    Earned value analysis. •in its various forms is the most commonly used method of performance measurement. It integrates scope, cost, and schedule measures to help the project management team assess project performance. Performance reporting
  • 185.
    • The budget,also called the budgeted cost of work scheduled (BCWS), is that portion of the approved cost estimate planned to be spent on the activity during a given period. • The actual cost, also called the actual cost of work performed (ACWP), is the total of direct and indirect costs incurred in accomplishing work on the activity during a given period. • The earned value, also called the budgeted cost of work performed (BCWP), is a percentage of the total budget equal to the percentage of the work actually completed. • The most commonly used measures are • the cost variance (CV = BCWP – ACWP), the schedule variance (SV = BCWP – BCWS). Earned value involves calculating three key values for each activity: Performance reporting
  • 186.
    Performance Assessment Earned Value PlannedValue Budgeted Cost of Work Scheduled (BCWS) Jan Feb Mar Apr May Jun Jul Aug Sep Oct Nov Dec PV 0 1.5 2.5 3 4 6 8 10 12 14 15 16 0 1.5 2.5 3 4 6 8 10 12 14 15 16 0 2 4 6 8 10 12 14 16 18 Axis Title PV
  • 187.
    Performance Assessment Earned Value EarnedValue (EV) Budgeted Cost of Work Performed (BCWP) Jan Feb Mar Apr May Jun Jul Aug Sep Oct Nov Dec PV 0 1.5 2.5 3 4 6 8 10 12 14 15 16 EV 0 1.5 2.5 2.6 3 4.5 6 7 0 1.5 2.5 3 4 6 8 10 12 14 15 16 0 1.5 2.5 2.6 3 4.5 6 7 0 2 4 6 8 10 12 14 16 18 Axis Title
  • 188.
    Performance Assessment Earned Value ActualCost (AC) Actual Cost of Work Performed (ACWP) Jan Feb Mar Apr May Jun Jul Aug Sep Oct Nov Dec PV 0 1.5 2.5 3 4 6 8 10 12 14 15 16 AC 0 1.5 2.5 2.6 3 4 5 5.5 0 1.5 2.5 3 4 6 8 10 12 14 15 16 0 1.5 2.5 2.6 3 4 5 5.5 0 2 4 6 8 10 12 14 16 18 Axis Title
  • 189.
    Performance Assessment Earned Value JanFeb Mar Apr May Jun Jul Aug Sep Oct Nov Dec PV 0 1.5 2.5 3 4 6 8 10 12 14 15 16 EV 0 1.5 2.5 2.6 3 4.5 6 7 AC 0 1.5 2.5 2.6 3 4 5 5.5 0 1.5 2.5 3 4 6 8 10 12 14 15 16 0 1.5 2.5 2.6 3 4.5 6 7 0 1.5 2.5 2.6 3 4 5 5.5 0 2 4 6 8 10 12 14 16 18 Axis Title
  • 190.
    Performance Assessment Earned Value •SV = EV – PV • SV = 7 -10 =-3 Schedule Variance SV • SPI = EV / PV • SPI = 7 / 10 = 0.7 Schedule Performance Indicator SPI • ETC = (BAC/SPI)/ (BAC/month) • ETC = (16 / o.7) / (16 /12 ) = 17.2 Estimated Time to Completion ETC
  • 191.
    Performance Assessment Earned Value Cost VarianceCV CV = EV – AC CV = 7 – 5.5 = 1.5 Cost Performance Index CPI CPI = EV / AC CPI = 7 / 5.5 = 1.27 Estimated Cost @ Completion ECC = BAC / CPI ECC = 16 / 1.27 = 12.6