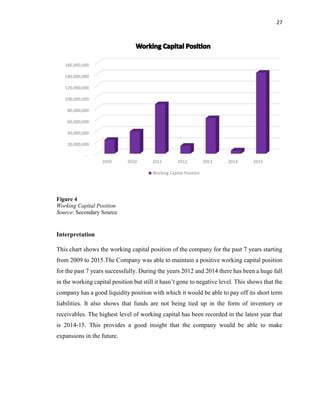
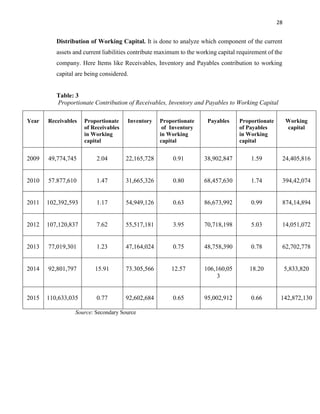
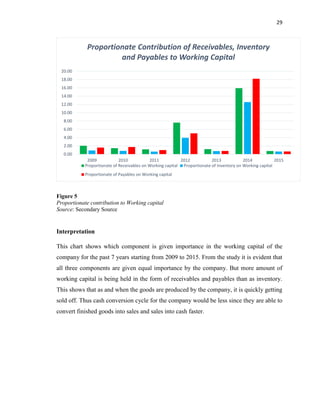
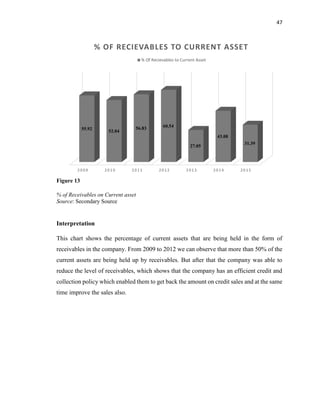
The document provides an overview of the biscuits and cookies industry in India. It discusses that the industry has an annual turnover of around Rs. 14500 crore and is one of the major contributors to India's GDP. It is dominated by a few large players like Britannia, Parle and ITC which have around 61% of the market share. While per capita consumption of biscuits is low in India compared to other countries, the industry is expected to grow at a 14% CAGR to Rs. 27900 crore by 2019 driven by rising incomes and preferences for more premium products.

![3
Literature Review.
Barot Haresh (2012), this paper observed a negative relationship between accounts
receivables and corporate profitability and a positive relationship between accounts
payable and profitability. Consequently, it appears that profitability dictates how
managers act in terms of managing accounts receivables. Thus, the findings of this
paper suggest that managers can create value for their shareholders by reducing the
number of days for accounts receivables. In addition, the negative relationship between
accounts receivables and firm’s profitability suggest that less profitable firms should
pursue a decrease of their accounts receivables in an attempt to reduce their cash gap
in the cash conversion cycle. On the basis of findings of this paper, we conclude that
profitability can be enhanced if firms manage their working capital in a more efficient
way.
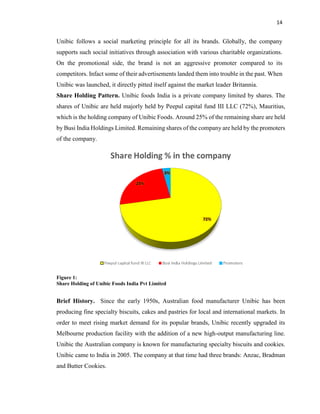
Cash conversion cycle and the time of receivable turnover as its part is considered as
closely linked to the performance of the small firms. Studies investigating this linkage,
regardless of national conditions or branch, have proved that firms with more efficient
cash conversion cycles reach higher firm performance and higher returns [Charitou et
al., 2010, Ebben & Johnson 2011]. The studies also confirmed a positive relation
between firm value and trade credit at low levels of receivable and a negative one at high
levels [Ebben & Johnson, 2011].
Ranchandran, A and Janakiraman, M, (2009), Analyzed the relationship between
working efficiency and earnings before interest and tax of the paper Industry in Indian.
The study revealed that cash conversion cycle and inventory days had negative
correlative with earnings before interest and tax, while accounts payable days and
accounts receivable days related positively with earnings before interest and tax.
Padachi.K (2006), examined the trends in working capital management and its impact
on firms performance. The results proved that a high investment in receivables
management would lead to lower profitability in a firm.](https://image.slidesharecdn.com/7c71226d-5db2-4be3-8f06-8a5f5d48be94-160512015100/85/Project-Company-Profile-Main-Copy-1-3-320.jpg)


![Haldiram[1]](https://cdn.slidesharecdn.com/ss_thumbnails/haldiram1-100930053700-phpapp01-thumbnail.jpg?width=640&height=640&fit=bounds)


