Download to read offline

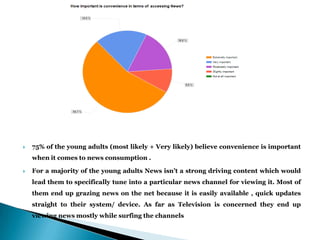
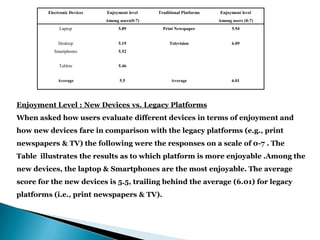


The document discusses the results of a study into the news consumption patterns of young Indian adults aged 18-30. It finds that while traditional media is losing popularity, digital media is bringing young people back to news through different distribution platforms. Traditional notions that young people don't care about news are wrong - the genres of news consumed vary and include entertainment, sports, international and business news. Young adults prefer accessing news online for convenience and on platforms like laptops and smartphones. While new devices are popular for news, television remains the most enjoyable platform. The study provides insights into optimizing news delivery to this demographic across different media.


