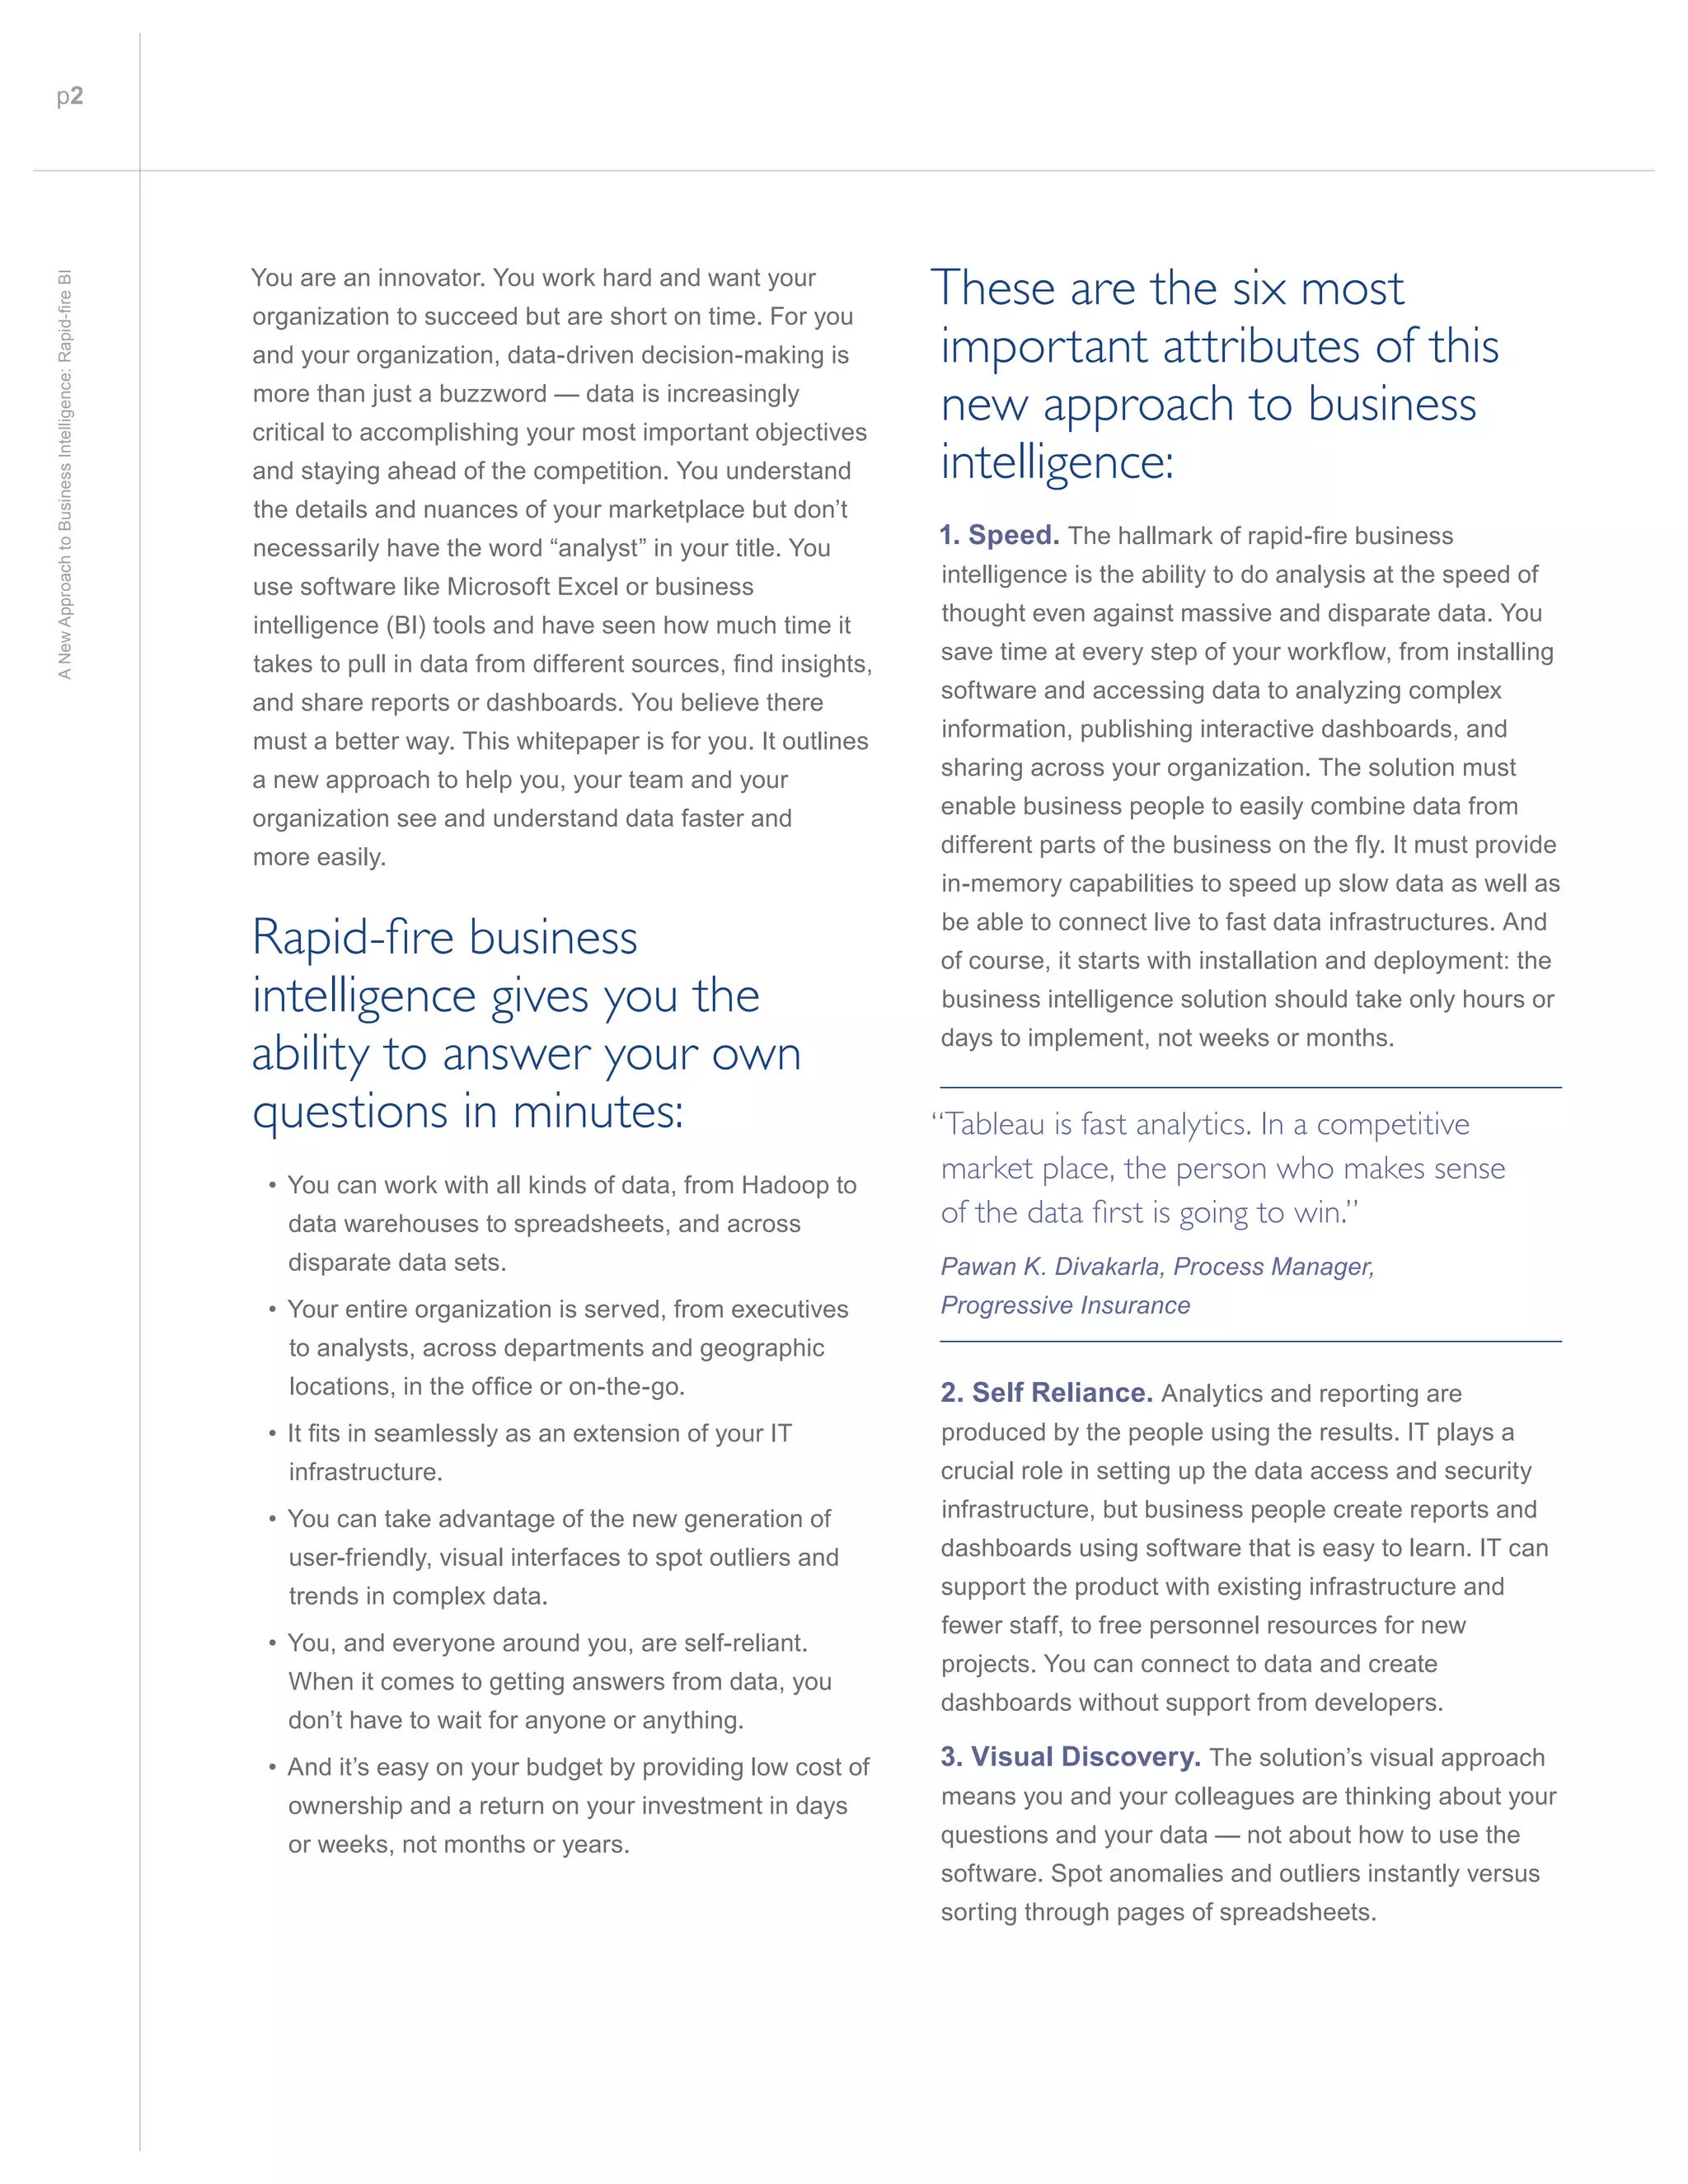
This document discusses a new approach to business intelligence called "rapid-fire BI" that aims to provide faster and more self-service analytics capabilities. The key attributes of rapid-fire BI outlined in the document are:
1) Speed - It allows users to access, analyze, publish, and share data and insights 10 to 100 times faster than traditional BI solutions.
2) Self-reliance - It enables business users rather than IT to independently access data, build reports and dashboards, and answer their own questions without waiting for developer support.
3) Visual discovery - It uses intuitive visual interfaces rather than complex queries, allowing users to easily explore data visually and gain insights through interaction with various chart types
The rising collection and analysis of data has shifted the way companies do business. Four key ingredients to develop a data strategy, how to leverage next-generation technologies, and three essential steps for rolling out implementation are included. The Data Ecosystem will show you how to develop and implement the strategies that will meet the needs of your business.
Reveal the Intelligence in your Data with Talend Data FabricJean-Michel Franco
Discover the Winter'20 release of Talend Data Fabric.
Find out about the newly released product, Talend Data Inventory, and the powerful new capabilities and AI that accelerate and modernize data engineering. Find out how to:
- Ensure trusted data at first sight with Data Inventory
- Increase efficiency and productivity with Pipeline Designer
- Automate more integration tasks with AI and APIs
[Infographic] Cloud Integration Drivers and Requirements in 2015SnapLogic
SnapLogic and TechValidate queried more than 100 U.S. companies with revenues greater than $500 million about the business and technical drivers and barriers for enterprise cloud application adoption in 2015 and beyond.
You can also learn how the SnapLogic Elastic Integration Platform can help by going to www.SnapLogic.com/iPaaS.
Regulation and Compliance in the Data Driven EnterpriseDenodo
Watch full webinar here: [https://buff.ly/2R9qSfq]
Data proliferation has become a major challenge for many customers as they deal with new regulations and more stringent compliance requirements. Hear how these challenges can be addressed with fine grained security, full data lineage and comprehensive auditability.
In this Denodo DataFest session we will cover how to:
Assure compliance with optimized data management
Data classification with security policy enforcement
Increase flexibility with extended protection capabilities
Modern Data Integration Expert Session Webinar ibi
William McKnight, President of McKnight Consulting Group and Information Builders’ Jake Freivald discuss the tools needed for a successful modern data integration.
The reliability of data, and your company’s reputation for protecting it, have become essential to doing business in the data age. Modern data governance works at the speed of business, the scale of data, and still has a human touch so you can say “yes” and deliver trusted data.
In these presentations
, Stewart Bond, Research Director of IDC’s Data Integration and Integrity Software Service, and Talend will highlight this modern approach to data governance.
Watch now to learn how to:
Put trust and data literacy at the core of your digital transformation
Tackle the growing complexity of data management
Identify the value and ROI levers that drive success
Leverage Data Intelligence Software from discovery to enablement
To view this On Demand Webinar, please fill out the form. A Flash-based player will then open. Controls for pause/play, rewind, and sound are available at the bottom of the player.
Big Data Roundtable. Why, how, where, which, and when to start doing Big DataRaul Goycoolea Seoane
Big Data Roundtable. Why, how, where, which, and when to start doing Big Data. Why Big Data is not just a new keyword, can be a competitive advantage if it's doing right and on time, and most important, before you competition.
Best Practices for Development Apps for Big Data. Exadata, Exalytics, Big Data Appliance. Hadoop, HDFS, Using R with Oracle Database and Hadoop. Fast Data for Gathering Information.
Big Data LDN 2018: THE THIRD REVOLUTION IN ANALYTICSMatt Stubbs
Date: 13th November 2018
Location: Keynote Theatre
Time: 13:50 - 14:20
Speaker: Rob Davis
Organisation: MicroStrategy
About: While great strides have been made in equipping the analyst with ever smarter tools for gleaning insight from data, techniques and platforms for allowing the workforce to benefit from these insights in a timely fashion have been lacking. The third revolution in analytics will enable this wider workforce, consisting of front line workers who are not traditional users of data, to rapidly monetise insights coming from the business analyst even while their day to day actions improve the intelligence of the enterprise.
In this session, you will learn what characteristics an analytics platform must possess in order to enable the third revolution as well as see examples of how to build the organisational and cultural changes that are also necessary. A case study and common pitfalls to be avoided will be presented. Key industry trends such as AI, embedded analytics, and widening data literacy will be discussed as enablers for the third revolution in analytics.
Join Rob Davis, Vice President of Product Management for MicroStrategy, as he presents the importance of bridging this last mile of analytics to the creation of a truly Intelligent Enterprise.
This webinar featuring Claudia Imhoff, President of Intelligent Solutions & Founder of the Boulder BI Brain Trust (BBBT), Matt Schumpert, Director of Product Management and Azita Martin, CMO at Datameer, will highlight the latest technology trends in extending BI with big data analytics and the top high impact use cases.
Attendees will hear about:
-- The extended architecture for today's modern analytics environment
-- The Internet of Things (IoT) and big data
-- The evolution of analytics – from descriptive to prescriptive
-- High impact use cases as a result of the changing analytics world
Watch here: https://bit.ly/2D1fqB6
Today’s evolving data landscape has spawned new business challenges that require innovative solutions. These challenges include:
- Strategic decision-making, which relies on multiple perspectives such as social and economic factors that require combining internal and external data.
- Accounting for the increased volume and structural complexity of today’s data, and increased frequency required in delivering data assets.
- Coping with data silos that house data that must be combined and provisioned to support decision-making.
- Exposing purpose-built analytics, such as supply chain, for consumption in order to expedite decision-making.
Attend this session to learn how Data as a Service, fueled by data virtualization, overcomes these common challenges from the three dimensions of:
- Provisioning information-rich external data assets,
- Connecting data silos, and
- Enabling pre-built and packaged analytics.
DataOps - Big Data and AI World London - March 2020 - Harvinder AtwalHarvinder Atwal
Title
DataOps, the secret weapon for delivering AI, data science, and business intelligence value at speed.
Synopsis
● According to recent research, just 7.3% of organisations say the state of their data and analytics is excellent, and only 22% of companies are currently seeing a significant return from data science expenditure.
● Poor returns on data & analytics investment are often the result of applying 20th-century thinking to 21st-century challenges and opportunities.
● Modern data science and analytics require secure, efficient processes to turn raw data from multiple sources and in numerous formats into useful inputs to a data product.
● Developing, orchestrating and iterating modern data pipelines is an extremely complex process requiring multiple technologies and skills.
● Other domains have to successfully overcome the challenge of delivering high-quality products at speed in complex environments. DataOps applies proven agile principles, lean thinking and DevOps practices to the development of data products.
● A DataOps approach aligns data producers, analytical data consumers, processes and technology with the rest of the organisation and its goals.
How can Insurers Accelerate Digital Transformation with Data Virtualization (...Denodo
Watch full webinar here: https://bit.ly/2Qpwqo9
Insurers’ globally are accelerating their digital journey, making rapid strides with their digitisation efforts, and adding key capabilities to adapt and innovate in the new normal. However, many insurance organisations find this transformation challenging as they rely on established systems that are often not only poorly integrated, but also highly resistant to modernisation without downtime. Hear how peers in your industry are leveraging data virtualization that facilitates digital transformation via a modern data integration / data delivery approach to gain greater agility, flexibility, and efficiency.
In this session, you will learn:
- Industry key trends and challenges driving the digital transformation mandate
- What is data virtualization, use cases, and how it can enable insurers to develop critical capabilities
- Lessons from success stories of insurers who already use data virtualization to differentiate themselves from the competition, have a single view of all their data and a way to establish security controls across the entire infrastructure
A Key to Real-time Insights in a Post-COVID World (ASEAN)Denodo
Watch full webinar here: https://bit.ly/2EpHGyd
Presented at Data Champions, Online Asia 2020
Businesses and individuals around the world are experiencing the impact of a global pandemic. With many workers and potential shoppers still sequestered, COVID-19 is proving to have a momentous impact on the global economy. Regardless of the current situation and post-pandemic era, real-time data becomes even more critical to healthcare practitioners, business owners, government officials, and the public at large where holistic and timely information are important to make quick decisions. It enables doctors to make quick decisions about where to focus the care, business owners to alter production schedules to meet the demand, government agencies to contain the epidemic, and the public to be informed about prevention.
In this on-demand session, you will learn about the capabilities of data virtualization as a modern data integration technique and how can organisations:
- Rapidly unify information from disparate data sources to make accurate decisions and analyse data in real-time
- Build a single engine for security that provides audit and control by geographies
- Accelerate delivery of insights from your advanced analytics project
Humans are sentient. We perceive. We feel. We listen. The problem is the more you put together, the more we lose these capabilities. We get slower. The idea is, how we create a company that acts like a single organism, where we identify opportunities, and that allows us to work in a faster and exponential world world where development happens in months rather than years. Don't let digital transformation become a war of competitive attrition. You may need to invest in your future to change the game.
Thấu hiểu và vượt qua sự trì hoãnTrần Onion
Ebook tiếng anh về thấu hiểu và cách vượt qua sự trì hoãn.
Nó giúp chúng ta làm mọi thứ ngay tức thì, thay vì nghĩ đến lợi ích của sự trì hoãn, nó sẽ giúp chúng ta nghĩ đến những tác hại của sự trì hoãn.
Đơn giản như việc dậy sớm hay không, nếu dậy sớm 1 tiếng, tôi có thể dậy sớm để làm được nhiều việc hơn, quét nhà, pha trà, tập thể duc tốt cho sức khoẻ, hơn là nằm một tiếng nữa, trong khi tôi đã ngủ đủ giấc.
Panelists: Yoshiyasu Yamakawa (Intel), JP Barraza (Systran), Konstantin Dranch (Memsource), David Koot (TAUS)
The focus of this session will be on predictions and risk management. What kind of things can you predict and how can you manage risks by by analyzing your translation data or monitoring your productivity and quality. Tracking translation data in different cycles of the translation process (translation, post-editing, review, proof-reading) offers tremendous value when it comes to predicting future trends or making informed choices. What type of data can be valuable and what kind of predictions can we make using this data? How can we make more efficient use of already available data? How can we use this type of data to improve machine translation, automatic QA, error-recognition, sampling or quality estimation? How can academia and industry work together towards a common goal?
Andew Marks Agile Business Analytics How A New Generation Bi Is Reducing ...Andrew Marks
One of the challenges many companies have in delivering an adoptable Business Intelligence solution is ensuring that the solution meets the “current” and “future” information needs of the stakeholders. Traditional waterfall implementation methods don’t work in the world of BI. The speed at which the business climate moves and changes these days warrants a rapid and agile deployment approach towards business intelligence solutions. This presentation discusses some of the key aspects of taking an agile deployment strategy towards your organizations BI solution.
This presentation takes a humorous tongue-in-cheek look at the limitations of the traditional approach to BI, and reveals why agile BI offers a viable alternative. The presentation outlines the benefits of agile BI and Business Case and Getting Started tips. It also provides a suggested roadmap for managing agile BI developments.
Marketing teams are starting to get more serious about project management, but wasteful practices still persist. As a marketer, your environment is very dynamic. Naturally, your project requests—and the ways you receive them—tend to also be very dynamic. Right from the start, this can get your projects off on the wrong foot. Ultimately, it hurts yoru productivity, makes your projects late, and wastes time and money.
For the sake of your team’s success—and with a little help from PM expert Hala Saleh—it’s time to get your project request intake process process in order…
Now companies are in the middle of a renovation that forces them to be analytics-driven to
continue being competitive. Data analysis provides a complete insight about their business. It
also gives noteworthy advantages over their competitors. Analytics-driven insights compel
businesses to take action on service innovation, enhance client experience, detect irregularities in
process and provide extra time for product or service marketing. To work on analytics driven
activities, companies require to gather, analyse and store information from all possible sources.
Companies should bring appropriate tools and workflows in practice to analyse data rapidly and
unceasingly. They should obtain insight from data analysis result and make changes in their
business process and practice on the basis of gained result. It would help to be more agile than
their previous process and function.
The Right Data Warehouse: Automation Now, Business Value ThereafterInside Analysis
The Briefing Room with Dr. Robin Bloor and WhereScape
Live Webcast on April 1, 2014
Watch the archive: https://bloorgroup.webex.com/bloorgroup/lsr.php?RCID=7b23b14b532bd7be60a70f6bd5209f03
In the Big Data shuffle, everyone is looking at Hadoop as “the answer” to collect interesting data from a new set of sources. While Hadoop has given organizations the power to gather more information assets than ever before, the question still looms: which data, regardless of source, structure, volume and all the rest, are significant for affecting business value – and how do we harness it? One effective approach is to bolster the data warehouse environment with a solution capable of integrating all the data sources, including Hadoop, and automating delivery of key information into the rights hands.
Register for this episode of The Briefing Room to hear veteran Analyst Robin Bloor as he explains how a rapidly changing information landscape impacts data management. He will be briefed by Mark Budzinski of WhereScape, who will tout his company’s data warehouse automation solutions. Budzinski will discuss how automation can be the cornerstone for closing the gap between those responsible for data management and the people driving business decisions.
Visit InsideAnlaysis.com for more information.
How to successfully implement Business Intelligence into your organisation.
A completely agnostic and independent view from a market leader in delivering technology transformation.
Details on how to build a strategy to successfully execute on and more importantly how to get the business to adopt Business Intelligence into their day to day role.
Essential tool kit for any organisation looking to invest in Business Intelligence.
The pioneers in the big data space have battle scars and have learnt many of the lessons in this report the hard way. But if you are a general manger & just embarking on the big data journey, you should now have what they call the 'second mover advantage’. My hope is that this report helps you better leverage your second mover advantage. The goal here is to shed some light on the people & process issues in building a central big data analytics function
When writing this new paper, my main objective was to provide a clear understanding of where the term "Big Data" comes from, why is that term so popular now, what does it really mean and what can be its implication for businesses. Because the full power of Big Data can be revealed only by Analytics, i provided a description of a widely recognized and used analytical techniques to help you figure out how used in conjunction with Big Data, analytics can boost Business Performance.
i expected that by the end of this paper :
- you will smile the next time you read or hear at the terms big data, hadoop, or analytics :)
- you will understand the technologies that are behind the scene when one talks about "Big Data"
- you will know how to "make sense" of Big Data using Analytics
- you will get a basic idea of data mining techniques used in Business in general and in Big Data in particular
- you will be able to get every news about Big Data
Turning Big Data Analytics To Knowledge PowerPoint Presentation SlidesSlideTeam
This complete deck covers various topics and highlights important concepts. It has PPT slides which cater to your business needs. This complete deck presentation emphasizes Turning Big Data Analytics To Knowledge PowerPoint Presentation Slides and has templates with professional background images and relevant content. This deck consists of total of twenty two slides. Our designers have created customizable templates, keeping your convenience in mind. You can edit the colour, text and font size with ease. Not just this, you can also add or delete the content if needed. Get access to this fully editable complete presentation by clicking the download button below. http://bit.ly/2HHUsqf
Data mashup means in the BI space and makes the business case from both the business-side and the IT-side for enabling this ultimate level of self-service – a unique capability of InetSoft's BI solutions. For more details visit: https://www.inetsoft.com/evaluate/whitepapers/
Sample portfolio of Brett Sheppard marketing in previous roles at Tableau, Splunk, DxContinuum / ServiceNow and Datadog including authored publications, narratives and product marketing, case studies, community and partner marketing, and analyst relations.
How Comcast Turns Big Data into Real Time Operational Insights: Winter Olympi...Brett Sheppard
2014 O'Reilly Strata conference presentation by Patrick Shumate and Brett Sheppard, about the Comcast technology stack delivering content from the 2014 Winter Olympics in Sochi. The session and slides are presented with approval from NBC and its parent company Comcast.
Checklist for early-stage startups to improve search engine optimization (SEO) for organic search, as part of a lead generation blog series by Brett Sheppard @zettaforce
The power to predict can give sales teams an “unfair advantage”. Predictive analytics can help your business-to-business (B2B) sales team leapfrog the competition and reduce the time from initial contact to sales closure. Tracking sales velocity is a good way to pinpoint where your sales and marketing execution fails to engage customers. Deals that drag on waste valuable sales resources and make it challenging for sales leadership to prepare accurate revenue forecasts. High-performing sales teams improve sales velocity and achieve competitive advantage using turn-key predictive analytics applications. Predictive models can be very powerful and profitable, even if they just give you a small edge in determining which option to choose or path to take. In this DxContinuum webinar with guest Forrester Research, learn best practices for how your organization can improve sales velocity with predictive analytics.
Show drafts
volume_up
Empowering the Data Analytics Ecosystem: A Laser Focus on Value
The data analytics ecosystem thrives when every component functions at its peak, unlocking the true potential of data. Here's a laser focus on key areas for an empowered ecosystem:
1. Democratize Access, Not Data:
Granular Access Controls: Provide users with self-service tools tailored to their specific needs, preventing data overload and misuse.
Data Catalogs: Implement robust data catalogs for easy discovery and understanding of available data sources.
2. Foster Collaboration with Clear Roles:
Data Mesh Architecture: Break down data silos by creating a distributed data ownership model with clear ownership and responsibilities.
Collaborative Workspaces: Utilize interactive platforms where data scientists, analysts, and domain experts can work seamlessly together.
3. Leverage Advanced Analytics Strategically:
AI-powered Automation: Automate repetitive tasks like data cleaning and feature engineering, freeing up data talent for higher-level analysis.
Right-Tool Selection: Strategically choose the most effective advanced analytics techniques (e.g., AI, ML) based on specific business problems.
4. Prioritize Data Quality with Automation:
Automated Data Validation: Implement automated data quality checks to identify and rectify errors at the source, minimizing downstream issues.
Data Lineage Tracking: Track the flow of data throughout the ecosystem, ensuring transparency and facilitating root cause analysis for errors.
5. Cultivate a Data-Driven Mindset:
Metrics-Driven Performance Management: Align KPIs and performance metrics with data-driven insights to ensure actionable decision making.
Data Storytelling Workshops: Equip stakeholders with the skills to translate complex data findings into compelling narratives that drive action.
Benefits of a Precise Ecosystem:
Sharpened Focus: Precise access and clear roles ensure everyone works with the most relevant data, maximizing efficiency.
Actionable Insights: Strategic analytics and automated quality checks lead to more reliable and actionable data insights.
Continuous Improvement: Data-driven performance management fosters a culture of learning and continuous improvement.
Sustainable Growth: Empowered by data, organizations can make informed decisions to drive sustainable growth and innovation.
By focusing on these precise actions, organizations can create an empowered data analytics ecosystem that delivers real value by driving data-driven decisions and maximizing the return on their data investment.
Chatty Kathy - UNC Bootcamp Final Project Presentation - Final Version - 5.23...John Andrews
SlideShare Description for "Chatty Kathy - UNC Bootcamp Final Project Presentation"
Title: Chatty Kathy: Enhancing Physical Activity Among Older Adults
Description:
Discover how Chatty Kathy, an innovative project developed at the UNC Bootcamp, aims to tackle the challenge of low physical activity among older adults. Our AI-driven solution uses peer interaction to boost and sustain exercise levels, significantly improving health outcomes. This presentation covers our problem statement, the rationale behind Chatty Kathy, synthetic data and persona creation, model performance metrics, a visual demonstration of the project, and potential future developments. Join us for an insightful Q&A session to explore the potential of this groundbreaking project.
Project Team: Jay Requarth, Jana Avery, John Andrews, Dr. Dick Davis II, Nee Buntoum, Nam Yeongjin & Mat Nicholas
Techniques to optimize the pagerank algorithm usually fall in two categories. One is to try reducing the work per iteration, and the other is to try reducing the number of iterations. These goals are often at odds with one another. Skipping computation on vertices which have already converged has the potential to save iteration time. Skipping in-identical vertices, with the same in-links, helps reduce duplicate computations and thus could help reduce iteration time. Road networks often have chains which can be short-circuited before pagerank computation to improve performance. Final ranks of chain nodes can be easily calculated. This could reduce both the iteration time, and the number of iterations. If a graph has no dangling nodes, pagerank of each strongly connected component can be computed in topological order. This could help reduce the iteration time, no. of iterations, and also enable multi-iteration concurrency in pagerank computation. The combination of all of the above methods is the STICD algorithm. [sticd] For dynamic graphs, unchanged components whose ranks are unaffected can be skipped altogether.
Data Centers - Striving Within A Narrow Range - Research Report - MCG - May 2...pchutichetpong
M Capital Group (“MCG”) expects to see demand and the changing evolution of supply, facilitated through institutional investment rotation out of offices and into work from home (“WFH”), while the ever-expanding need for data storage as global internet usage expands, with experts predicting 5.3 billion users by 2023. These market factors will be underpinned by technological changes, such as progressing cloud services and edge sites, allowing the industry to see strong expected annual growth of 13% over the next 4 years.
Whilst competitive headwinds remain, represented through the recent second bankruptcy filing of Sungard, which blames “COVID-19 and other macroeconomic trends including delayed customer spending decisions, insourcing and reductions in IT spending, energy inflation and reduction in demand for certain services”, the industry has seen key adjustments, where MCG believes that engineering cost management and technological innovation will be paramount to success.
MCG reports that the more favorable market conditions expected over the next few years, helped by the winding down of pandemic restrictions and a hybrid working environment will be driving market momentum forward. The continuous injection of capital by alternative investment firms, as well as the growing infrastructural investment from cloud service providers and social media companies, whose revenues are expected to grow over 3.6x larger by value in 2026, will likely help propel center provision and innovation. These factors paint a promising picture for the industry players that offset rising input costs and adapt to new technologies.
According to M Capital Group: “Specifically, the long-term cost-saving opportunities available from the rise of remote managing will likely aid value growth for the industry. Through margin optimization and further availability of capital for reinvestment, strong players will maintain their competitive foothold, while weaker players exit the market to balance supply and demand.”
Explore our comprehensive data analysis project presentation on predicting product ad campaign performance. Learn how data-driven insights can optimize your marketing strategies and enhance campaign effectiveness. Perfect for professionals and students looking to understand the power of data analysis in advertising. for more details visit: https://bostoninstituteofanalytics.org/data-science-and-artificial-intelligence/
1. A New Approach to
Business Intelligence:
Rapid-fire BI
By Brett Sheppard
Updated February 2013
2. p2
ANewApproachtoBusinessIntelligence:Rapid-fireBI
You are an innovator. You work hard and want your
organization to succeed but are short on time. For you
and your organization, data-driven decision-making is
more than just a buzzword — data is increasingly
critical to accomplishing your most important objectives
and staying ahead of the competition. You understand
the details and nuances of your marketplace but don’t
necessarily have the word “analyst” in your title. You
use software like Microsoft Excel or business
intelligence (BI) tools and have seen how much time it
ta es to pull in data ro di erent sources find insights
and share reports or dashboards. You believe there
must a better way. This whitepaper is for you. It outlines
a new approach to help you, your team and your
organization see and understand data faster and
more easily.
Rapid-fire business
intelligence gives you the
ability to answer your own
questions in minutes:
• You can work with all kinds of data, from Hadoop to
data warehouses to spreadsheets, and across
disparate data sets.
• Your entire organization is served, from executives
to analysts, across departments and geographic
locations in the o fice or on-the-go
It fits in sea lessl as an e tension o our I
infrastructure.
• You can take advantage of the new generation of
user-friendly, visual interfaces to spot outliers and
trends in complex data.
• You, and everyone around you, are self-reliant.
When it comes to getting answers from data, you
don’t have to wait for anyone or anything.
• And it’s easy on your budget by providing low cost of
ownership and a return on your investment in days
or weeks, not months or years.
These are the six most
important attributes of this
new approach to business
intelligence:
1. Speed. he hall ar o rapid-fire usiness
intelligence is the ability to do analysis at the speed of
thought even against massive and disparate data. You
sa e ti e at e er step o our wor ow ro installing
software and accessing data to analyzing complex
information, publishing interactive dashboards, and
sharing across your organization. The solution must
enable business people to easily combine data from
di erent parts o the usiness on the It ust pro ide
in-memory capabilities to speed up slow data as well as
be able to connect live to fast data infrastructures. And
of course, it starts with installation and deployment: the
business intelligence solution should take only hours or
days to implement, not weeks or months.
“Tableau is fast analytics. In a competitive
market place, the person who makes sense
of the data first is going to win.”
Pawan K. Divakarla, Process Manager,
Progressive Insurance
2. Self Reliance. Analytics and reporting are
produced by the people using the results. IT plays a
crucial role in setting up the data access and security
infrastructure, but business people create reports and
dashboards using software that is easy to learn. IT can
support the product with existing infrastructure and
fewer staff, to free personnel resources for new
projects. You can connect to data and create
dashboards without support from developers.
3. Visual Discovery. The solution’s visual approach
means you and your colleagues are thinking about your
questions and your data — not about how to use the
software. Spot anomalies and outliers instantly versus
sorting through pages of spreadsheets.
3. p3
ANewApproachtoBusinessIntelligence:Rapid-fireBI
4. Large and Diverse Data. There is nothing about
data today that is getting smaller: its absolute size is
growing, it lives in a greater variety of data stores, and
more people need to use it. The solution must enable
people to combine data easily from different systems
and from all parts of the business. It must work with
data of any size, from hundreds of terabytes to
petabytes and more. It must work with unstructured or
raw data. And of course, it must work with the
spreadsheets and te t files that e ist in e er usiness
5. Ubiquitous Collaboration. The solution must
enable colleagues and authorized partners to access
the data and communicate, with group- and role-based
data security. It must scale from departments to
business units and across the largest enterprises. You
should be able to click once to publish to the full set of
end-user devices, from desktops to laptops and tablets.
People using corporate dashboards must be able to log
in and get rich interactivity right in a browser.
6. Flexible Configurations. You can start small but
scale big. Whether today’s need is one business
anal st with one data source or field
representatives on tablets accessing many reports
while on the road, the software needs to support all
stages of an organization’s analytics evolution.
The six attributes of a
rapid-fire BI solution
1 Speed: Get results
10 to 100 times faster
The surgical service teams at Seattle Children’s
Hospital were impatient. They wanted to measure
patient wait ti es so patients enefit seeing a nurse
or doctor faster and the hospital improves operational
e ficienc he started using rapid-fire usiness
intelligence from Tableau. “We were able to set up a
fantastic visualization that showed some of the root
causes and contributing factors for patient waiting,”
explained Jason Jio, Administrative Director of Surgical
Services at Seattle Children’s Hospital.
Looking beyond the surgical service teams, Seattle
Children’s realized there was more to be gained. They
needed a business intelligence solution that was fast to
deploy for everyone to use. Ted Corbett, who served as
the hospital’s Director of Knowledge Management,
explained: “We needed a solution that could provide
better ways to share information, would be faster than
any other business intelligence solutions to deploy, and
one that would not only save analysts time but would be
something they loved using. We chose Tableau
because it met those needs and more.” With over 4,700
employees, Seattle Children’s has deployed Tableau’s
rapid-fire usiness intelligence solution across its entire
organization — hospital, research and foundation.
Seattle Children’s Hospital Reduces
Wait Times
To more quickly turn patient and hospital data into
insight, Seattle Children’s Hospital implemented Tableau
Software rapid-fire business intelligence. “We are
continuously looking for new ways to improve our
quality, safety, and processes from the time a patient is
admitted to the time they’re discharged,” said Drexel
DeFord, Senior Vice President and Chief Information
Officer at Seattle Children’s Hospital. “So we spend a lot
of time analyzing data associated with those visits.”
Tableau fundamentally changed what Seattle Children’s
could do with data by providing browser-based,
easy-to-use analytics to stakeholders throughout the
organization, making it intuitive for individuals to create
visualizations to understand what the data means.
“We’re seeing Data Analysts, Business Managers, and
Financial Analysts as well as Clinicians, Doctors, and
Researchers all using Tableau in different ways to solve
different problems in ways that we couldn’t do on our
own before, largely because we didn’t have enough time
or enough people,” explained Ted Corbett, who served
as the hospital’s Director of Knowledge Management.
“We have to continue to be able to treat as many kids as
possible,” explains DeFord. “By making those processes
more efficient, for all intents and purposes we created
more beds, even though we didn’t physically build
them.”
4. p4
ANewApproachtoBusinessIntelligence:Rapid-fireBI
You don’t have to be in a hospital to appreciate good
time management. Everyone wants to manage time
better. Business users and IT are impatient. With
rapid-fire BI ou re not stuc in a a or BI pro ect that
takes months — or in some cases even years — before
ou see the first real-li e product that usiness users
can actually use. And you no longer have to get stuck in
the quagmire of creating and sharing reports in Excel.
If you answer yes to any of the following
questions, your BI system is not moving as
fast as it could be:
• Does your business intelligence solution require
weeks or months to deploy or change?
• Does creating or modifying reports or dashboards
require requests to the IT department that result in a
queue or IT department backlog?
• Does your BI solution require days or weeks of
training before new users can build and publish their
first dash oard or report
• Is your BI solution reliant on elaborate scheduling or
workarounds for slow system performance?
• Does your BI solution force you to replicate data
even though you’ve invested heavily in an enterprise
data warehouse or fast database?
• Does your BI solution force you to do specialized
pre-integration work to access your data?
• Are you constrained in your ability to blend data
from multiple sources including raw or unstructured
data stored outside of relational databases?
Traditional business intelligence software is slow. It
takes months to purchase and many more months to
implement. Training users takes weeks and is
expensive. Developers interview businesspeople, then
go off and create reports. Changes take weeks of back
& forth to implement. To combine two data sources, IT
must build a new data repository to house them both.
Then the developers get involved again to build the
reports… the whole process feels like running in
deep mud.
ontrast that with rapid-fire usiness intelligence
Install by downloading trial software. Access any type
of data — from spreadsheets and relational databases
to cubes, Hadoop and more — with a click. You have
the choice to connect live to fast data stores, or import
extracts into a fast data engine. Drag and drop to spot
trends and outliers using intuitive visual interfaces that
are so easy to use you’ll almost forget you are using
so tware Add in new data on the lic once to
publish to any device, from PCs and laptops to iPads
and Android tablets. And share interactive dashboards
with your workgroup, project team or entire organization.
It’s all 10 to 100 times faster than any other business
intelligence solution.
Figure 1. Speed at Every Stage of the Data Workflow.
Compared to traditional business intelligence, rapid-fire analytics is 10 to 100 times faster at every step in the data
workflow, from installing software and accessing data to analyzing complex information, publishing interactive
dashboards, and sharing across your organization.
Install Access Analyze Publish Share
10 X 100 TIMES FASTER
5. p5
ANewApproachtoBusinessIntelligence:Rapid-fireBI
ith rapid-fire usiness intelligence e plorator
analytics and reporting that used to take hours may
take only minutes. For Blastrac Manufacturing CIO
Dan Murray: “Before, we were spending four to six
man-hours a week producing basic reports. Now it
takes us ten minutes. And the quality of the report is
much better, much more visible and interactive.”
2 Self Reliance
Self-reliant BI provides business users with a way to
answer questions about the business and adapt to
change. It requires few resources from IT to install or
maintain. IT sets up the data architecture, security,
and access controls. Business people serve
themselves reports and dashboards with data of any
size or format within the controls established by IT.
Traditional business intelligence has been a chore for
IT: from installation, deployment, and programming
to report writing, change requests, support, and
maintenance. This doesn’t even include the costly
professional services that are required.
Even more troublesome, when business units require
new functionality, traditional BI often “breaks.” This
causes organizations to upgrade late or not at all,
reducing the ability to adopt advances in technology.
And when you do upgrade, it’s a massive project
involving many resources and risks.
But the real problem is that the people who have to
make decisions, even everyday decisions, cannot
independently and directly ask the questions they
need answered when needed. They are typically
dependent on an undersized group of BI developers
who have their own schedules to keep.
So, what are the elements to look for
with respect to self-reliant BI? Look for
a system that:
• Allows anyone to easily build dashboards and
reports from disparate data sources and make
odifications on-the-
powers in or ed s eptics who find actiona le
insights from the combination of their business
experience and analytics.
• Provides built-in best practices to support effective
analysis and save time.
• pens des top data such as te t files and
Microsoft Excel, without having to reformat
that data.
• Connects to all major databases with a few clicks.
• Enables easy sharing through web and mobile
dashboards, SharePoint, or visuals exported to
PowerPoint or email.
• Provides interactive functionality on the web such
as drill-down and filtering
• Provides role- and group-based security for
secure publishing.
• Allows users to connect to the existing
data architecture.
• Enforces the security and controls set up by IT.
Cornell University Delivers Ten Times
the Analyses in Half the Time
Cornell University struggled to enable its users with
capabilities to produce and manage their own
dashboards for tracking of key performance indicators
(KPIs). A project using a traditional BI platform ran for
nine months with no results and no adoption. Cornell’s
data IT administration team brought in Tableau and
immediately users were accessing and using the
dashboards, and creating their own dashboards in
collaboration with the IT team. When the Cornell team
began using Tableau, they estimated a 50- to
75-percent reduction in report development time, and
now several years later, it is clear that the savings are in
the 75- to 90-percent range.
Said Cindy Sedlacek, director of data administration and
reporting for the College of Arts and Sciences at Cornell
University: “The savings have been so significant that it
has allowed the team to focus on deploying data and
metrics in additional functional areas much sooner than
anticipated. Switching to Tableau enabled the KPI team
to reduce its FTEs (full-time equivalents) from 5.5 to 2.5
and to deliver
10 times as many analyses in half the time.”
6. p6
ANewApproachtoBusinessIntelligence:Rapid-fireBI
3 Visual Discovery
According to orrester Research: nterprises find
advanced data visualization platforms to be essential
tools that ena le the to onitor usiness find
patterns, and take action to avoid threats and snatch
opportunities.”1
A story unfolds as you navigate from
one visual summary into another.
“A well-crafted, thoughtful visualization makes
the light bulb go off. You just don’t get that
with a spreadsheet.”
Dana Zuber, Vice President of Strategic Planning,
Wells Fargo
Traditional BI platforms are complex and hard to use.
Users need tip sheets just to do basic tasks. What
1
The Forrester Wave™: Advanced Data Visualization
Platforms, Q3 2012, July 17, 2012.
looks simple in a demo turns out to be a nightmare
when you actually install and use the software.
ith rapid-fire usiness intelligence the so tware is
simple, visual and easy to learn. You answer questions
and discover new insights using drag-and-drop visual
interfaces. They are so easy to use that anyone can
conduct a broad range of inquiries. And you can shift
your perspective with a click, rather than having to
rebuild a report from the ground up.
These are the important elements to look for
with respect to visual discovery:
Interactive data visualization
The analysis process is visual from the beginning,
rather than the legac process o write ueries get
data write report use chart wi ard electing and
interacting with graphical representations of data
results in computations on the data itself.
Scatterplot
(showing outliers)
Map
(geograpic patterns)
Line Graph
(trend detection)
Tree Map
(relative proportions)
About Tableau maps: www.tableausoftware.com/mapdata
Figure 2. Shift Your Perspective to Get Better Insight into Your Data.
A traditional analysis tool requires you to analyze data in rows and columns, choose a subset of your data to present,
organize that data into a table, and then create a chart from that table. Rapid-fire business intelligence skips those
steps and creates a visual representation of your data right away, giving you visual feedback as you analyze. You
don’t have to wander through pages of graphical user interfaces (GUIs) before you see your first result. You can easily
iterate across multiple kinds of visuals to view your data from different perspectives and obtain new insights.
click
1
click
1
click
1
7. p7
ANewApproachtoBusinessIntelligence:Rapid-fireBI
Easy-to-use visual user interfaces
Does the software have an easy-to-understand user
inter ace defined in usiness ter s and not argon o
users regard the software as easy-to-use and intuitive?
New users are often the best judge of effective user
interfaces. Can anyone answer a broad range of
inquiries with simple drag and drop?
Geographic intelligence
Geographic analysis is critical. Is mapping easy to use
and co plete re uiring no specialt ap files plug-ins
fees or third party tools?
Drill down and drill through
Can you drill through to the underlying detail in just a
few clicks? Is drill-down / drill-through an automatic
occurrence requiring no special scripting or advance
set-up? Users should be able to select data graphically
and drill to the detailed underlying data at all times.
Built-in best practices
Does the software support good information
visualization by design? Does it provide meaningful
color schemes and view types that promote
understanding of data?
Figure 3. Intuitive BI Software.
Fast, easy-to-use visual interfaces mean you are
thinking about your questions and your data — not
about how to use the software.
4 Large and Diverse Data
Traditional business intelligence made the assumption
that all important data can be moved into a
consolidated enterprise architecture. But that’s not the
reality for most organizations, which have different
databases in different places, which are short on time
and staff, and whose needs change constantly.
Here are some questions to consider about
your existing BI platform:
• Does your BI platform require you to choose
between a live database connection or import into
an in-database analytics engine, instead of allowing
you to combine these approaches based on
performance and project requirements?
• Does IT have to combine disparate data into a single
location before business users can begin
analyzing it?
• Do users regularly cut and paste data from
expensive data warehouses into spreadsheets so
they can use all the data they need to understand
the business?
• Do you get limited value from large data because
your people don’t have tools that can analyze it?
• It is di ficult or slow or our BI plat or to connect to
newer database technologies like Hadoop?
If you answered yes to one or more of these questions,
ou a want to consider a aster and ore e i le
alternative.
Rapid fire usiness intelligence lets ou lend di erent
relational, semi-structured and raw data sources in real
time, without expensive up-front integration costs. That
means that users don’t need to know the details of how
data is stored to ask and answer questions. Whether
your data is in a spreadsheet, a database, a data
warehouse open source file s ste s li e adoop or
all of those, users can quickly connect to the data they
need and consolidate it.
8. p8
ANewApproachtoBusinessIntelligence:Rapid-fireBI
Consider these performance factors when
evaluating the ability to manage and benefit
from large diverse data:
Allows users to blend data sources
Does the software natively enable users to look at
multiple data sources at the same time? Can users look
at sales data in the conte t o financial data or lend
order data with production data to anticipate
supply problems?
Allows users to augment data
Does the software let users bring in data from outside
the co pan on-the- li e de ographics and ar et
research, to augment their corporate data?
Provides fast analytics, whether in-memory or
via live connection
Does the software provide fast query performance,
either via its own fast in-memory software or by directly
connecting to fast data stores?
Reduces demands on IT
Does the software let users work with the existing data
infrastructure so that IT is freed from creating ever-more
cubes and “universes” and standalone marts? Does it
support data security by allowing users to work with data
where it’s supposed to be, rather than copying it into
unmanaged and unsecure spreadsheets?
Scales to big data on commodity hardware
Does the software connect to the myriad of new
database formats for raw, unstructured and semi-
structured big data?
Is architecture agnostic
Does your BI software work well with both centralized
and decentralized data architectures? Regardless of
whether your organization follows the centralized
corporate information factory approach associated with
Bill Inmon, the bottom-up dimensional modeling
approach associated with Ralph Kimball, or a hybrid
between the two, does your BI software integrate
seamlessly for all data types?
Hadoop
Tableau
Databases Files
Figure 4. Blend Large and Diverse Data from
Multiple Sources.
With rapid-fire business intelligence, combine data from
an unlimited number of sources and formats with the
choice between live database connection and extracts
imported into the data engine.
Rapid-fire usiness intelligence supports true ad-hoc
query of large, complex data sets. This means that you
and your colleagues don’t have to determine in
advance which measures to aggregate or query.
5 Ubiquitous Collaboration
You and your colleagues are investigating new trends in
your business. But your reports don’t answer your
questions, and you leave your meeting with more
questions than you went in with. So you go create more
reports, then call another meeting. Which generates
more questions and more reports. Why not interact with
data li e during a eeting ith rapid-fire usiness
intelligence ou can filter sort and discuss data on the
As and answer uestions in the o ent ed a
live dashboard in your SharePoint site or in Salesforce.
Save your view of data and allow colleagues to
subscribe to your interactive dashboards so they see
the very latest data just by refreshing their web browser.
That’s real collaboration.
Large organizations spread across multiple lines of
business and geographies seek to move past data silos
and i pro e colla oration a out data se rapid-fire
9. p9
ANewApproachtoBusinessIntelligence:Rapid-fireBI
business intelligence to create and share powerful,
interacti e dash oards and reports efine access
security by role, group or individual or publish
externally on the public Internet. And do all this in
minutes or hours, not months.
“Tableau’s capabilities and ease of use enable
eBay’s teams to take a collaborative approach
to exploring data — and to making results
available seamlessly across the business.”
Kiril Evtimov, Director, Analytics Platform, eBay
Natively mobile
You make decisions in meetings, at customer sites and
on the go. Your business intelligence should be
natively mobile to support analytics anywhere and
everywhere for all of your stakeholders.
Figure 5. Publish Once for Web, iPad and
Android Tablets.
Rapid-fire business intelligence dashboards are
optimized to deliver touch experiences when accessed
on the Apple iPad and Android tablets. This touch
awareness happens automatically — no special
authoring or design changes are required.
Combination of flexibility and compliance
As noted by the Gartner 2012 Magic Quadrant for BI
Platforms: “… business users demand easy to use,
e i le products that put anal tic power into their own
hands, against IT’s desire to maintain standards and
create a supportable BI environment with predictable
performance and quality data.”2
It’s not a question of
choosing etween e i ilit or co pliance ou need
both. You need to centralize data sources and apply
metadata, yet still be able to extend it by adding your
own calculations, hierarchies, and aliases.
rgani ations that aster rapid-fire usiness
intelligence let IT set up the data architecture, security,
and access controls, while giving business people the
ability to serve themselves reports and dashboards.
Shared and extensible metadata
Rapid-fire usiness intelligence pro ides our
organization with a centralized data source and
metadata layer — yet still enables you and your
colleagues to add your own calculations; create new
groups, sets, and parameters; organize data into
hierarchies; and modify aliases. It’s metadata that just
works: there’s no initial setup and it adapts with
your data.
Centralized data
The data server provides a centralized location to
manage all of your organization’s published data
sources. You can delete, change permissions, add
tags, and manage schedules in one convenient
location. It’s easy to schedule extract refreshes and
manage them in the data server. Administrators can
centrall define a schedule or e tracts on the ser er
for both incremental and full refreshes to save time
and effort.
6 Flexible Configurations
Organizations need to deploy business intelligence
based on today’s needs without cramping future
growth. Now more than ever, the economy mandates
that organizations spend wisely on software licenses
as they’re needed. But because traditional BI is so
complicated to install and maintain, no traditional BI
vendor can afford to offer customers small user
bundles. Worse, modules for more functionality often
mean additional license fees. But organizations
2
Gartner, Magic Quadrant for Business Intelligence
Platforms, 6 February 2012, John Hagerty, Rita L. Sallam,
James Richardson, Gartner Research Note G00225500
10. p10
ANewApproachtoBusinessIntelligence:Rapid-fireBI
typically want to pilot analytics projects with a handful
of users and scale up over time.
Traditional BI forced too much, too soon. It required
organi ations to u large ini u -configuration
licenses to meet potential needs — not actual needs.
Much of the software went unused.
Meanwhile, a new crop of boutique Software-as-a-
Service (SaaS) BI vendors enable static dashboards
for departmental needs, but struggle to offer the
e i ilit scala ilit and deep anal tics re uired
multiple departments and lines of business.
How do you evaluate
whether a BI system can
scale and adapt gracefully?
Proven scalability
Does the software support large enterprises and the
world’s biggest government agencies? Does it scale
to tens of thousands of users and work gracefully
across departments? Is its scalability proven in
existing deployments?
Access unlimited number of data sources
Does the software allow you to connect to virtually
any data source — including spreadsheets,
databases, cubes, Hadoop and more — as part of the
standard license? Can you connect to an unlimited
number of data sources?
Full version trial software available for free
Can all versions of the software be trialed at no cost
and put to use against production databases? Be wary
of software that can’t be installed and used on a trial
basis — trying software is often how departments and
lines of business make a determination of their
real needs.
Mix-and-match deployment configurations
In order to realize all of the product features, does the
vendor force you into a single deployment model —
desktop, on-premise server, hosted, or cloud — or
does the vendor enable you to mix-and-match among
multiple deployment options without loss of
functionality? Can you easily transfer workloads
among deployment options as your needs change,
while maintaining security and regulatory compliance?
Easy licensing
Does the vendor provide software the way you want to
buy it: a single license for a single desktop; multiple
licenses for a group; and browser-based deployments
for hundreds or thousands? Can you scale affordably
as your organization’s needs demand?
One Analyst One Department Enterprise
Figure 6. Effective Deployments of Any Size.
Rapid-fire business intelligence supports virtually any
configuration, from one employee to thousands, all
while accessing data of any format, topic, or degree
of complexity within appropriate controls for security
and compliance.
Introduction to
Tableau Software
Co-founding Pixar Animation Studios with George
Lucas and earning two Academy Awards for
animation science would be career highlights for most
of us, but for Stanford computer science professor Pat
Hanrahan, he was just getting warmed up.
Incorporating patented research on visualization
technology, and analytic best practices funded by the
U.S. Department of Defense, Pat and his two co-
founders — CEO Christian Chabot and Chief
e elop ent ficer r hris tolte spun a leau
Software out of Stanford University in 2003.
With Tableau Desktop, you can select and query data
sources, drag and drop to create interactive visuals,
and publish interactive dashboards on your Intranet or
11. p11
ANewApproachtoBusinessIntelligence:Rapid-fireBI
on the public Internet in literally minutes. Tableau
Server provides mobile and browser-based analytics
anyone can learn and use. As soon as you publish to
Tableau Server, your dashboard and reports are
automatically touch-enabled for iPads and
Android tablets.
Create Publish
Tableau Desktop Tableau Server
PC Browser Android
iPad
Access & Edit
Desktop
Figure 7. One-Click Publishing.
With Tableau, save time by publishing once to multiple
formats including desktops, iPads, and Android tablets.
Speed
Tableau works with your natural ability to process data
visually, giving you a huge advantage: speed. Tableau’s
data engine is blazing fast for massive data so you can
shift easily between views to discover meaningful
trends and outliers. Compared to traditional business
intelligence a leau rapid-fire anal tics is to
ti es aster at e er step in the data wor ow hether
you’re installing software and accessing data, analyzing
complex information, publishing interactive dashboards
or sharing across your organization, you’re driving to
fast results that matter.
For US Auto Parts Inc. Vice President of Business
Analytics Sarah Gustafson: “Tableau has saved hours
and hours of time pulling and manipulating data so we
can focus more time on the activities that really matter
— analyzing the data and serving up discoveries and
recommendations to move the business forward.”
Self-reliance
a leau is ast eas to use and e i le allowing
colleagues to work independently without the help of
report writers or database administrators. Users can
achieve self-reliance quickly: most of the basic features
in Tableau can be learned in an hour or so, leaving
more advanced features to be learned over time.
Tableau provides free live and on-demand training
— see for yourself at tableausoftware.com/learn/training.
Tableau has all of its training and support documents
available for free online. For users who learn best in
Figure 8. Gartner: BI Platform
Ease of Use Versus Composite
Product Rating, August 2012.3
Tableau delivers an exceptional
combination of advanced
analytics functionality and
ease-of-use. Gartner surveys
customers of business intelligence
platforms and ranks them across
a variety of metrics. This survey
comprises over 1,300 enterprises
and public-sector organizations
spread around the world. Along
the x-axis, can your product do
what you want it to do? And along
the y-axis, is that product easy
to use?
3
Gartner, Survey Analysis: Customers Rate Their BI Platform
Vendors, 2012, 14 August 2012, John Hagerty, Gartner
Research Note G00227584.
12. p12
ANewApproachtoBusinessIntelligence:Rapid-fireBI
a classroom environment, Tableau offers onsite and
virtual courses so that every employee in your
organi ation can eel confident and co orta le
in using Tableau.
“Tableau’s simple and intuitive interface enables
Kaleida Health to make sense of the more
than one million patient encounters we have
per year while identifying outliers, trends, and
opportunities that had previously remained
hidden in the data, allowing us to drive positive
changes in health care to the community we
serve. We’re now able to discover trends and
patterns in our data that were impossible using
other tools.”
Dan Gerena, Director, BI and Analytics, Kaleida Health
Visual discovery
As Forrester Research wrote in its June 2012 review of
self-service BI platforms: “Tableau Software continues
to set the standards for self-service advanced data
visualization. Self-service and intuitive data
visualizations go hand in hand, and Tableau has been
the vanguard of advanced data visualization for years.”4
Tableau lets you and your colleagues explore data and
ask questions that lead to business answers and
insights. Tableau’s “Show Me” feature enables you to
select the fields ou want to anal e and ha e a leau
draw the best view based on visualization best
practices. This helps you get up and running very
quickly. And you are free to experiment: try a new
visual, and if the view doesn’t help you better
understand the data, click the back button. You see
visualization and dashboard changes instantaneously,
without having to wade through page after page of
graphical-user interface (GUI) wizards before you even
get our first loo at the isual or dash oard
4
The Forrester Wave: Self-Service Business Intelligence
Platforms, Q2 2012, by Boris Evelson, published
June 12, 2012.
Large and diverse data
With Tableau, when people access data, they simply
point to a data source, identify the tables to use and
their relationships, and click “OK,” within appropriate
controls for security and regulatory compliance.
Tableau provides an optimized, live connector to more
than 30 data sources so you can work directly with
your data. But if your database is already under heavy
load, you can take the burden of analysis off of it with
Tableau. Tableau’s fast Data Engine lets you bring your
data into memory, meaning you can get the data you
need and answer your questions without overloading
your database. And with every workbook and
dashboard, you can mix-and-match to blend data
from multiple sources with whichever combination
you choose of direct live connections and extracts
in memory.
Figure 9. Analyze Big Data.
Visualize the largest and most complex data sets
with built in connectors to 30+ database formats,
in-database analytics for super-fast query speeds,
and direct live connections so your data is always
up-to-date.
eBay’s data architecture comprises Teradata, Hadoop,
and Tableau. eBay employees can visualize insights
from more than 52 petabytes of data. “eBay uses
Tableau to visualize search relevance and quality of the
eBay.com site; monitor the latest customer feedback
13. p13
ANewApproachtoBusinessIntelligence:Rapid-fireBI
and meter sentiments on eBay.com; and achieve
operational reporting for the data warehouse systems.
his has helped an anal tic culture ourish
within eBay.”5
“Tableau’s solution for Hadoop is elegant and
performs very well. This obviates the need
for us to move huge log data into a relational
store before analyzing it. This makes the
whole process seamless and efficient.”
Ravi Bandaru, Product Manager, Advanced Analytics
and Data Visualization, Nokia
Ubiquitous collaboration
Share and collaborate across your organization. Use
Tableau Server to share powerful, interactive
dashboards and reports on your internal portal,
SharePoint or public website. Store data extracts in
the uilt-in ata er er appl etadata and define
security with role and group access. And do all this in
minutes or hours, not months.
For Convio Vice President Mike Rogers: “We sought a
web-based solution that could provide each client with
customizable, easy-to-understand reports and
dashboards, that could deploy quickly, and that clients
would actually love using. We knew it was a tall order
ut a leau fit our needs per ectl nothing else
came close.”
Flexible configurations
he new generation o rapid-fire usiness intelligence
led by Tableau Software proves its value at every step.
a leau a orda l supports irtuall an configuration
from one employee to thousands, on mobile devices
and in the o fice roo s o concept o s are as
easy as downloading trial software over the web. Arm
employees with desktop authoring via Tableau
Desktop, and choose among on-premise, hosted, or
cloud deployments for Tableau Server to deliver web
and mobile analytics.
Tableau is much easier to deploy, administer, and
scale than traditional systems. There are no new
data ases to configure no new iddle-tier ser ers
no painful data modeling exercises, and no weeks-long
administrator training classes. Existing security and
authentication models like Active Directory and
trusted tickets provide compliance. Upgrades are
seamless. Scalability is built-in: the software can
scale to thousands of users by leveraging low-cost
hardware options. And starting in Tableau 8.0, web
and mobile users can author without ever
downloading Tableau to a computer.
The Technologies
Behind Tableau Rapid-fire
Business Intelligence
hat a es rapid-fire usiness intelligence so ast It
starts with VizQL™, Tableau’s patented query
language that allows you to visualize data of any size,
subject, or format via simple drag and drop. VizQL
translates your actions into a database query and
then expresses the response graphically. This creates
a fundamentally new way of interacting with
databases and spreadsheets. Computational support
for visualization gives you the ability to iterate on
different presentations of data, asking new questions
and exploring it interactively.
A ter i the ne t rea through in rapid-fire
business intelligence is the ability to rapidly access
and leverage existing databases via Tableau’s
direct-connect-and-query capabilities. With optimized
connectors to virtually every data source including big
data, Tableau connects to and queries your live data
sources without requiring any technical knowledge.
But Tableau doesn’t stop there. When you can’t or
don’t want to connect to a live data source, Tableau
offers the ability to do ad-hoc analysis of millions of
rows of data in seconds with Tableau’s Data Engine.
Tableau’s built-in Data Engine is fast for massive data
so you can shift easily between views to discover
meaningful trends and outliers. The Data Engine is a
high-performing, in-memory analytics database on
your PC. It works to speed up slow data sources, and
you can still choose to connect directly to fast data
stores to take advantage of their speed. And of
5
InfoWorld, “Big data visualization: A big deal for eBay,”
December 6, 2012
14. p14
ANewApproachtoBusinessIntelligence:Rapid-fireBI
course, the two styles of data access (live and
in-memory) are completely compatible: you can blend
and combine multiple data sources regardless of their
live or in-memory status.
Databases, Cubes, Spreadsheets, Hadoop & More
In-Memory Data Live Connection
PC Browser iPad Android
Desktop
Figure 10. Tableau Architecture.
Tableau’s architecture provides two ways to work
with very large data sources: in memory and
live connection.
Conclusion: The Bottom Line
There is a sea change occurring in what enterprises
and public-sector organizations expect from business
intelligence. The old BI models are slow and
resource-intensive. When families bring a sick child to
Seattle Children’s Hospital, they want help fast. The
importance of speed is not limited to a hospital —
competitive businesses are unable to wait for months
to make money or save costs. At a pace that has
outmatched competitors, M Financial Group has
launched over 20 M-priced proprietary products for
North America’s most recognized and respected
insurance brands: “Using Tableau, I am able to
uic l drill down into large sets o data and find
relationships that would have taken 10X as long with
traditional query tools,” noted Brandon Nichols,
director of technology strategy for underwriting and
new business process.
“Using Tableau, last year we owned a two
percent increase in revenue, that’s $200
million U.S. dollars. If you want to own the
money in the aviation or transportation
industry, you’re using Tableau.”
James Pu, Senior Executive of Networking and
Revenue, China Eastern Airlines
Data-driven decisionmaking is only helpful if you can
view and communicate insights in time to take action.
Across industries and the public sector, today’s
employees who have grown up with the Internet and
social media are unwilling to wait in a months-long
queue for a new report or a change request. It’s time
for a new approach to business intelligence.
he si attri utes o rapid-fire usiness intelligence
will enefit ou our tea and our organi ation
You’ll spend less time and fewer resources to enable
more self-reliance, data discovery and better
collaboration; all while tackling diverse big data and
scaling at your organization’s own pace.
Whether you are one analyst exploring data with
Tableau Desktop or thousands using web-based and
mobile business intelligence with Tableau Server,
a leau o tware deli ers rapid-fire usiness
intelligence. Tableau Desktop and Tableau Server
answer deep analytical questions and make it quick
and easy to share dashboards with colleagues in the
o fice or on-the-go
See how Tableau can help you by downloading the
free trial at tableausoftware.com/trial and receive free
online training at tableausoftware.com/learn/training.
Congratulations, you’ve just joined the future of
rapid-fire usiness intelligence