Download to read offline


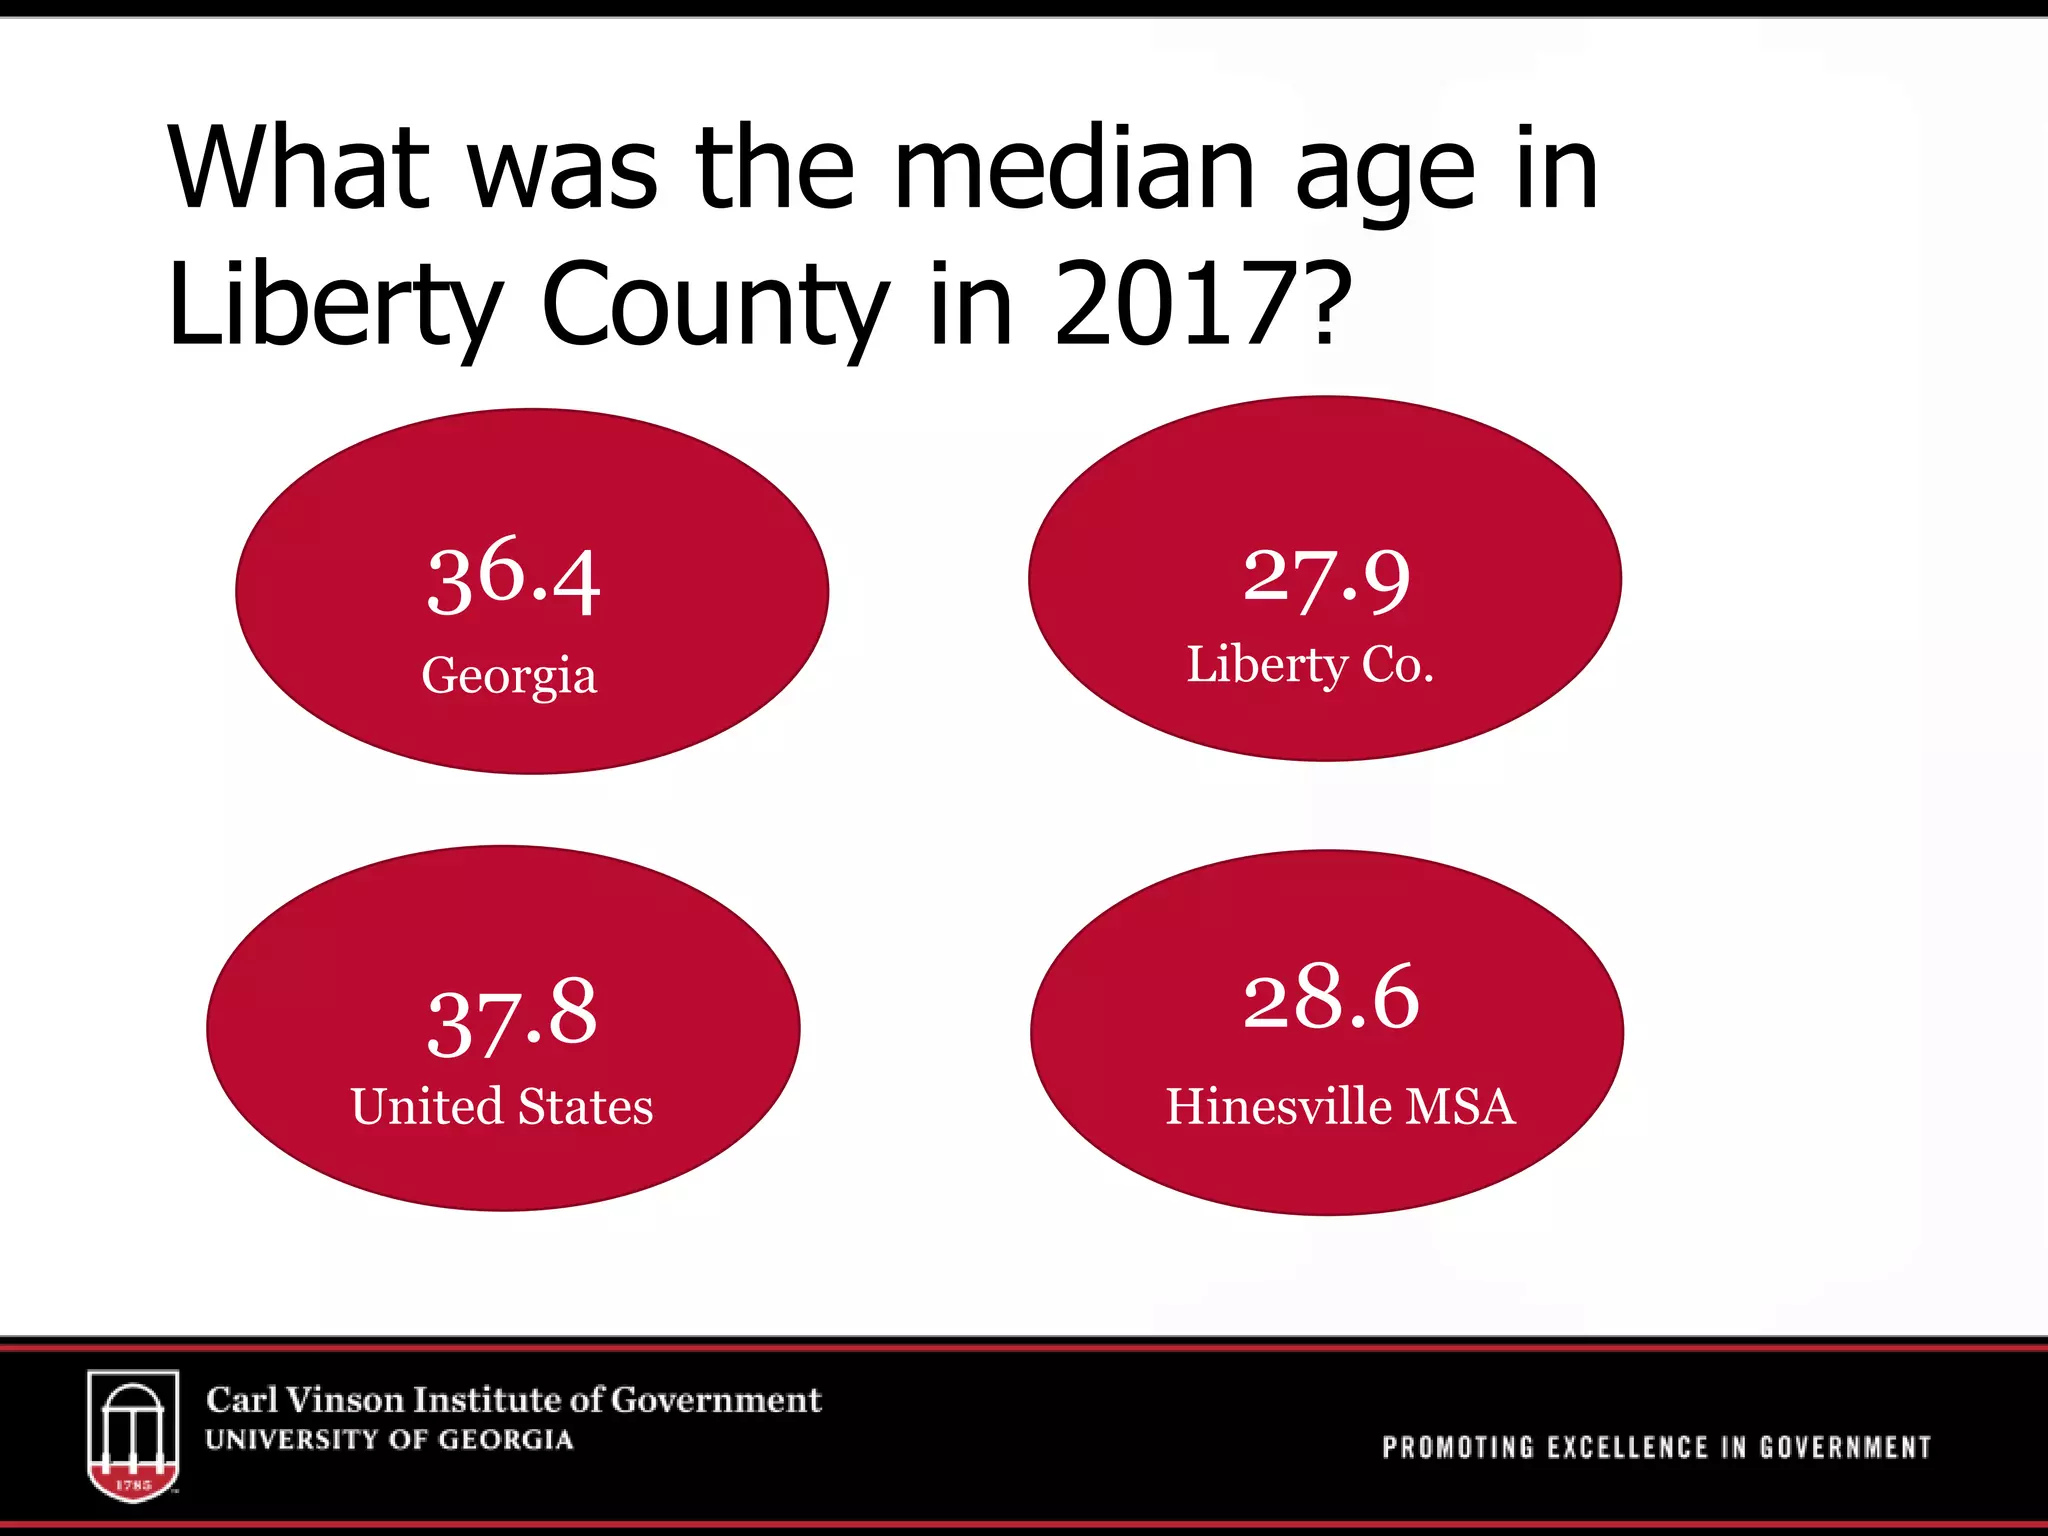

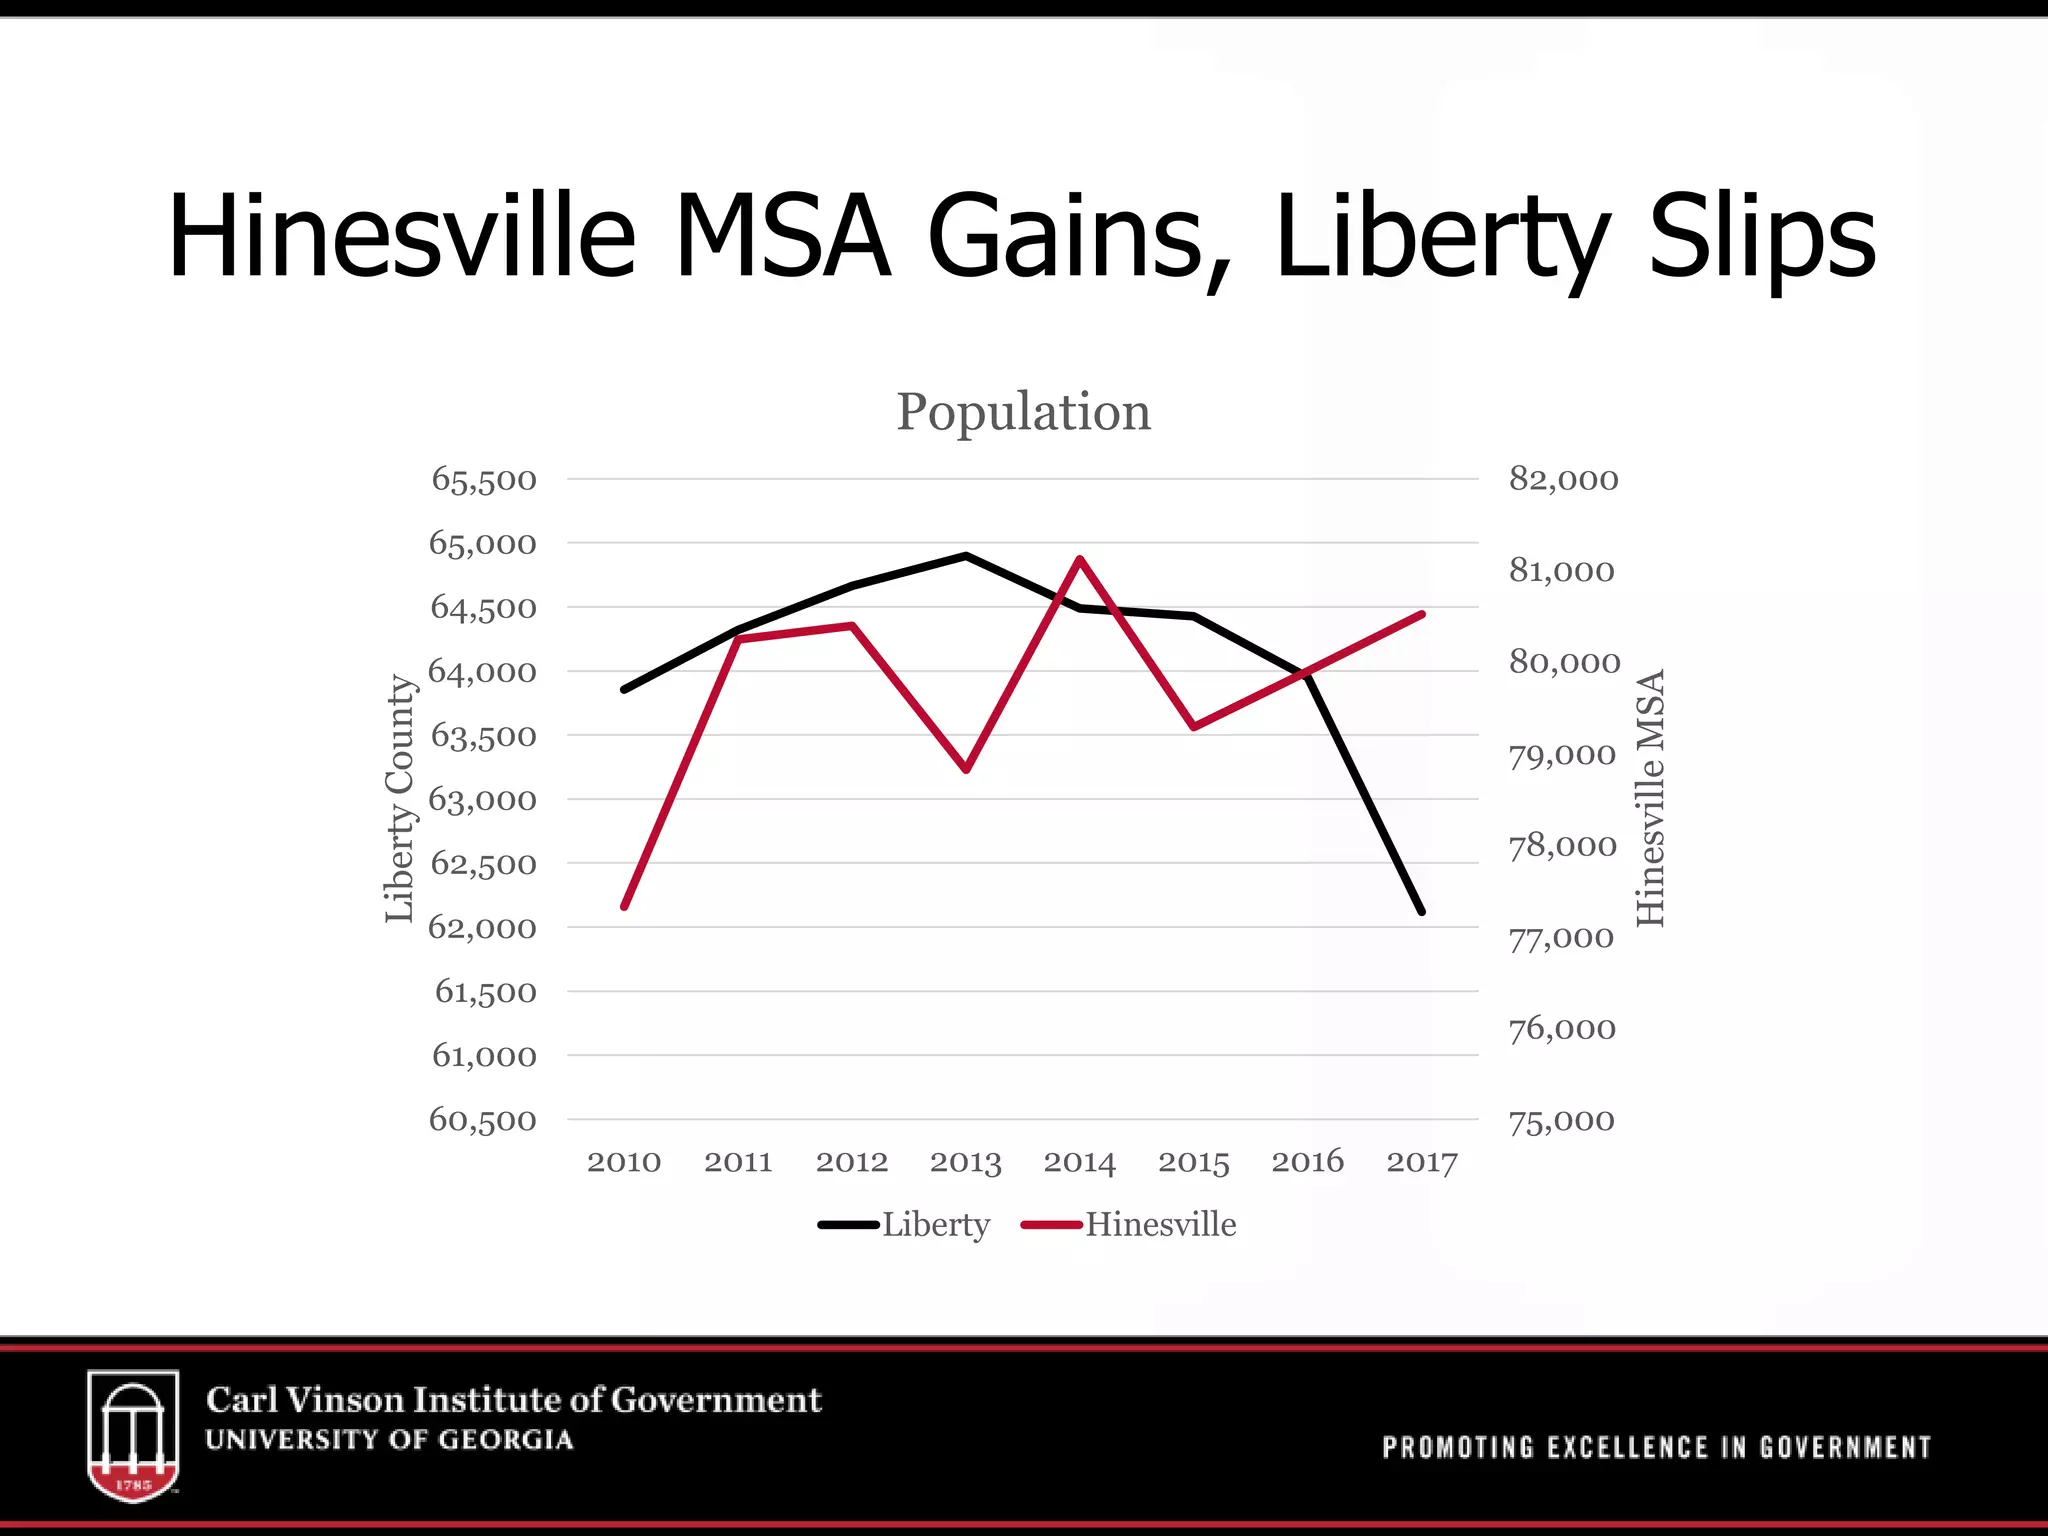
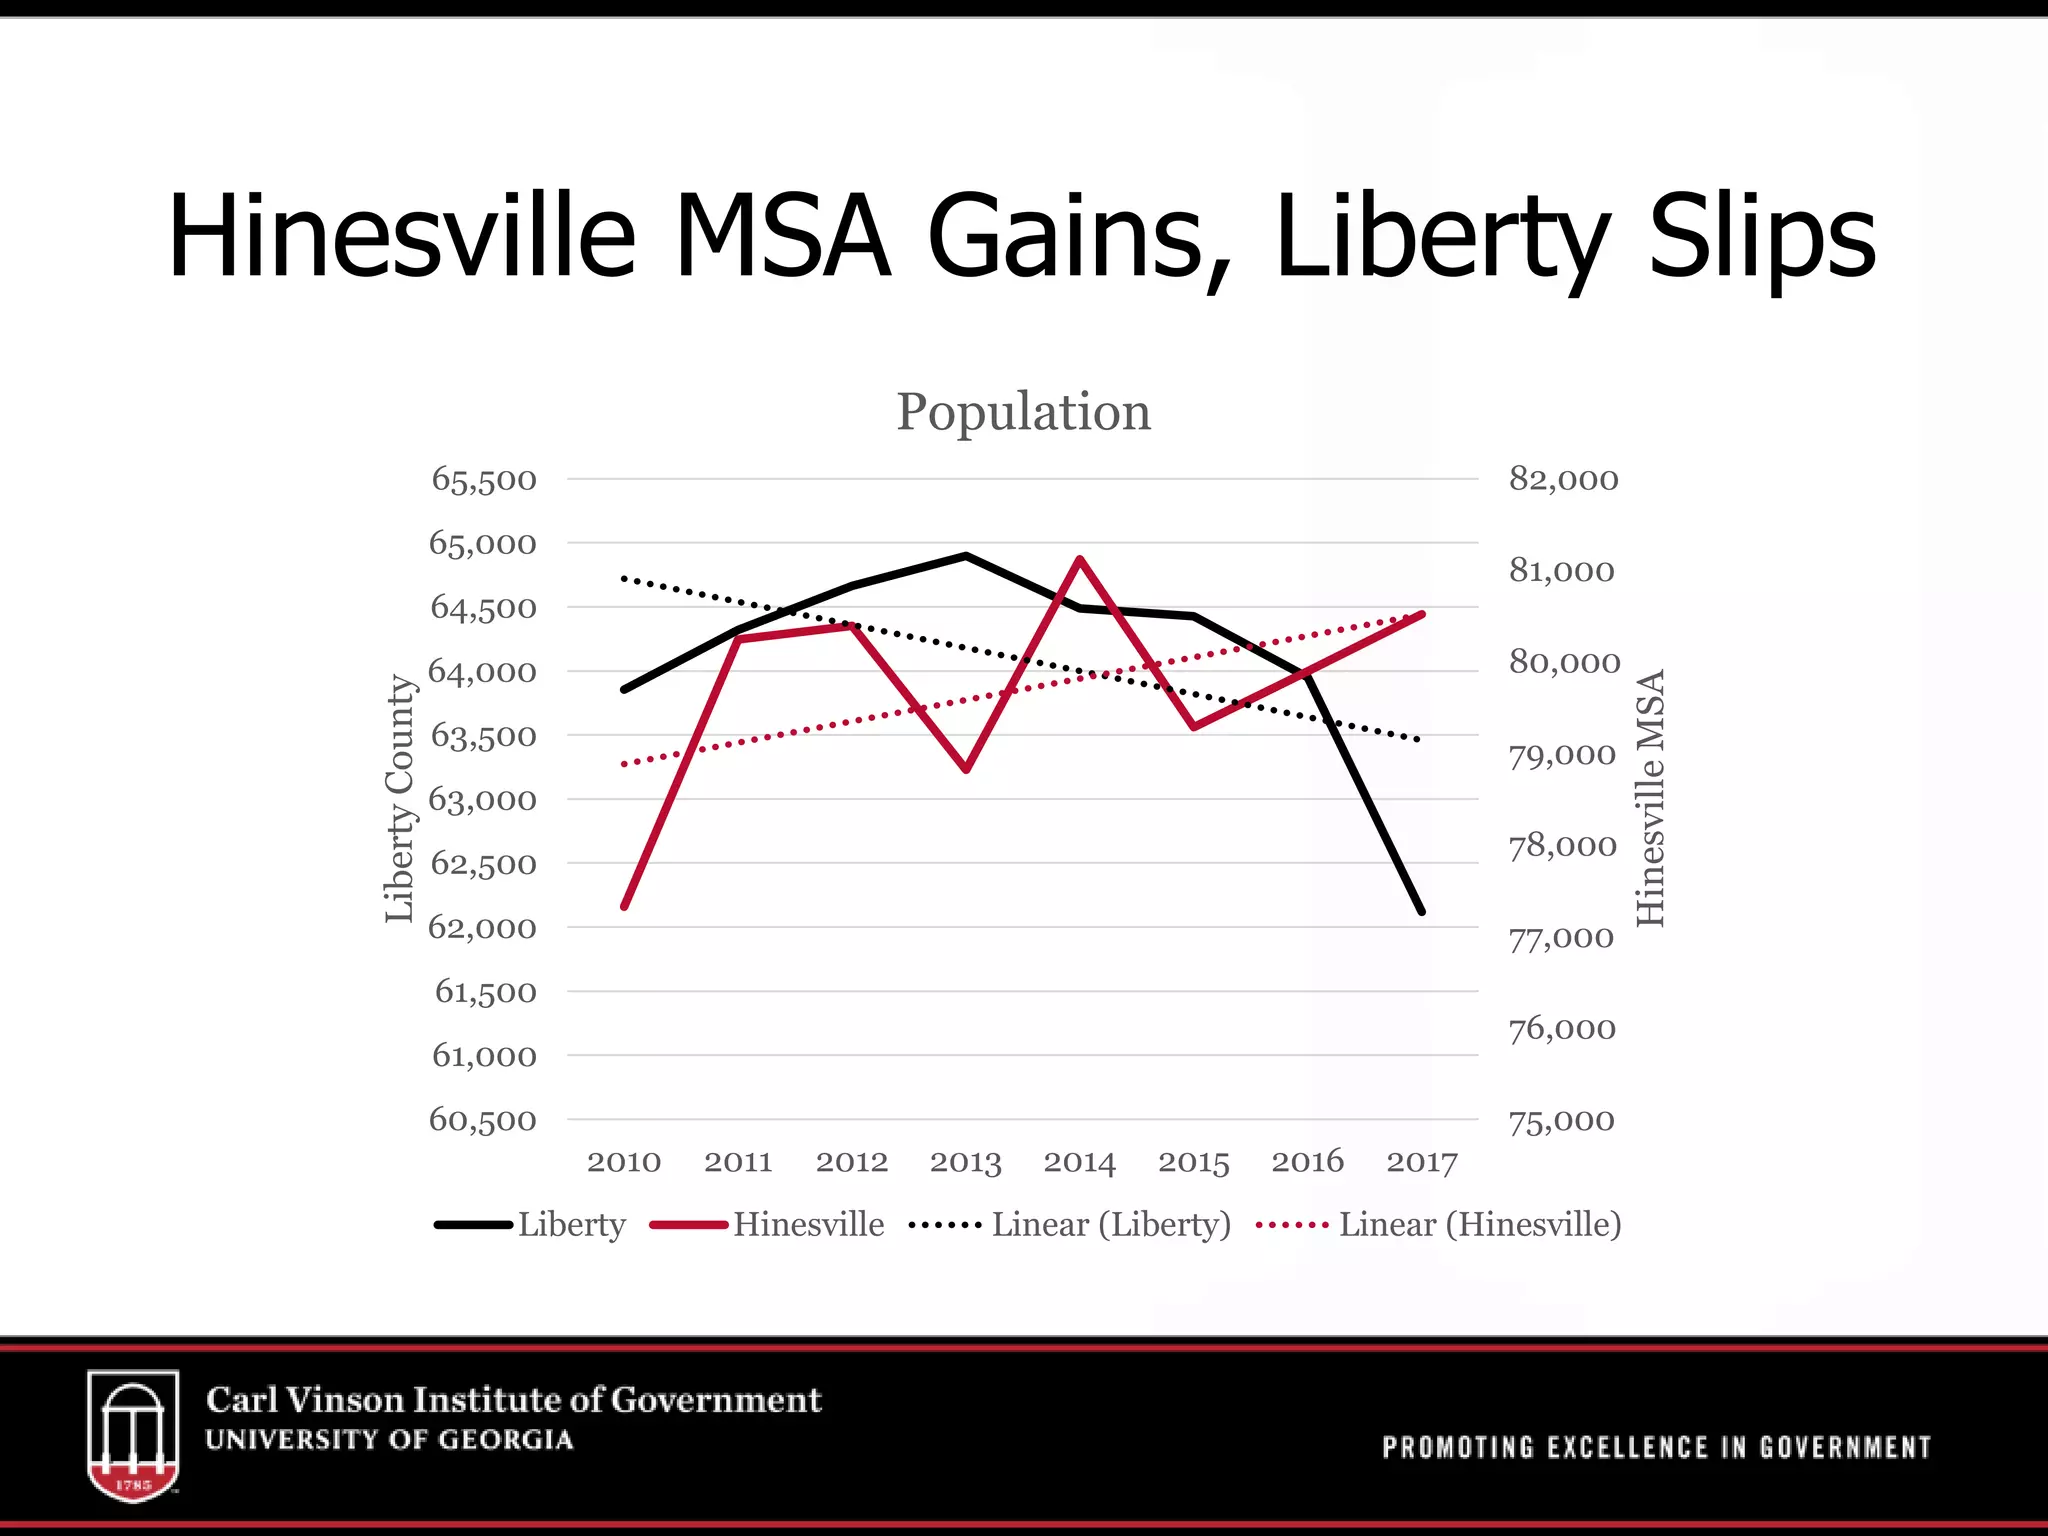
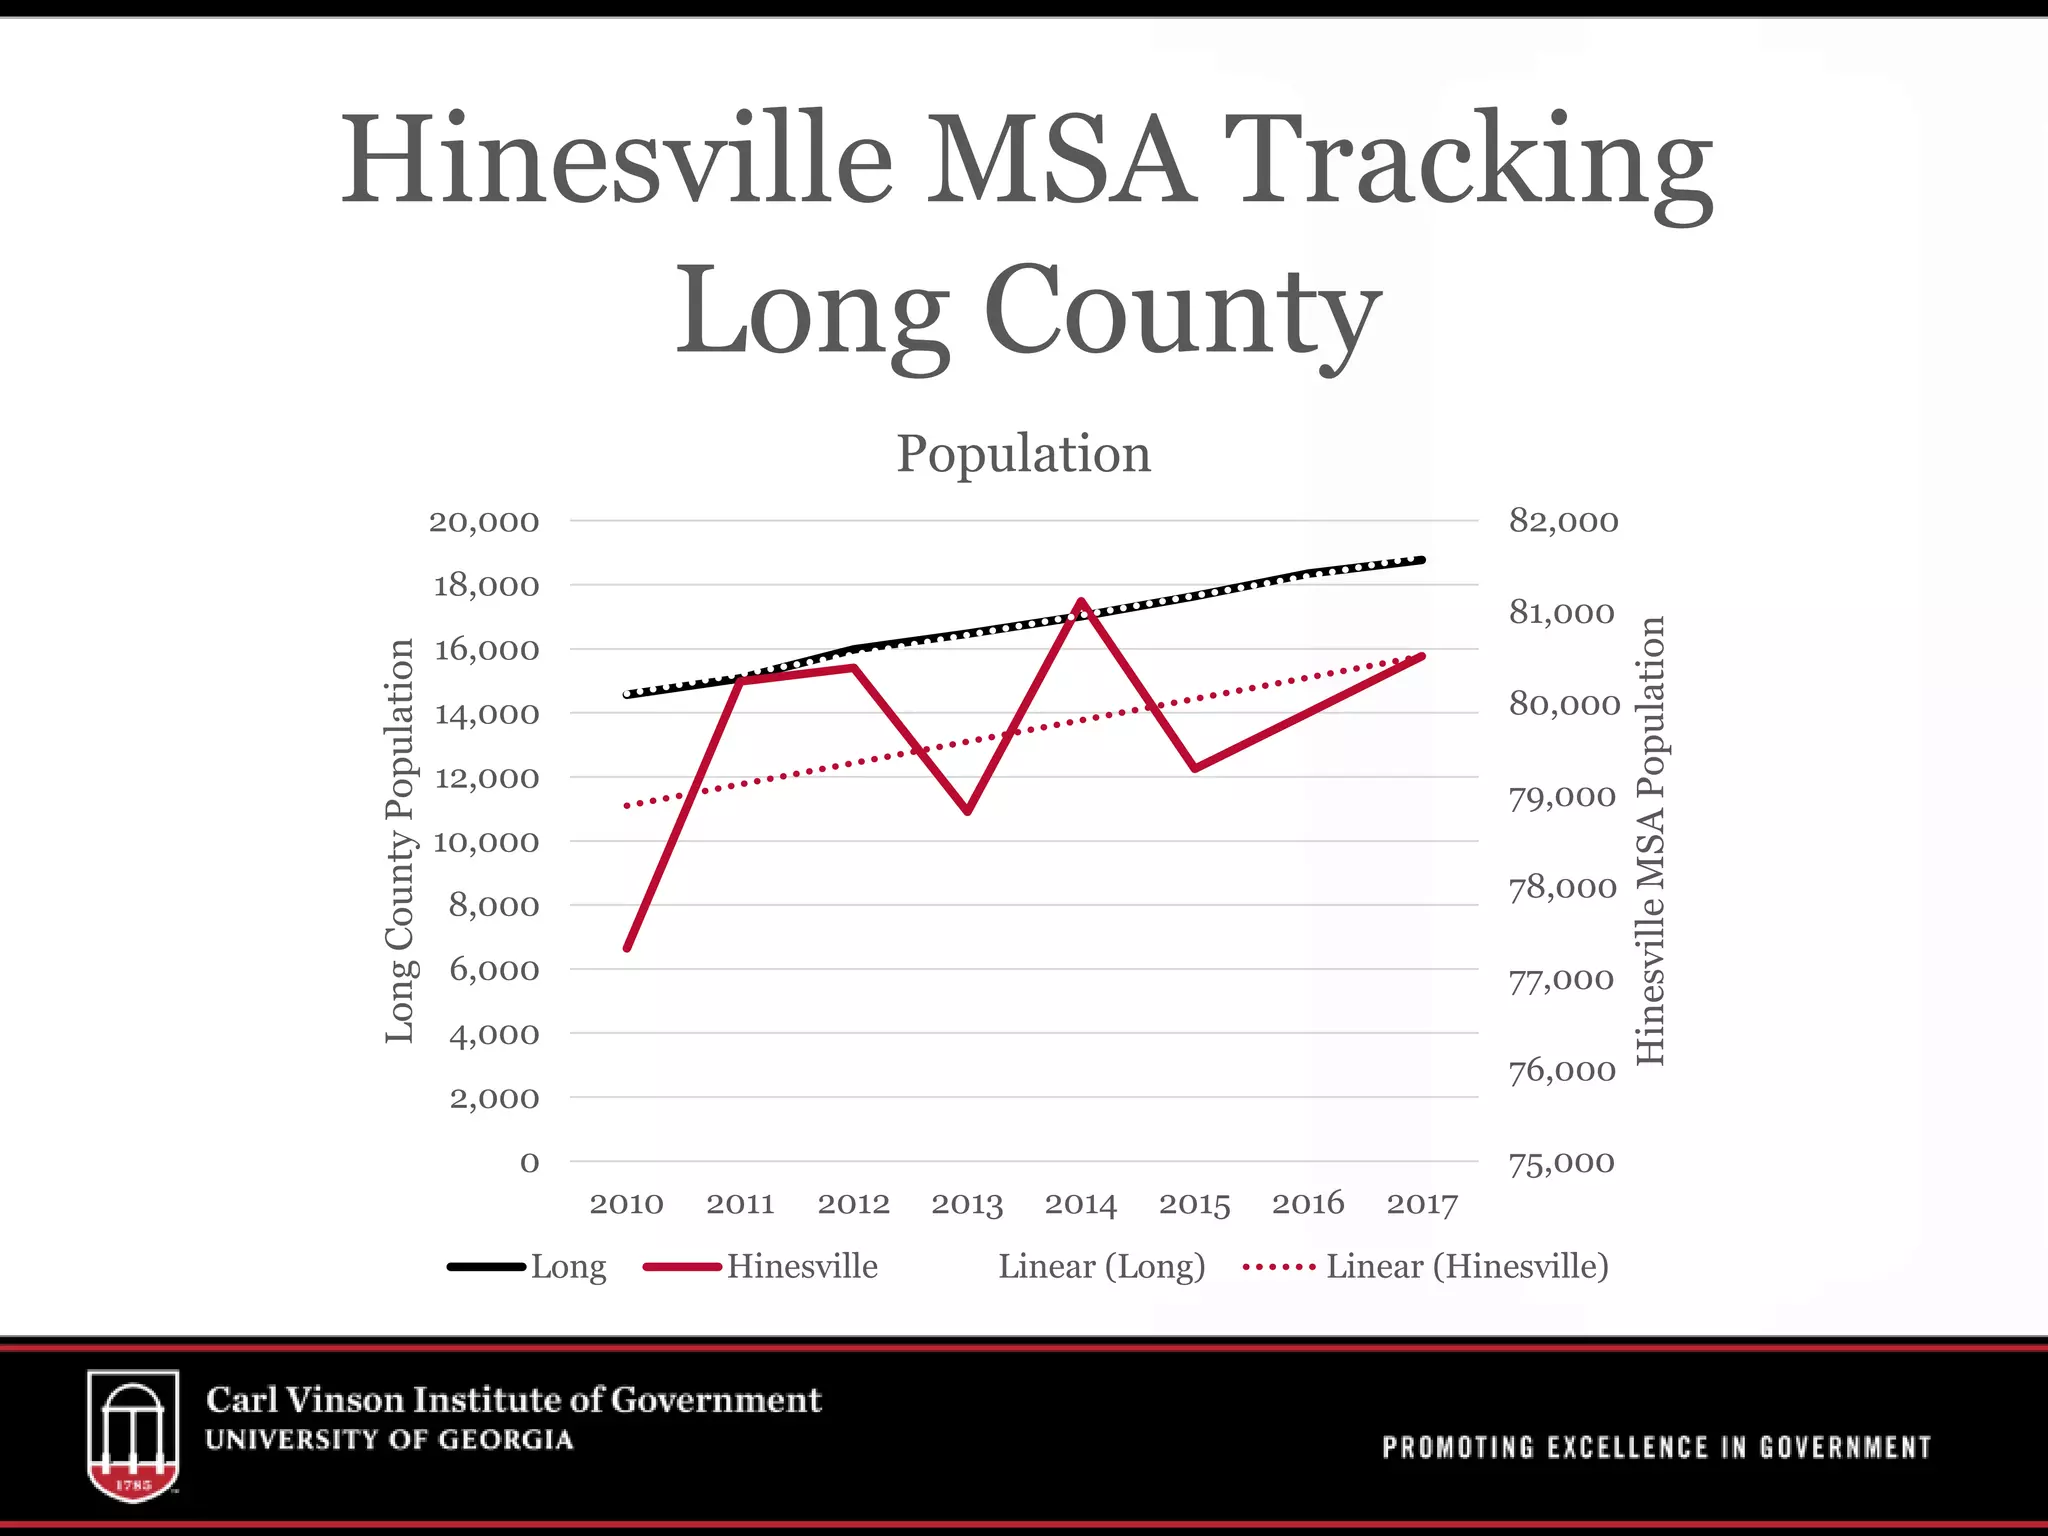

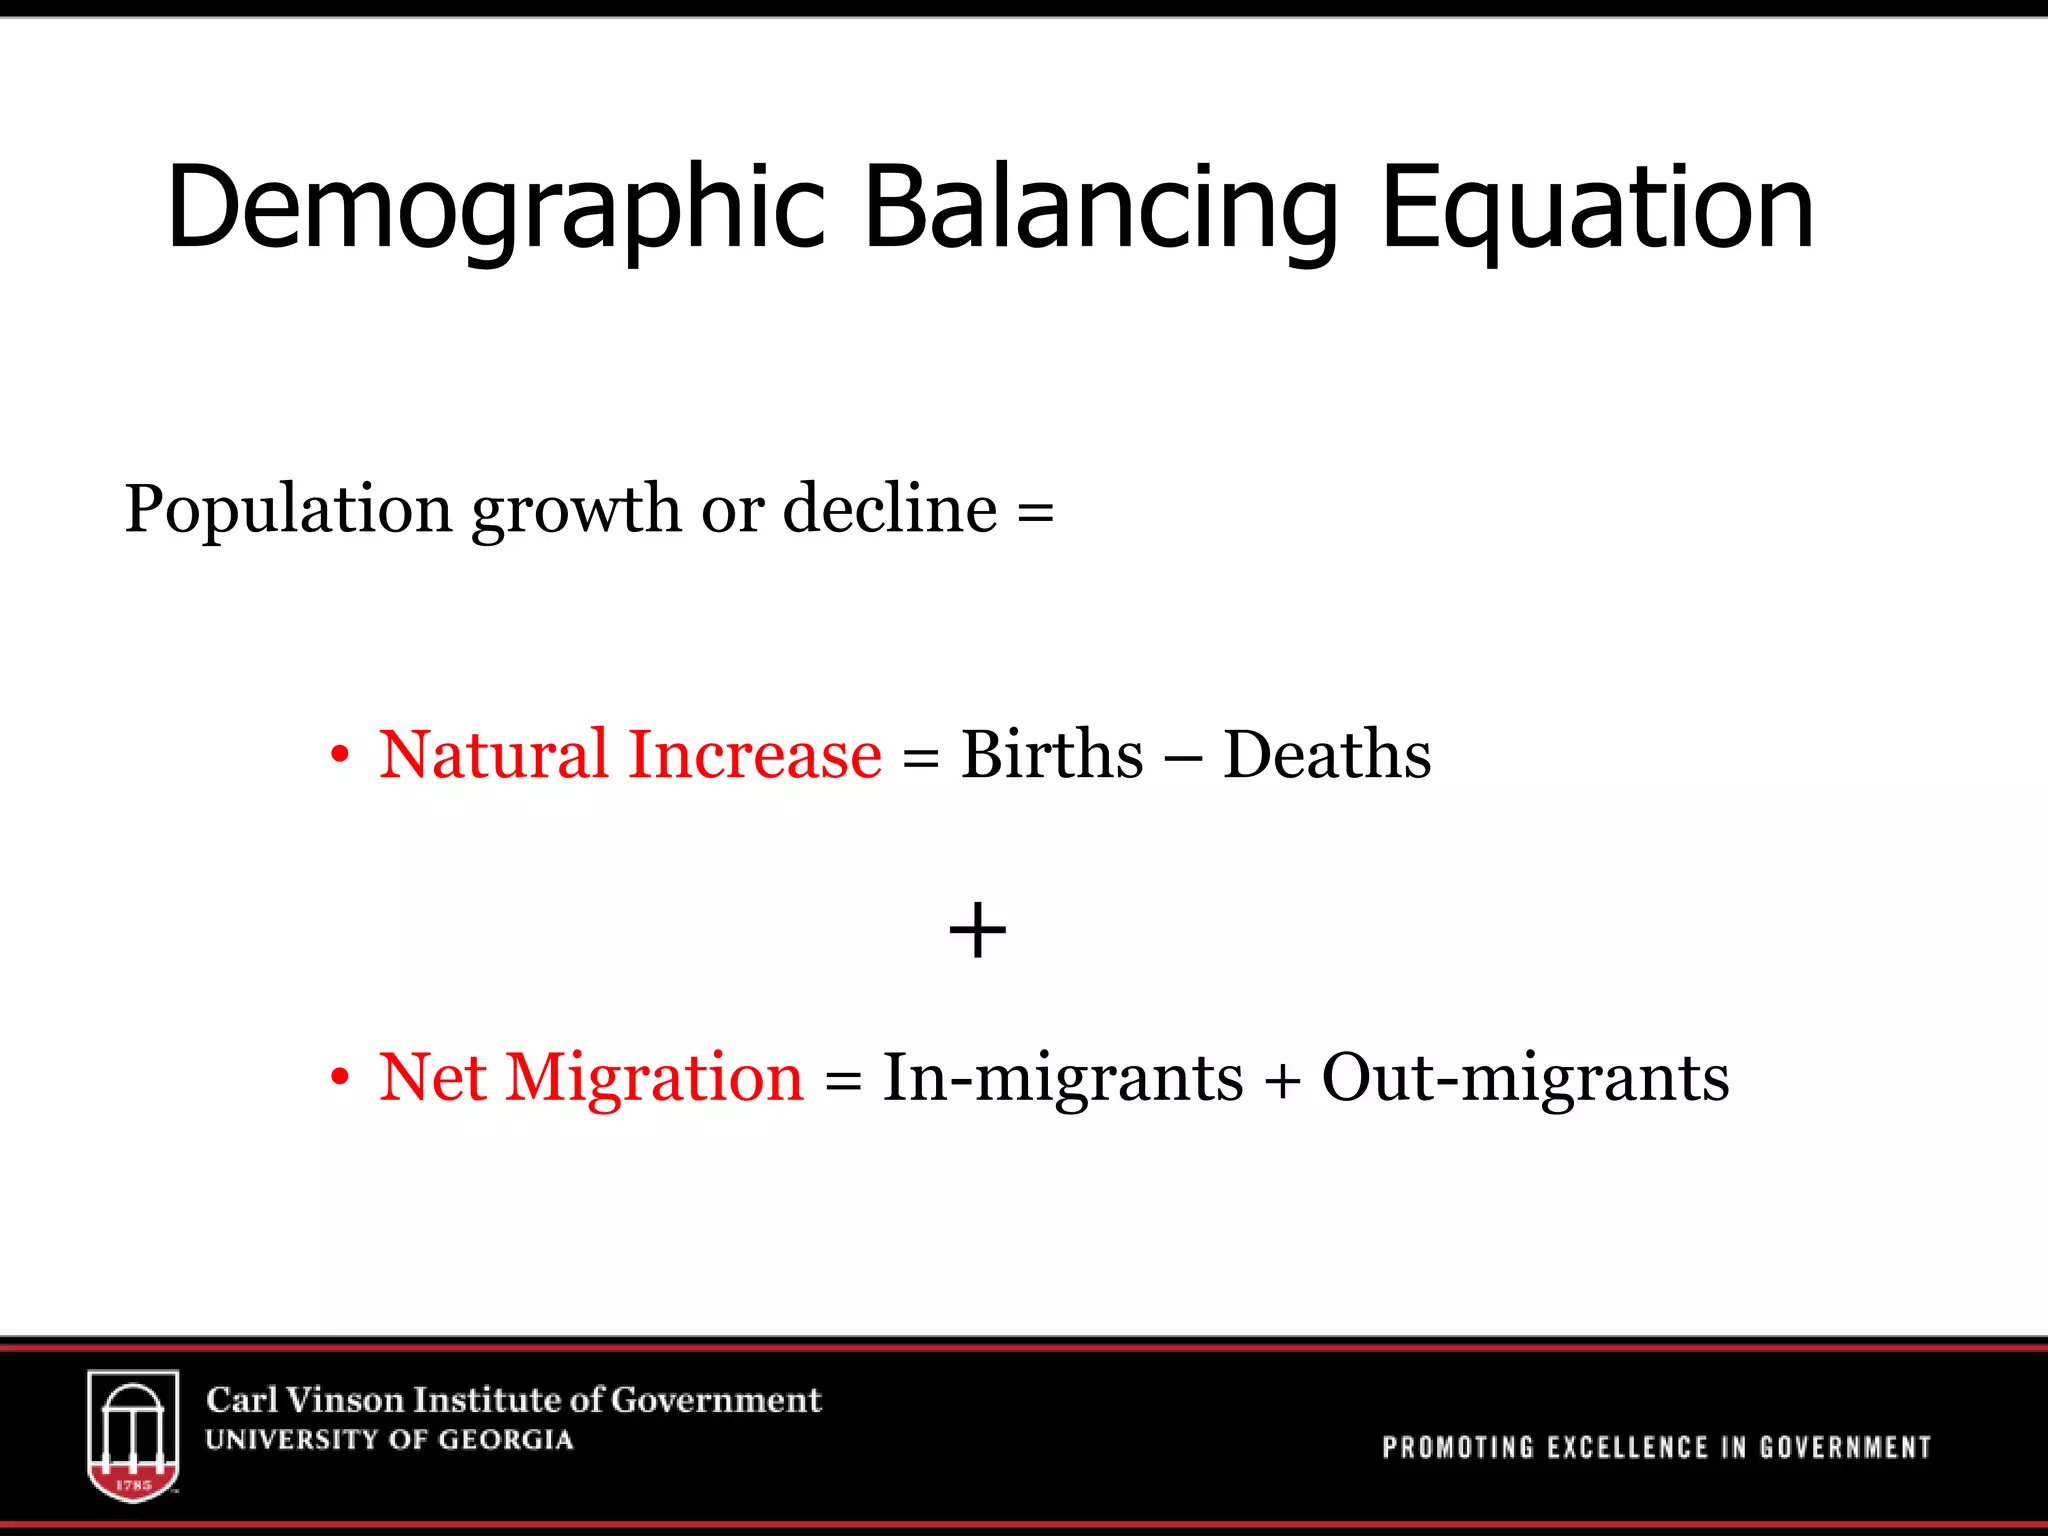


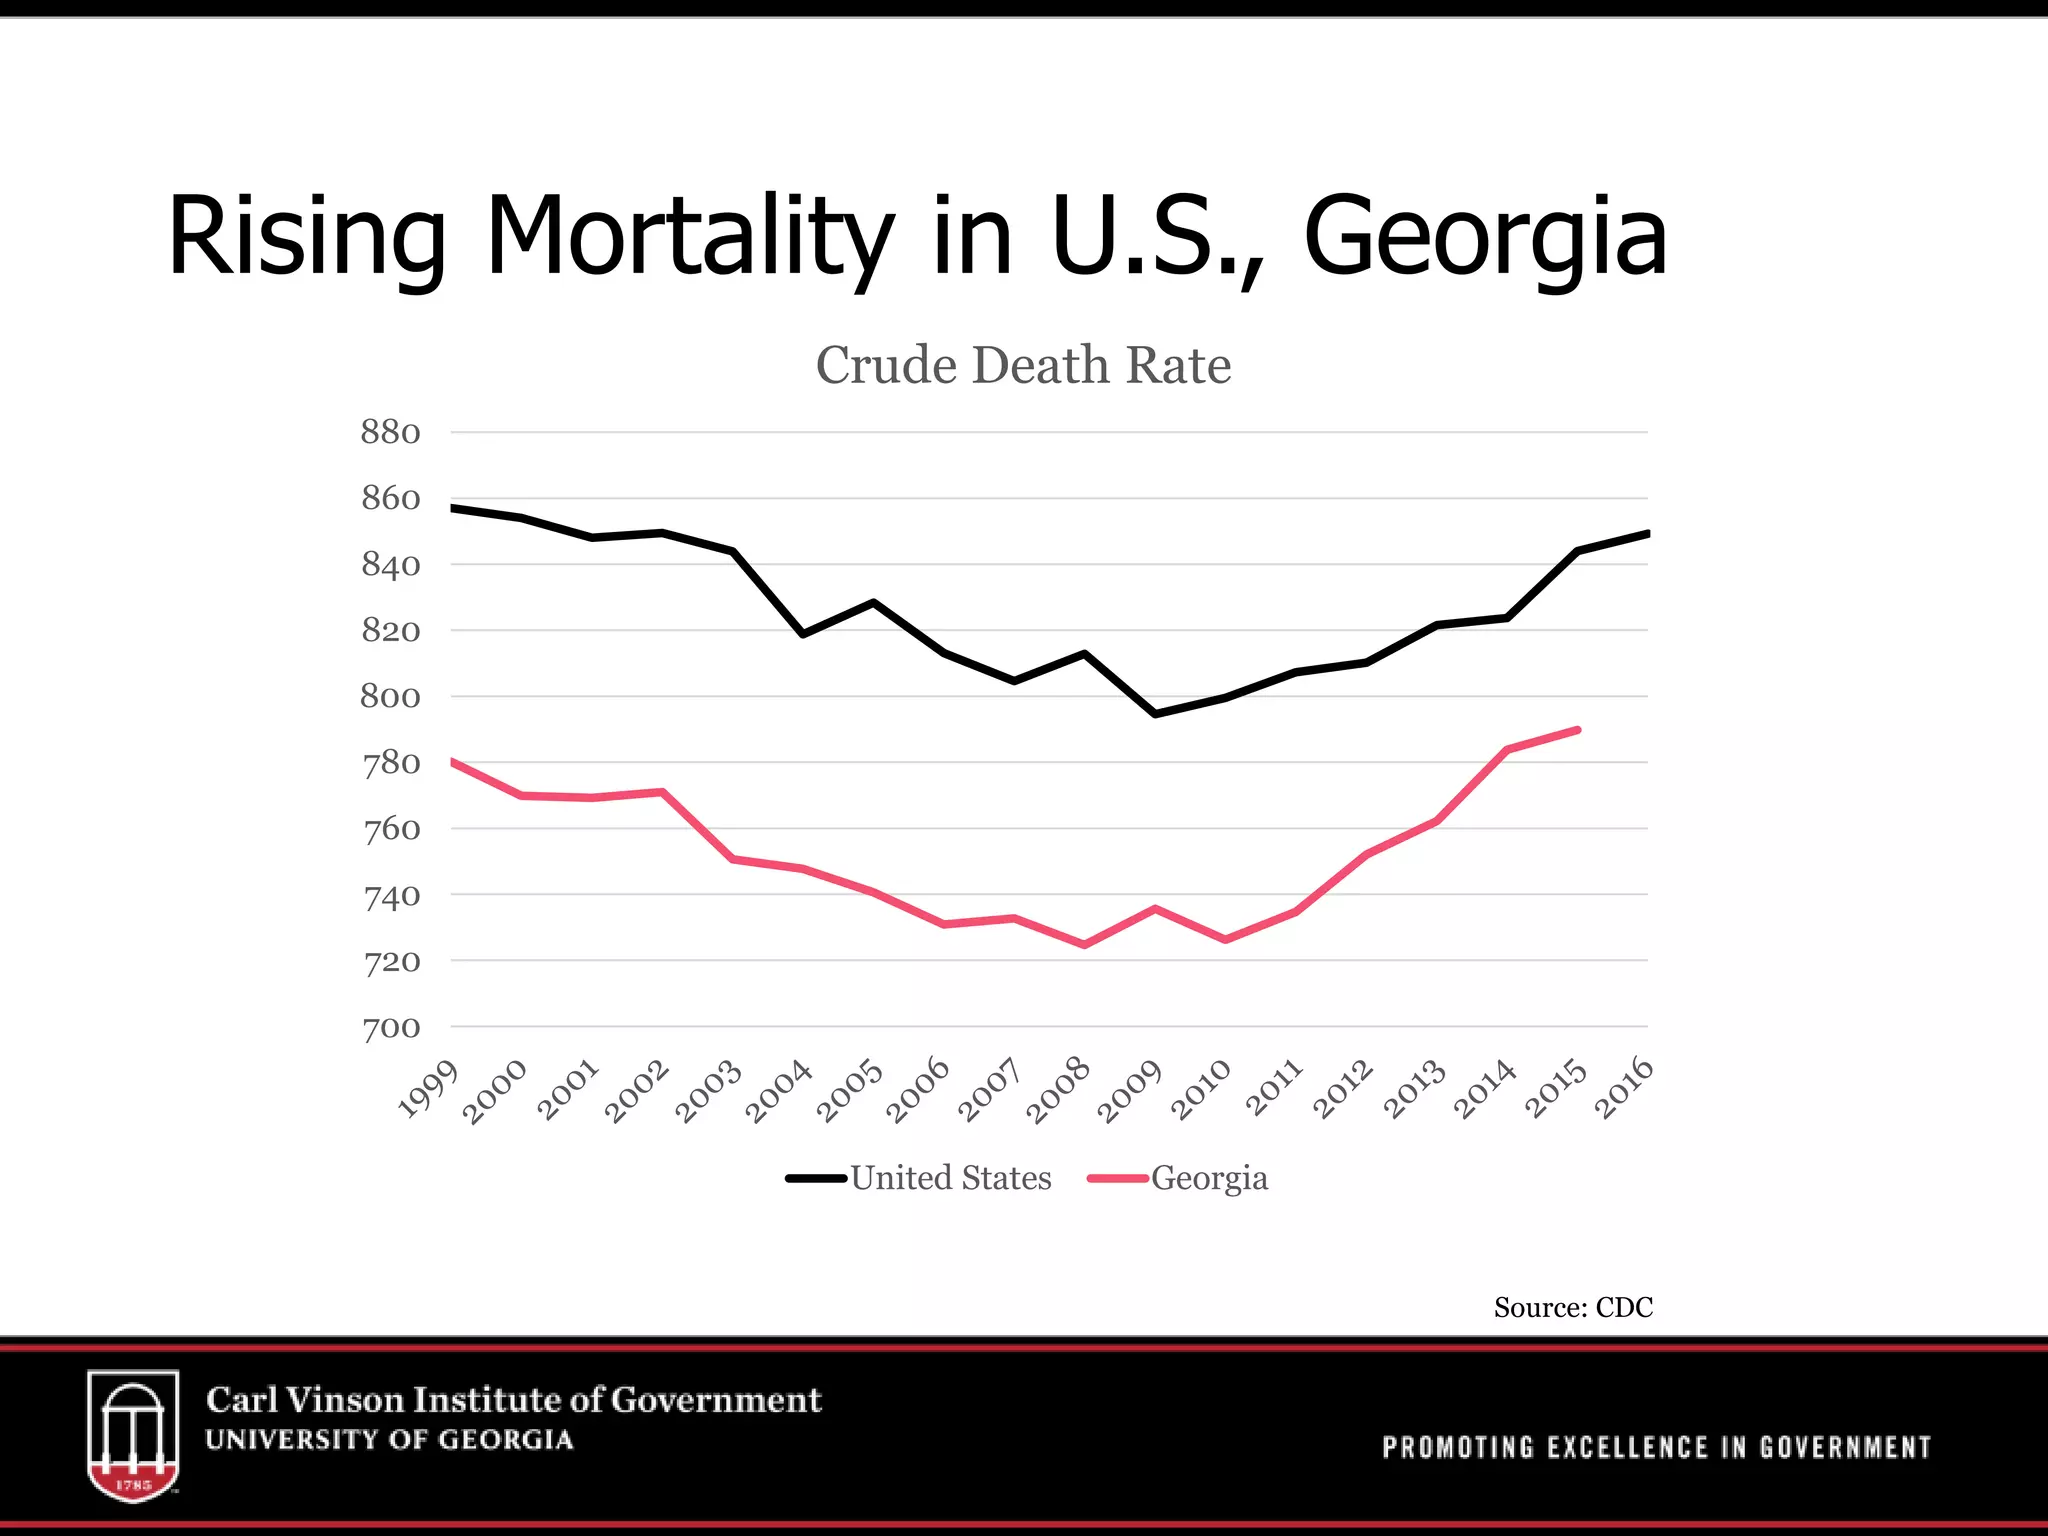


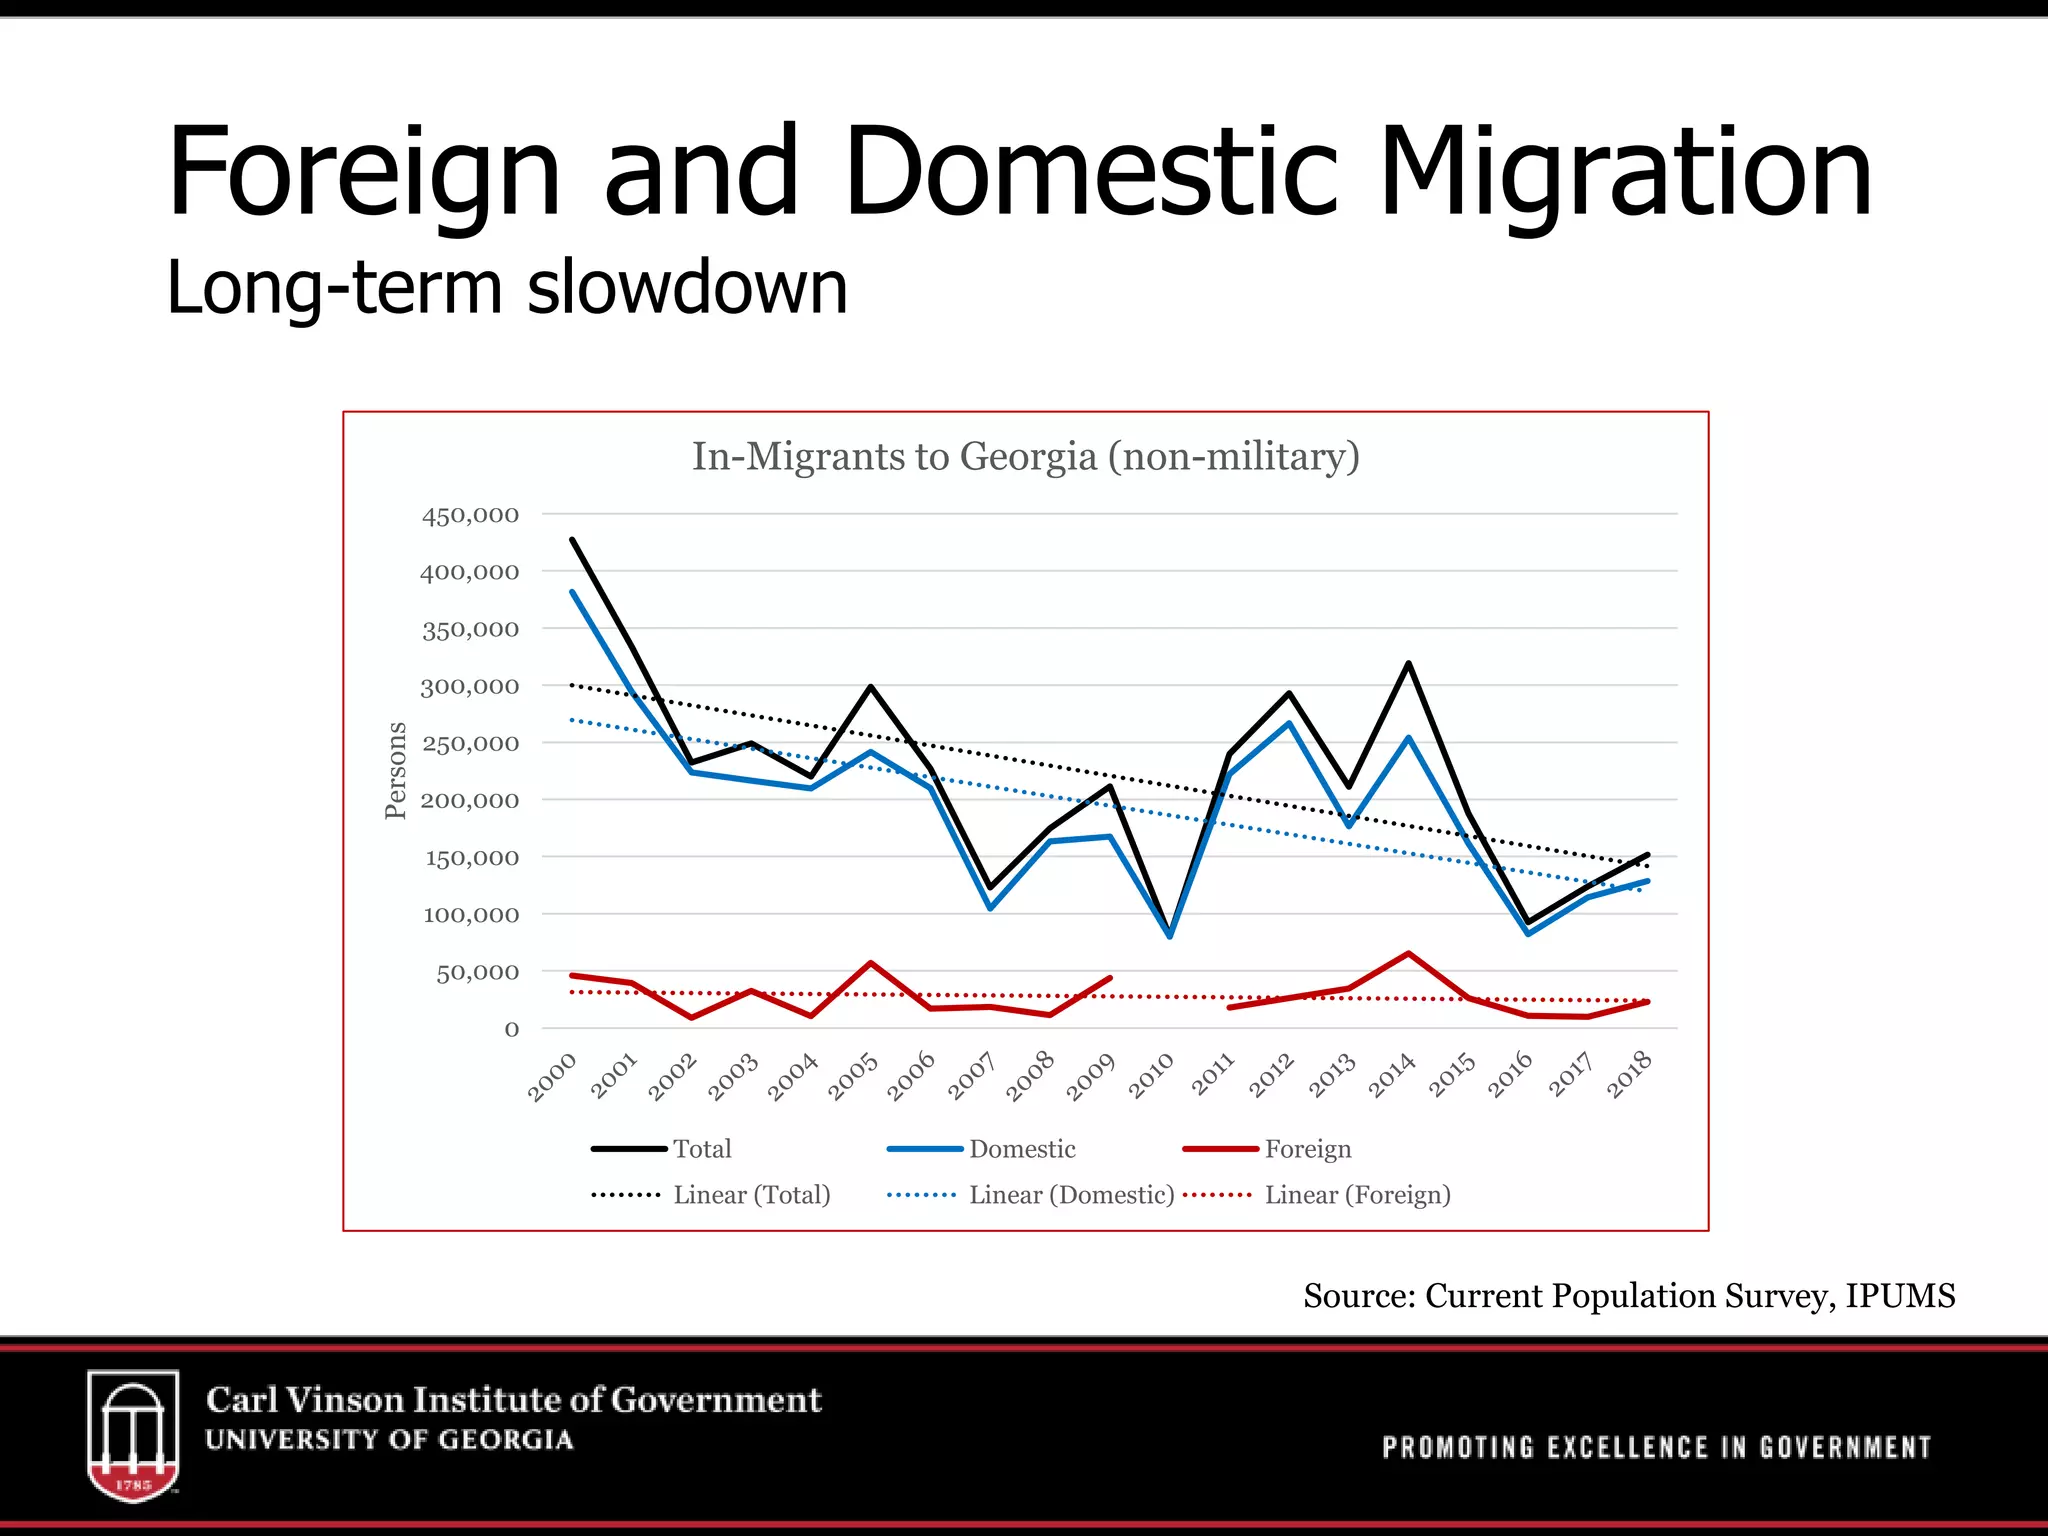


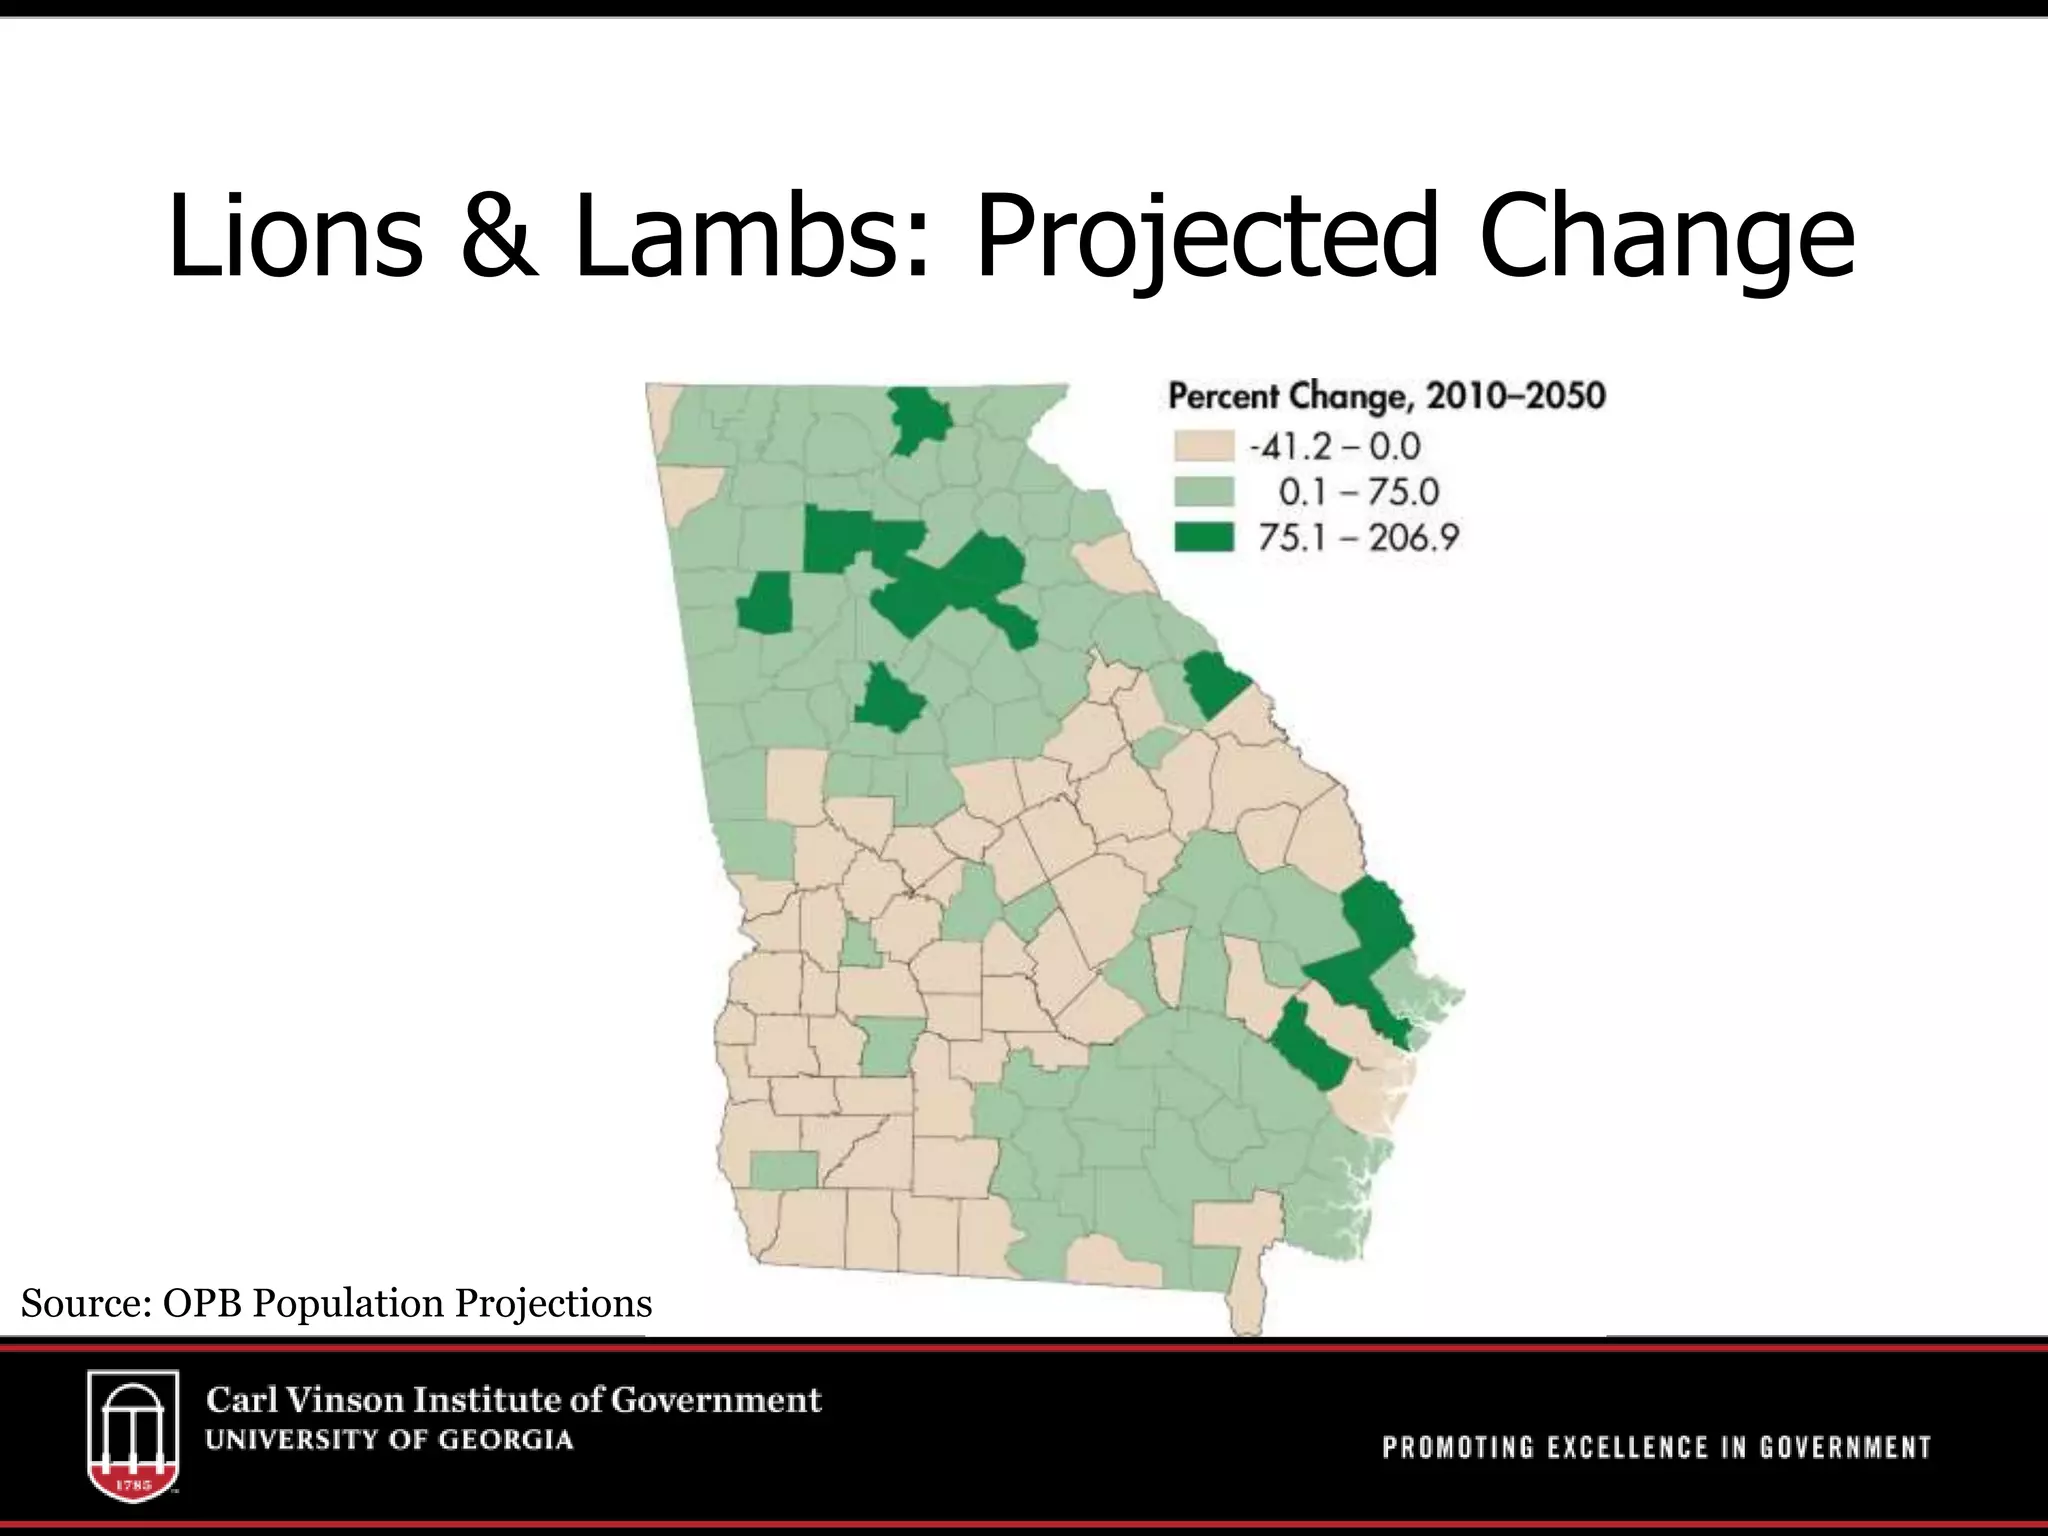


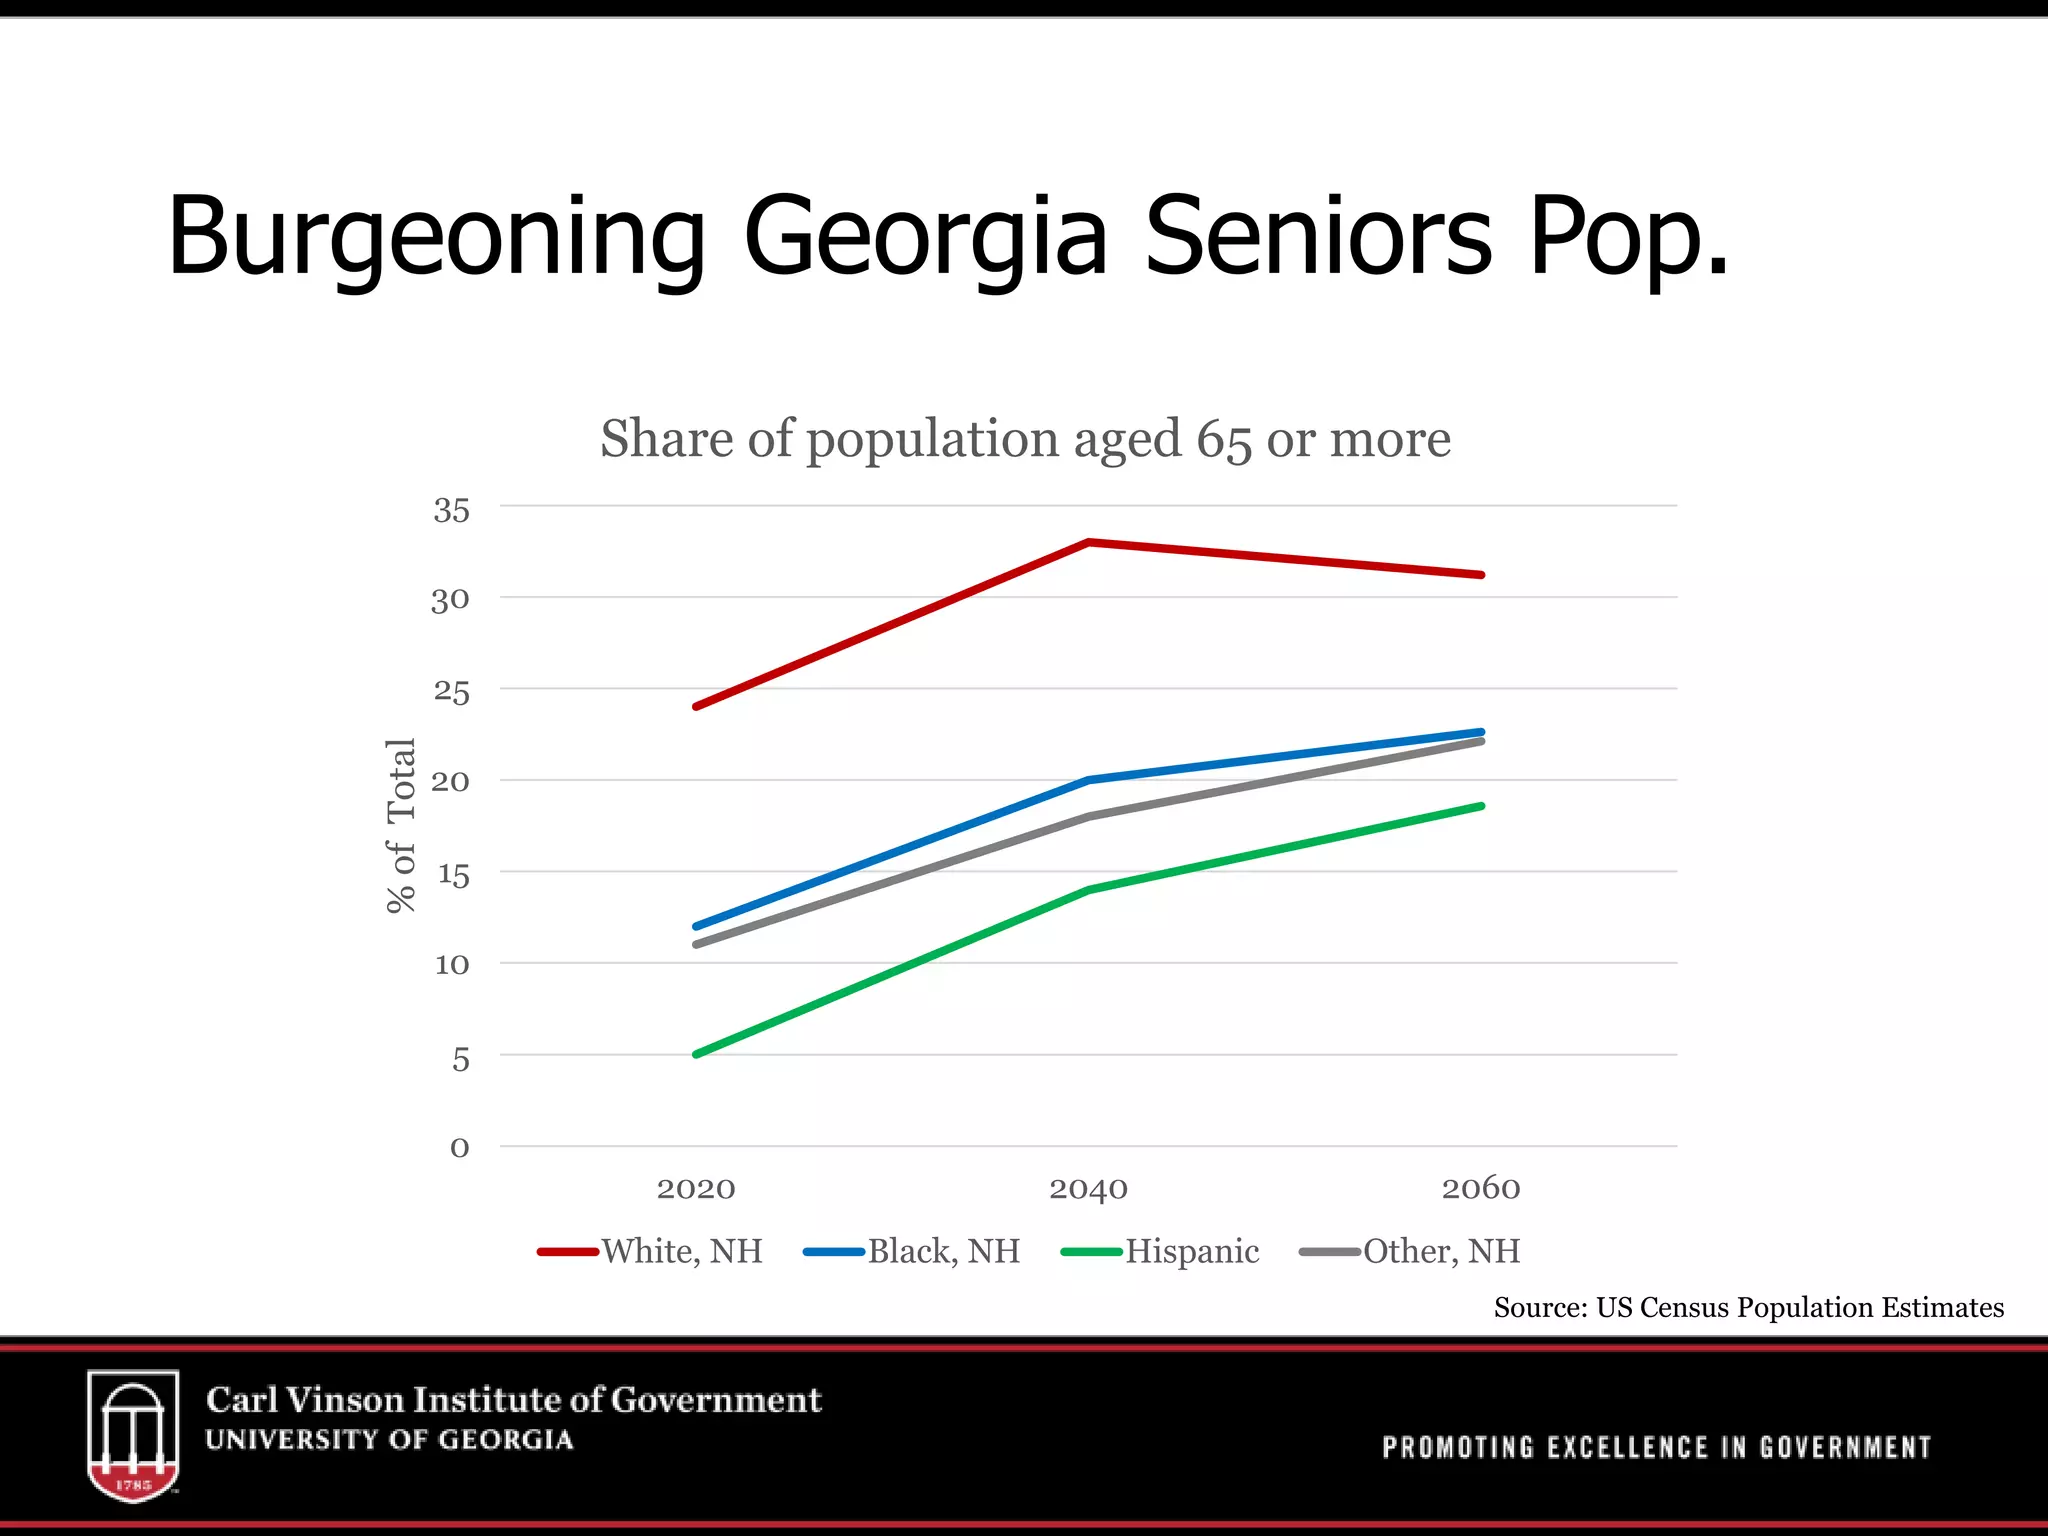
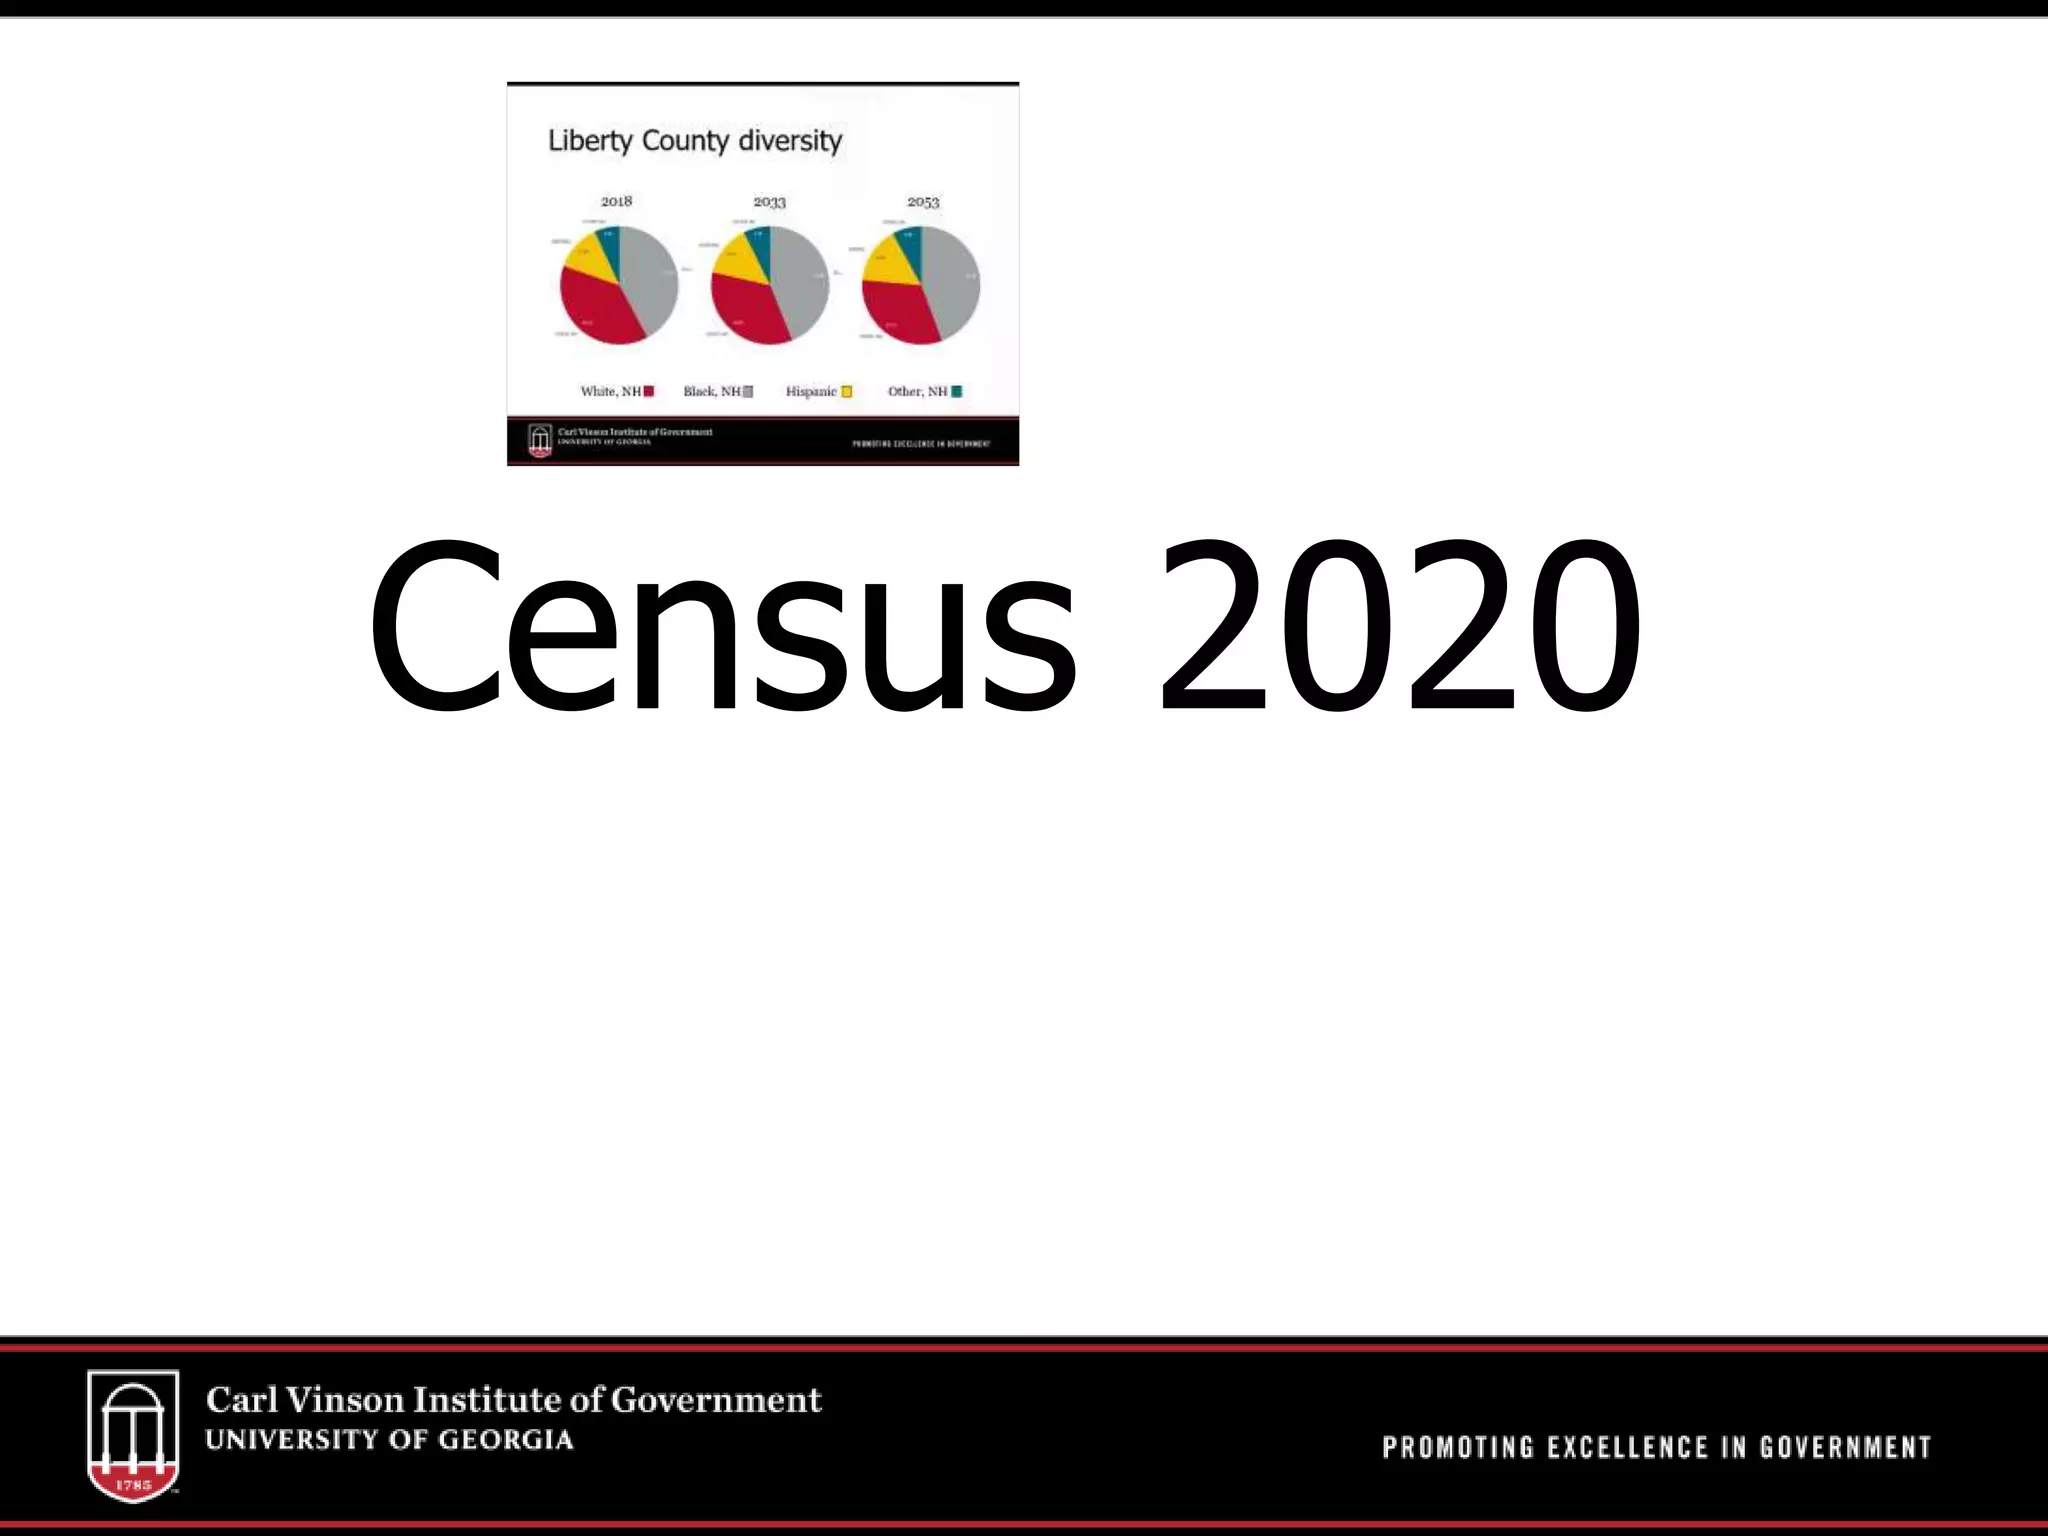


The document discusses the evolving demographics of Georgia, highlighting trends such as urban growth, fertility stall, and an aging population. It notes that while Georgia's overall population is increasing, Liberty County is experiencing slower growth and declining trends in births. Additionally, the document explains the impacts of mortality rates and migration patterns on population changes in the state.