Download as PDF, PPTX

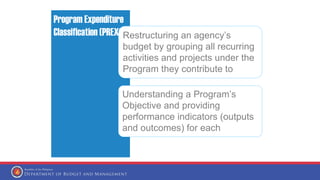
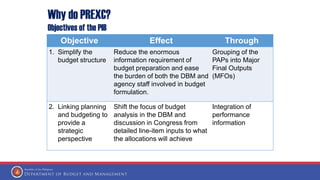
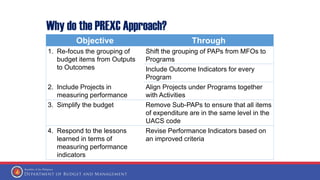
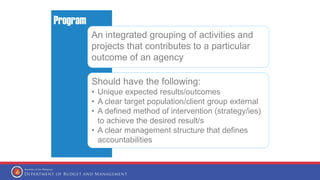
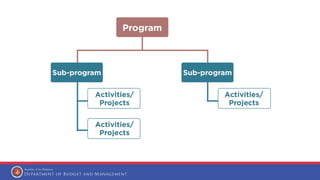
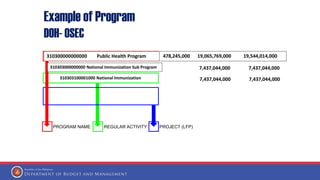
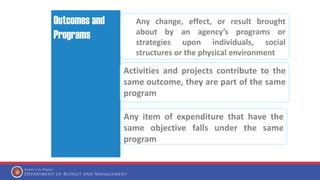
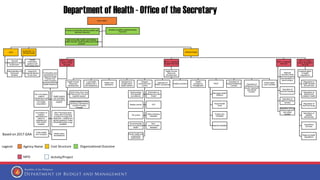
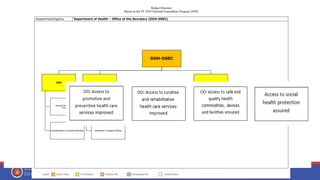
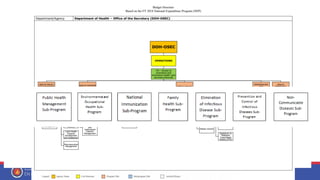
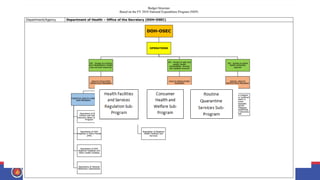
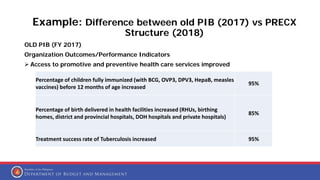
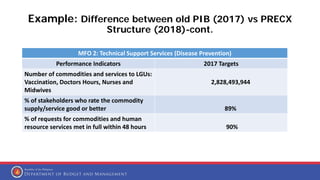
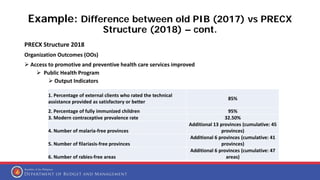
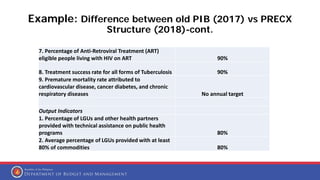


The document discusses the Program Expenditure Classification Restructuring (PREXC) approach which aims to simplify the budget structure, link planning and budgeting, and measure performance. It does this by grouping all recurring activities and projects under the programs they contribute to and providing performance indicators for each program objective. This shifts the focus from line-item inputs to the intended outcomes of allocations. It also defines what constitutes a program and provides an example comparing the old and PREXC structures, showing how the PREXC approach organizes budget items by program and associated outcome indicators.