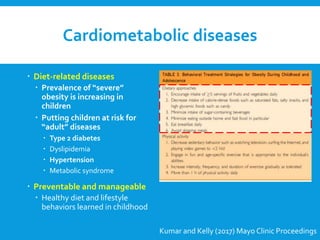
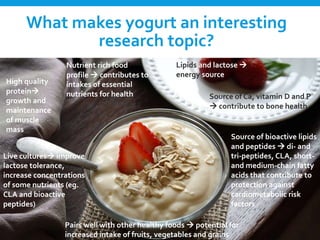
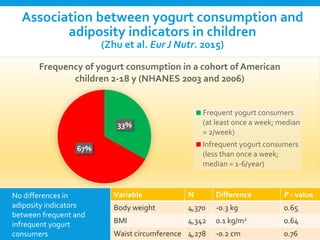
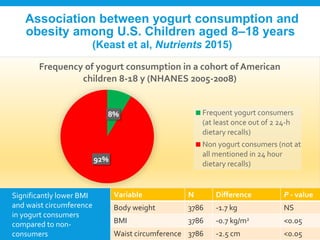
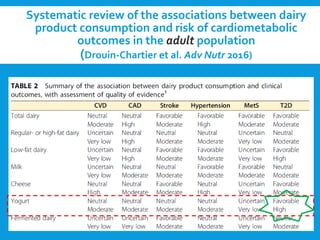
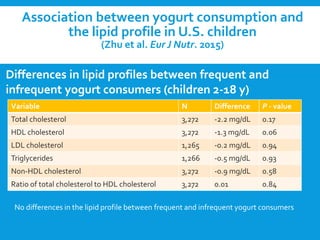
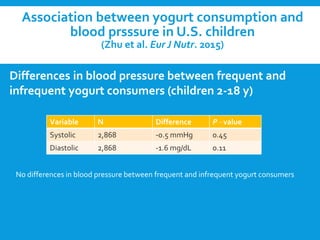
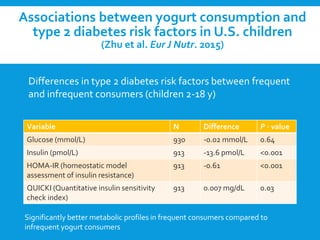
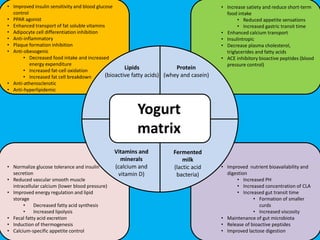
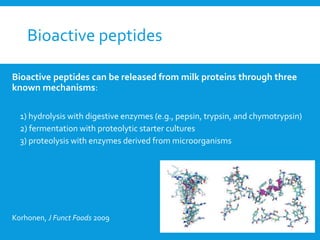
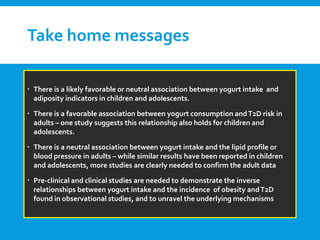
Is yogurt associated with reduced
cardiometabolic risk factors in children?
Dr André Marette
Laval Hospital, Heart and Lung Institute,
Institute for Nutrition and Functional Foods (INAF),
Université Laval
Québec, Canada
Is yogurt consumption associated with
reduced cardiometabolic risk in children
Divulgation of potential conflicts
Consultation and honorarium
• Danone Nutricia
• Thetis Pharma
• Valbiotis
Funding
• CIHR, CDA, HSFC, FRQ, CRIBIQ
• JA DeSève Fondation
• Pfizer (Chair CIHR/industry)
• Danone Nutricia
• Thetis Pharma
• Fédération des Producteurs Acéricoles du Québec
• Dairy Farmers of Canada
“Toxic” food and unhealthy lifestyle
Cardiometabolic diseases
 Diet-related diseases
 Prevalence of “severe”
obesity is increasing in
children
 Putting children at risk for
“adult” diseases
 Type 2 diabetes
 Dyslipidemia
 Hypertension
 Metabolic syndrome
 Preventable and manageable
 Healthy diet and lifestyle
behaviors learned in childhood
Kumar and Kelly (2017) Mayo Clinic Proceedings
What makes yogurt an interesting
research topic?
High quality
protein
growth and
maintenance
of muscle
mass
Source of Ca, vitamin D and P
 contribute to bone health
Nutrient rich food
profile  contributes to
intakes of essential
nutrients for health
Lipids and lactose 
energy source
Pairs well with other healthy foods  potential for
increased intake of fruits, vegetables and grains
Source of bioactive lipids
and peptides  di- and
tri-peptides, CLA, short-
and medium-chain fatty
acids that contribute to
protection against
cardiometabolic risk
factors
Live cultures improve
lactose tolerance,
increase concentrations
of some nutrients (eg.
CLA and bioactive
peptides)
Number of publications on “yogurt” indexed in
PubMed over the last 100 years
Total = 3296
Probiotic yogurt = 644
Yogurt consumption = 837
Yogurt and weight = 431
Yogurt and health = 897
Microbiota and yogurt = 92
Macronutrient profile of common yogurts
Children aged 4-6 y
Children aged 7-11 y
Percent contribution of 100 g of commonly
consumed yogurts to the reference nutrient
intakes for energy, fat, carbohydrates and
protein in children.
Based on the dietary reference values for children from
the British Nutrition Foundation and Public Health
EnglandComposition of foods integrated dataset
% RNI
% RNI
Melissa Fernandez, Mauro Fisberg, and André Marette
Chapter: Role of yogurt in the nutrition and health of children
and adolescents. In book entitled "Yogurt in Health and Disease
Prevention". Ed. Nagendra Shah, Elsevier 2017 In press
Yogurt’s contribution to the dietary
reference values for mineral and vitamin in
children and adolescents
• Excellent source of iodine,
vitamin B12, phosphorus,
calcium, riboflavin and
thiamin for children and
adolescents
• Source of folate, magnesium,
potassium and selenium
• Provides negligible amounts
of iron, niacin and vitamin B6
• Concentrated source of
nutrients for children
• Yogurt is an excellent vehicle
for vitamin D fortification
0
5
10
15
20
25
30
35
40
45
50
4-6 yo
7-10 yo
11-14 yo
15-18 yo
Based on the dietary reference values for children from the British Nutrition Foundation and
Public Health EnglandComposition of foods integrated dataset
% contribution of 100g
low-fat fruit yogurt
ISYOGURT CONSUMPTION ASSOCIATED
WITH BODY WEIGHT GAIN IN CHILDREN AND
ADOLESCENTS?
Long-term association between dairy consumption
and risk of childhood obesity: a systematic review
and meta-analysis of prospective cohort studies
(Lu et al. Eur. J. Clin. Nutr. 2016)
46 011 children and adolescents with an average 3-year follow-up
38% less likely to have
childhood overweight/obesity
the risk of overweight/obesity
was 13% lower with each
serving of dairy/day
Association between yogurt consumption and
adiposity indicators in children
(Zhu et al. Eur J Nutr. 2015)
Variable N Difference P - value
Body weight 4,370 -0.3 kg 0.65
BMI 4,342 0.1 kg/m2 0.64
Waist circumference 4,278 -0.2 cm 0.76
33%
67%
Frequency of yogurt consumption in a cohort of American
children 2-18 y (NHANES 2003 and 2006)
Frequent yogurt consumers
(at least once a week; median
= 2/week)
Infrequent yogurt consumers
(less than once a week;
median = 1-6/year)
No differences in
adiposity indicators
between frequent and
infrequent yogurt
consumers
Association between yogurt consumption and
obesity among U.S. Children aged 8–18 years
(Keast et al, Nutrients 2015)
Variable N Difference P - value
Body weight 3786 -1.7 kg NS
BMI 3786 -0.7 kg/m2 <0.05
Waist circumference 3786 -2.5 cm <0.05
8%
92%
Frequency of yogurt consumption in a cohort of American
children 8-18 y (NHANES 2005-2008)
Frequent yogurt consumers
(at least once out of 2 24-h
dietary recalls)
Non yogurt consumers (not at
all mentioned in 24 hour
dietary recalls)
Significantly lower BMI
and waist circumference
in yogurt consumers
compared to non-
consumers
ISYOGURT CONSUMPTION ASSOCIATED
WITH CARDIOMETABOLIC RISK FACTORS IN
CHILDREN AND ADOLESCENTS?
Systematic review of the associations between dairy
product consumption and risk of cardiometabolic
outcomes in the adult population
(Drouin-Chartier et al. Adv Nutr 2016)
Association between yogurt consumption and
the lipid profile in U.S. children
(Zhu et al. Eur J Nutr. 2015)
Variable N Difference P - value
Total cholesterol 3,272 -2.2 mg/dL 0.17
HDL cholesterol 3,272 -1.3 mg/dL 0.06
LDL cholesterol 1,265 -0.2 mg/dL 0.94
Triglycerides 1,266 -0.5 mg/dL 0.93
Non-HDL cholesterol 3,272 -0.9 mg/dL 0.58
Ratio of total cholesterol to HDL cholesterol 3,272 0.01 0.84
Differences in lipid profiles between frequent and
infrequent yogurt consumers (children 2-18 y)
No differences in the lipid profile between frequent and infrequent yogurt consumers
Association between yogurt consumption and
blood prsssure in U.S. children
(Zhu et al. Eur J Nutr. 2015)
Variable N Difference P - value
Systolic 2,868 -0.5 mmHg 0.45
Diastolic 2,868 -1.6 mg/dL 0.11
Differences in blood pressure between frequent and
infrequent yogurt consumers (children 2-18 y)
No differences in blood pressure between frequent and infrequent yogurt consumers
Associations between yogurt consumption and
type 2 diabetes risk factors in U.S. children
(Zhu et al. Eur J Nutr. 2015)
Variable N Difference P - value
Glucose (mmol/L) 930 -0.02 mmol/L 0.64
Insulin (pmol/L) 913 -13.6 pmol/L <0.001
HOMA-IR (homeostatic model
assessment of insulin resistance)
913 -0.61 <0.001
QUICKI (Quantitative insulin sensitivity
check index)
913 0.007 mg/dL 0.03
Differences in type 2 diabetes risk factors between frequent
and infrequent consumers (children 2-18 y)
Significantly better metabolic profiles in frequent consumers compared to
infrequent yogurt consumers
What could be driving these
associations?
• Increase satiety and reduce short-term
food intake
• Reduced appetite sensations
• Increased gastric transit time
• Enhanced calcium transport
• Insulintropic
• Decrease plasma cholesterol,
triglycerides and fatty acids
• ACE inhibitory bioactive peptides (blood
pressure control)
• Improved insulin sensitivity and blood glucose
control
• PPAR agonist
• Enhanced transport of fat soluble vitamins
• Adipocyte cell differentiation inhibition
• Anti-inflammatory
• Plaque formation inhibition
• Anti-obesogenic
• Decreased food intake and increased
energy expenditure
• Increased fat-cell oxidation
• Increased fat cell breakdown
• Anti-atherosclerotic
• Anti-hyperlipidemic
• Normalize glucose tolerance and insulin
secretion
• Reduced vascular smooth muscle
intracellular calcium (lower blood pressure)
• Improved energy regulation and lipid
storage
• Decreased fatty acid synthesis
• Increased lipolysis
• Fecal fatty acid excretion
• Induction of thermogenesis
• Calcium-specific appetite control
• Improved nutrient bioavailability and
digestion
• Increased PH
• Increased concentration of CLA
• Increased gut transit time
• Formation of smaller
curds
• Increased viscosity
• Maintenance of gut microbiota
• Release of bioactive peptides
• Improved lactose digestion
Vitamins and
minerals
(calcium and
vitamin D)
Protein
(whey and casein)
Fermented
milk
(lactic acid
bacteria)
Lipids
(bioactive fatty acids)
Yogurt
matrix
Bioactive peptides
Bioactive peptides can be released from milk proteins through three
known mechanisms:
1) hydrolysis with digestive enzymes (e.g., pepsin, trypsin, and chymotrypsin)
2) fermentation with proteolytic starter cultures
3) proteolysis with enzymes derived from microorganisms
Korhonen, J Funct Foods 2009
Intestinal transit and energy balance regulation
Amino acid/nutrient release and absorption
Regulation of the gut microbiota
Digestive system
Casein- and whey-derived bioactive peptides
• Anti-hypertensive byACE
inhibition
• Vasodilators release
• Anti-thrombotic
Vascular system
• Macrophages stimulation
• Proliferation and maturation
of immune cells
• Metabolic endotoxemia
Immune system
• Sympathetic nervous
activity and energy
expenditure
• Gut-brain axis and
satiety signals
Nervous system
• Anticholesterolemic
• Insulin sensitivity and
glucose tolerance
• Gut-liver axis and lipid
metabolism
Metabolic system
• Obesity
• Type 2 Diabetes
• Cardiovascular diseases
• NAFLD
Fight against cardiometabolic diseases
Fernandez et al. (review under revision)
Bioactive peptides
BIOACTIVE LIPIDS
 CLA
 PPAR activator (Parodi 2016)
 Anti-diabetic (Ryder et al. 2001)
 Anti-obesogenic (Ryder et al. 2001)
 Short chain fatty acids (butyric acid) (Gao et al. 2009)
 Increased insulin sensitivity
 Increased thermogenic activity
 Medium-chain fatty acids
 Anti-diabetic (Wein et al. 2009)
Yogurt ferments
 Release bioactive molecules (Fernandez et al. 2015)
 Conjugated linoleic acid (CLA)
 Bioactive peptides
 Exopolysaccharides
 Enhanced digestion (Pei et al 2015 and Allen et al. 1982)
 Improved lactose tolerance
 Low pH of yogurt – ideal for mineral absorption
 Lactic acid bacteria (Pessione et al. 2012)
 Antagonist behavior with other bacteria
 Favors healthy gut microbiota
 Increase concentrations of fermentable oligosaccharides
 Prebiotic action on the gut microbiota
Take home messages
 There is a likely favorable or neutral association between yogurt intake and
adiposity indicators in children and adolescents.
 There is a favorable association between yogurt consumption andT2D risk in
adults – one study suggests this relationship also holds for children and
adolescents.
 There is a neutral association between yogurt intake and the lipid profile or
blood pressure in adults – while similar results have been reported in children
and adolescents, more studies are clearly needed to confirm the adult data
 Pre-clinical and clinical studies are needed to demonstrate the inverse
relationships between yogurt intake and the incidence of obesity andT2D
found in observational studies, and to unravel the underlying mechanisms
Acknowledgments
Mélissa Fernandez
Éliane Picard-Deland
Noémie Daniel
Angelo Tremblay
Shirin Panahi
Mauro Fisberg
Thank you !
andre.marette@criucpq.ulaval.ca
Quebec city, October 2017 !
Prof. André Marette YINI Symposium N&G 2017 amsterdam

Prof. André Marette YINI Symposium N&G 2017 amsterdam

  • 1.
    Is yogurt associatedwith reduced cardiometabolic risk factors in children? Dr André Marette Laval Hospital, Heart and Lung Institute, Institute for Nutrition and Functional Foods (INAF), Université Laval Québec, Canada Is yogurt consumption associated with reduced cardiometabolic risk in children
  • 2.
    Divulgation of potentialconflicts Consultation and honorarium • Danone Nutricia • Thetis Pharma • Valbiotis Funding • CIHR, CDA, HSFC, FRQ, CRIBIQ • JA DeSève Fondation • Pfizer (Chair CIHR/industry) • Danone Nutricia • Thetis Pharma • Fédération des Producteurs Acéricoles du Québec • Dairy Farmers of Canada
  • 3.
    “Toxic” food andunhealthy lifestyle
  • 4.
    Cardiometabolic diseases  Diet-relateddiseases  Prevalence of “severe” obesity is increasing in children  Putting children at risk for “adult” diseases  Type 2 diabetes  Dyslipidemia  Hypertension  Metabolic syndrome  Preventable and manageable  Healthy diet and lifestyle behaviors learned in childhood Kumar and Kelly (2017) Mayo Clinic Proceedings
  • 5.
    What makes yogurtan interesting research topic? High quality protein growth and maintenance of muscle mass Source of Ca, vitamin D and P  contribute to bone health Nutrient rich food profile  contributes to intakes of essential nutrients for health Lipids and lactose  energy source Pairs well with other healthy foods  potential for increased intake of fruits, vegetables and grains Source of bioactive lipids and peptides  di- and tri-peptides, CLA, short- and medium-chain fatty acids that contribute to protection against cardiometabolic risk factors Live cultures improve lactose tolerance, increase concentrations of some nutrients (eg. CLA and bioactive peptides)
  • 6.
    Number of publicationson “yogurt” indexed in PubMed over the last 100 years Total = 3296 Probiotic yogurt = 644 Yogurt consumption = 837 Yogurt and weight = 431 Yogurt and health = 897 Microbiota and yogurt = 92
  • 7.
    Macronutrient profile ofcommon yogurts Children aged 4-6 y Children aged 7-11 y Percent contribution of 100 g of commonly consumed yogurts to the reference nutrient intakes for energy, fat, carbohydrates and protein in children. Based on the dietary reference values for children from the British Nutrition Foundation and Public Health EnglandComposition of foods integrated dataset % RNI % RNI Melissa Fernandez, Mauro Fisberg, and André Marette Chapter: Role of yogurt in the nutrition and health of children and adolescents. In book entitled "Yogurt in Health and Disease Prevention". Ed. Nagendra Shah, Elsevier 2017 In press
  • 8.
    Yogurt’s contribution tothe dietary reference values for mineral and vitamin in children and adolescents • Excellent source of iodine, vitamin B12, phosphorus, calcium, riboflavin and thiamin for children and adolescents • Source of folate, magnesium, potassium and selenium • Provides negligible amounts of iron, niacin and vitamin B6 • Concentrated source of nutrients for children • Yogurt is an excellent vehicle for vitamin D fortification 0 5 10 15 20 25 30 35 40 45 50 4-6 yo 7-10 yo 11-14 yo 15-18 yo Based on the dietary reference values for children from the British Nutrition Foundation and Public Health EnglandComposition of foods integrated dataset % contribution of 100g low-fat fruit yogurt
  • 9.
    ISYOGURT CONSUMPTION ASSOCIATED WITHBODY WEIGHT GAIN IN CHILDREN AND ADOLESCENTS?
  • 10.
    Long-term association betweendairy consumption and risk of childhood obesity: a systematic review and meta-analysis of prospective cohort studies (Lu et al. Eur. J. Clin. Nutr. 2016) 46 011 children and adolescents with an average 3-year follow-up 38% less likely to have childhood overweight/obesity the risk of overweight/obesity was 13% lower with each serving of dairy/day
  • 11.
    Association between yogurtconsumption and adiposity indicators in children (Zhu et al. Eur J Nutr. 2015) Variable N Difference P - value Body weight 4,370 -0.3 kg 0.65 BMI 4,342 0.1 kg/m2 0.64 Waist circumference 4,278 -0.2 cm 0.76 33% 67% Frequency of yogurt consumption in a cohort of American children 2-18 y (NHANES 2003 and 2006) Frequent yogurt consumers (at least once a week; median = 2/week) Infrequent yogurt consumers (less than once a week; median = 1-6/year) No differences in adiposity indicators between frequent and infrequent yogurt consumers
  • 12.
    Association between yogurtconsumption and obesity among U.S. Children aged 8–18 years (Keast et al, Nutrients 2015) Variable N Difference P - value Body weight 3786 -1.7 kg NS BMI 3786 -0.7 kg/m2 <0.05 Waist circumference 3786 -2.5 cm <0.05 8% 92% Frequency of yogurt consumption in a cohort of American children 8-18 y (NHANES 2005-2008) Frequent yogurt consumers (at least once out of 2 24-h dietary recalls) Non yogurt consumers (not at all mentioned in 24 hour dietary recalls) Significantly lower BMI and waist circumference in yogurt consumers compared to non- consumers
  • 13.
    ISYOGURT CONSUMPTION ASSOCIATED WITHCARDIOMETABOLIC RISK FACTORS IN CHILDREN AND ADOLESCENTS?
  • 14.
    Systematic review ofthe associations between dairy product consumption and risk of cardiometabolic outcomes in the adult population (Drouin-Chartier et al. Adv Nutr 2016)
  • 15.
    Association between yogurtconsumption and the lipid profile in U.S. children (Zhu et al. Eur J Nutr. 2015) Variable N Difference P - value Total cholesterol 3,272 -2.2 mg/dL 0.17 HDL cholesterol 3,272 -1.3 mg/dL 0.06 LDL cholesterol 1,265 -0.2 mg/dL 0.94 Triglycerides 1,266 -0.5 mg/dL 0.93 Non-HDL cholesterol 3,272 -0.9 mg/dL 0.58 Ratio of total cholesterol to HDL cholesterol 3,272 0.01 0.84 Differences in lipid profiles between frequent and infrequent yogurt consumers (children 2-18 y) No differences in the lipid profile between frequent and infrequent yogurt consumers
  • 16.
    Association between yogurtconsumption and blood prsssure in U.S. children (Zhu et al. Eur J Nutr. 2015) Variable N Difference P - value Systolic 2,868 -0.5 mmHg 0.45 Diastolic 2,868 -1.6 mg/dL 0.11 Differences in blood pressure between frequent and infrequent yogurt consumers (children 2-18 y) No differences in blood pressure between frequent and infrequent yogurt consumers
  • 17.
    Associations between yogurtconsumption and type 2 diabetes risk factors in U.S. children (Zhu et al. Eur J Nutr. 2015) Variable N Difference P - value Glucose (mmol/L) 930 -0.02 mmol/L 0.64 Insulin (pmol/L) 913 -13.6 pmol/L <0.001 HOMA-IR (homeostatic model assessment of insulin resistance) 913 -0.61 <0.001 QUICKI (Quantitative insulin sensitivity check index) 913 0.007 mg/dL 0.03 Differences in type 2 diabetes risk factors between frequent and infrequent consumers (children 2-18 y) Significantly better metabolic profiles in frequent consumers compared to infrequent yogurt consumers
  • 18.
    What could bedriving these associations?
  • 19.
    • Increase satietyand reduce short-term food intake • Reduced appetite sensations • Increased gastric transit time • Enhanced calcium transport • Insulintropic • Decrease plasma cholesterol, triglycerides and fatty acids • ACE inhibitory bioactive peptides (blood pressure control) • Improved insulin sensitivity and blood glucose control • PPAR agonist • Enhanced transport of fat soluble vitamins • Adipocyte cell differentiation inhibition • Anti-inflammatory • Plaque formation inhibition • Anti-obesogenic • Decreased food intake and increased energy expenditure • Increased fat-cell oxidation • Increased fat cell breakdown • Anti-atherosclerotic • Anti-hyperlipidemic • Normalize glucose tolerance and insulin secretion • Reduced vascular smooth muscle intracellular calcium (lower blood pressure) • Improved energy regulation and lipid storage • Decreased fatty acid synthesis • Increased lipolysis • Fecal fatty acid excretion • Induction of thermogenesis • Calcium-specific appetite control • Improved nutrient bioavailability and digestion • Increased PH • Increased concentration of CLA • Increased gut transit time • Formation of smaller curds • Increased viscosity • Maintenance of gut microbiota • Release of bioactive peptides • Improved lactose digestion Vitamins and minerals (calcium and vitamin D) Protein (whey and casein) Fermented milk (lactic acid bacteria) Lipids (bioactive fatty acids) Yogurt matrix
  • 20.
    Bioactive peptides Bioactive peptidescan be released from milk proteins through three known mechanisms: 1) hydrolysis with digestive enzymes (e.g., pepsin, trypsin, and chymotrypsin) 2) fermentation with proteolytic starter cultures 3) proteolysis with enzymes derived from microorganisms Korhonen, J Funct Foods 2009
  • 21.
    Intestinal transit andenergy balance regulation Amino acid/nutrient release and absorption Regulation of the gut microbiota Digestive system Casein- and whey-derived bioactive peptides • Anti-hypertensive byACE inhibition • Vasodilators release • Anti-thrombotic Vascular system • Macrophages stimulation • Proliferation and maturation of immune cells • Metabolic endotoxemia Immune system • Sympathetic nervous activity and energy expenditure • Gut-brain axis and satiety signals Nervous system • Anticholesterolemic • Insulin sensitivity and glucose tolerance • Gut-liver axis and lipid metabolism Metabolic system • Obesity • Type 2 Diabetes • Cardiovascular diseases • NAFLD Fight against cardiometabolic diseases Fernandez et al. (review under revision) Bioactive peptides
  • 22.
    BIOACTIVE LIPIDS  CLA PPAR activator (Parodi 2016)  Anti-diabetic (Ryder et al. 2001)  Anti-obesogenic (Ryder et al. 2001)  Short chain fatty acids (butyric acid) (Gao et al. 2009)  Increased insulin sensitivity  Increased thermogenic activity  Medium-chain fatty acids  Anti-diabetic (Wein et al. 2009)
  • 23.
    Yogurt ferments  Releasebioactive molecules (Fernandez et al. 2015)  Conjugated linoleic acid (CLA)  Bioactive peptides  Exopolysaccharides  Enhanced digestion (Pei et al 2015 and Allen et al. 1982)  Improved lactose tolerance  Low pH of yogurt – ideal for mineral absorption  Lactic acid bacteria (Pessione et al. 2012)  Antagonist behavior with other bacteria  Favors healthy gut microbiota  Increase concentrations of fermentable oligosaccharides  Prebiotic action on the gut microbiota
  • 24.
    Take home messages There is a likely favorable or neutral association between yogurt intake and adiposity indicators in children and adolescents.  There is a favorable association between yogurt consumption andT2D risk in adults – one study suggests this relationship also holds for children and adolescents.  There is a neutral association between yogurt intake and the lipid profile or blood pressure in adults – while similar results have been reported in children and adolescents, more studies are clearly needed to confirm the adult data  Pre-clinical and clinical studies are needed to demonstrate the inverse relationships between yogurt intake and the incidence of obesity andT2D found in observational studies, and to unravel the underlying mechanisms
  • 26.
    Acknowledgments Mélissa Fernandez Éliane Picard-Deland NoémieDaniel Angelo Tremblay Shirin Panahi Mauro Fisberg
  • 27.

Editor's Notes

  • #7 Why study yogurt? Increasing number of publications on yogurt, especially over the last 10 years.
  • #8 * The reference nutrient intake for fat is based on the upper range of recommended intake (35% of calories consumed). ** The reference nutrient intake for protein is based on minimum requirements for growth, development and lean muscle maintenance (g/kg of weight depending on age). Based on the dietary reference values for children from the British Nutrition Foundation (British Nutrition Foundation 2015) and Public Health England Composition of foods integrated dataset (Public Health England 2015)
  • #9 Figure 2. Percent contribution of 100 g of low-fat fruit yogurt to the mineral and vitamin requirements of children and adolescents 4-6 y, 7-10 y, 11-14 and 15-18 y. Reference values for each age group are average values of both sexes and each year in the age group. Based on the dietary reference values for children from the British Nutrition Foundation (British Nutrition Foundation 2015) and Public Health England Composition of foods integrated dataset (Public Health England 2015)
  • #11 Ten studies comprising 46 011 children and adolescents with an average 3-year follow-up were included. As compared with those who were in the lowest group of dairy consumption, children in the highest intake group were 38% less likely to have childhood overweight/obesity (pooled odds ratio (OR) = 0.62; 95% confidence interval (CI): 0.49, 0.80). With each 1 serving/day increment in dairy consumption, the percentage of body fat was reduced by 0.65% (β = 0.65; 95% CI: − 1.35, 0.06; P = 0.07), and the risk of overweight/obesity was 13% lower (OR = 0.87; 95% CI: 0.74, 0.98).
  • #12 Neutral associations adjusting for age, gender, race, income-to-poverty ratio, physical activity level, energy intake, and HEI-2005 total score
  • #13 Favorable associations even with low intake Model 2 covariates include energy (kcal) intake, gender, years of age, race-ethnicity, poverty income level, physical activity level, TV/video/computer use (h/day), alcohol use (days/year), and tobacco use in last 5 days (yes/no); 1. Difference between Zhu (FFQ) and Keast (2 x 24-hour recalls) 2. Zhu compares infrequent to frequent consumers, whereas Keast compares non-consumers to consumers. A subtle difference, but given the already low intake in this population, it might be significant enough for differences to be seen despite the same population. 3. Yogurt intake in the US is on the rise and might be slightly greater from 2005-2008 (Keast) compared to 2003-2006 (Zhu)               There might be too much variation in Zhu because of the wider age band 2-18 y whereas Keast is a little bit more narrow 8-19 y. This underlies the importance of looking at multiple studies and never relying on a single epidemiological study to draw general conclusions
  • #16 Focus on the minimal intake of yogurt in this population. Results may be different in populations with greater or more consistent intake.
  • #17 Focus on the minimal intake of yogurt in this population. Results may be different in populations with greater or more consistent intake.
  • #22 Figure needs to be adjusted