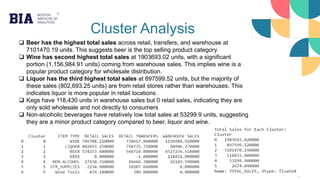
The document presents a product cluster analysis aimed at optimizing inventory management in the retail and wholesale distribution sector, specifically by grouping similar products based on sales patterns. Key findings include high demand for beer and wine products, significant seasonal sales fluctuations, and a focus on tailored promotional strategies for different product clusters. The analysis employs k-means clustering and identifies six distinct clusters, providing actionable insights for inventory optimization and marketing strategies.


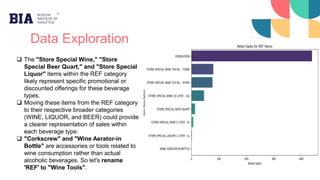
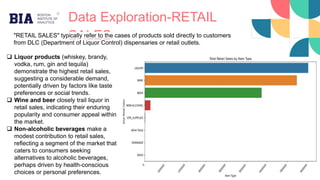


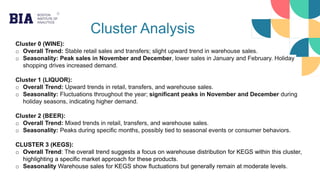
![Cluster Analysis
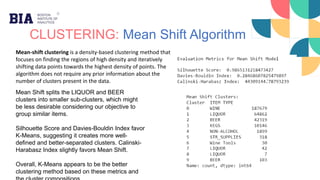
Clusters where the total sales are among the
top 25%, include cluster 0 [WINE] and cluster
2 [BEER] indicating high demand.
This insight is valuable for inventory
management, marketing strategies, and product
planning, as businesses can focus on stocking
and promoting beer and wine products to
capitalize on their popularity among consumers.
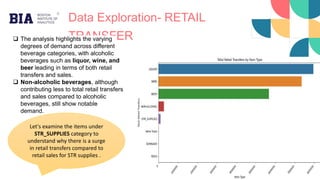
Let’s analyze seasonal decomposition plots for
RETAIL SALES, RETAIL TRANSFERS, and
WAREHOUSE SALES to understand seasonal
effects and overall trends in each cluster. These
insights will help us grasp the nuances driving our
sales patterns, aiding better decision-making and
strategy.](https://image.slidesharecdn.com/capstoneprojectproductclusteranalysisakshitharai-240626121102-65966915/85/Product-Cluster-Analysis-Unveiling-Hidden-Customer-Preferences-28-320.jpg)