Producir conocimiento espacial - Sesión teórica 2
•
0 likes•317 views

La cartografía como soporte: experiencias recientes de lectura del territorio al servicio de la investigación y de procesos de toma de decisiones

Recommended
Recommended
More Related Content
Similar to Producir conocimiento espacial - Sesión teórica 2
Similar to Producir conocimiento espacial - Sesión teórica 2 (20)
More from Instituto Universitario de Urbanística
More from Instituto Universitario de Urbanística (20)
Recently uploaded
Recently uploaded (20)
Producir conocimiento espacial - Sesión teórica 2
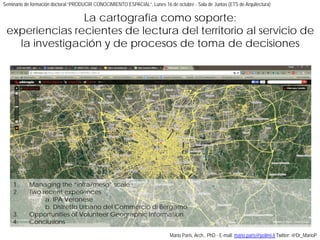
- 1. 1. Managing the “infra/meso” scale 2. Two recent experiences a. IPA Veronese b. Distretto Urbano del Commercio di Bergamo 3. Opportunities of Volunteer Geographic Information 4. Conclusions Mario Paris, Arch., PhD - E-mail: mario.paris@polimi.it Twitter: @Dr_MarioP La cartografía como soporte: experiencias recientes de lectura del territorio al servicio de la investigación y de procesos de toma de decisiones Seminario de formación doctoral “PRODUCIR CONOCIMIENTO ESPACIAL”, Lunes 16 de octubre - Sala de Juntas (ETS de Arquitectura)
- 2. From metropolitan areas to metropolistaed territories: M. Paris, 2015 End of antitheses (Centre/Periphery, Rural/Urban, etc.)? Activation of a fragmentated and complex urban-rural space 1.
- 3. How to manage the ‘infra’-scale? Dealing with vast-area, metropolitan scale, sub-municipal areas and urban districts out of current statistical model (NUTs)
- 4. 2. Two recent experiences: Regione Veneto and Lombardia (I)
- 6. 2.a. The IPA Veronese: a process of discovering and re-cognition (I) “After provinces: how to managing the vast area?” Italian Law 56/2014 (also called “Riforma Delrio”) Provinces as a second level bodies Strategies/Challanges Facing common problems Producing/Sharing knowledge A demand form Municipalities A work in collaboration with:
- 7. Regione del Veneto – Intesa Programmatica d’Area (D.G.R. 2796/2006) “Con le IPA, la Regione offre la possibilità agli Enti pubblici locali (Province, Comuni, Comunità montane) e alle Parti economiche e sociali di partecipare alla programmazione regionale, attraverso la definizione di accordi e la formulazione di proposte finalizzate allo sviluppo economico‐sociale di aree territoriali subregionali. Le Intese Programmatiche d’Area (IPA) pertanto non sono e non devono essere nuove istituzioni che si aggiungono e sovrappongono a quelle esistenti, ma momenti di concertazione, a cui partecipano i rappresentanti dei soggetti pubblici delle parti economiche e sociali, con funzione di analisi del territorio e di proposta in ordine alle azioni di sviluppo che si rilevano come prioritarie per l'area territoriale". D.G.R. n. 2796 del 12 settembre 2006. Si tratta della deliberazione che disciplina le Intese Programmatiche d’Area in applicazione dell’art. 25 della LR35/2001. The IPA as a figure A voluntary role of municipalities (bottom-up) Working on strategies and projects
- 8. Which municipalities? Verona Metropolitan Area. PTRC Regione del Veneto (1992), Sistema insediativo (Extract) 1992
- 9. Which municipalities? Verso il nuovo PTRC (2007) Tav. 05 Sviluppo economico, ricettivo, turistico e rurale (Extract) 2007
- 10. Framing the space of analysis: the central strip of Verona Province in the Region Area Vasta Veronese within the Regione del Veneto (Mario Paris, 2015)
- 11. 52 Municiaplities 1.650 km2 (50% former Provincia di Verona, 9% of the Region) 720.000 inhabitants (80% of the inhabitants of the whole Provincia, 14% of the Region) Area Vasta Veronese within the Provincia di Verona (Mario Paris, 2015) Framing the space of analysis: the central strip of Verona Province in the Region
- 12. Existing Planning Tools Area Vasta Veronese: existing planning tools (Mario Paris, 2015)
- 13. Towards a recognition: Variation of the population (2003/2013, Data ISTAT) 1992 2003 2013 Variazione 1992-2013 Totale popolazione nell'ambito dell'Area Vasta Veronese 615.831 661.391 720.373 +104.542 (+14,5%) Numero abitanti - unità Unità Comune di Verona 255.824 256.110 253.409 -2.415 Comuni fino a 10.000 abitanti 171.542 248.116 293.909 +122.367 Comuni da 10.000 e 5.000 abitanti 118.452 106.214 126.692 +8.240 Comuni con meno di 5.000 abitanti 70.013 50.951 46.426 -23.587 Numero abitanti - % % Comune di Verona 41,5 38,7 35,2 -6,4 Comuni fino a 10.000 abitanti 27,9 37,5 40,8 +12,9 Comuni da 10.000 e 5.000 abitanti 19,2 16,1 17,6 -1,6 Comuni con meno di 5.000 abitanti 11,4 7,7 6,4 -4,9
- 14. The policentric pattern of the metropolitan area Area Vasta Veronese: A polinuclear pattern (Mario Paris, 2015)
- 15. A process of metropolization (Indovina, 2007) Area Vasta Veronese: growing population (Mario Paris, 2015)
- 16. Central Strip – Discovering the character of the metropolitan area Area Vasta Veronese: desnity of the popiulation (Mario Paris, 2015)
- 17. Central Strip – Discovering the character of the metropolitan area Area Vasta Veronese: commuting flows (Mario Paris, 2015)
- 18. Central Strip – Solid vast management Area Vasta Veronese: Solid vast management (Mario Paris, 2015)
- 19. Central Strip – Tourism Area Vasta Veronese: Territorial vocations (Mario Paris, 2015)
- 20. Central Strip – Territorial vocations Area Vasta Veronese: Territorial vocations (Mario Paris, 2015)
- 21. By inhabitants Identifying an area marked by processes of mature metropolisation (Indovina, 2007) By politicians, civil servants and technicians Developing a road map, based on shared targets and strategies Defining a common metholodology to support active policies By Regional Government and Institutions Regione del Veneto, through a specific act Central Strip – Three recognitions From a territorial framework to a think-thank Defining a starting partnership of municipalities
- 22. Partnership Municipalities: Verona (capofila) Bussolengo S. Martino Buon Albergo Buttapietra Sona Castel d’Azzano S. Pietro in Cariano Castelnuovo del Garda Sommacampagna Lazise Valeggio sul Mincio Pastrengo Zevio Pescantina Other institutional stakeholders: Camera di Commercio IAA di Verona Apindustria Casartigiani Dipartimento di Informatica dell’Università degli Studi di Verona
- 23. IPA Veronese: A cohesive and homogeneous territorial system 14 Municipalites, 632 km2 (3,5% of Regione Veneto) 419.615 inhabitants (8,5% of regional population)
- 24. IPA Veronese: density of population (inhab./km2, ISTAT 2014)
- 25. Area Population 2014 (Istat) Area (Km2) Density 2014 (ab./km2) Italia 60.813.907 301.340 202 Regione Veneto 4.926.818 18.407 268 Provincia di Verona 907.352 3.096 293 Fascia centrale della Provincia di Verona 720.373 1.665 432 IPA Veronese 419.675 632 664,8 IPA Veronese: density of population (inhab./km2, ISTAT 2014)
- 26. IPA Veronese: Density – Companies (LU/km2, Camera di Commercio, 2014)
- 27. Area Population 2013 (Istat) Area (Km2) Local Units Local Units Density UL/ab. UL/Km2 Italia 60.813.907 301.340 7.221.476 0,12 23,96 Regione Veneto 4.926.818 18.407 594.169 0,12 32,28 Provincia di Verona 907.352 3.096 114.815 0,13 37,08 Fascia centrale della provincia di Verona 720.373 1.665 40.351 0,06 24,23 IPA Veronese 419.675 632 52.240 0,12 82,66 IPA Veronese: Density – Companies (LU/km2, Camera di Commercio, 2014)
- 28. IPA Veronese: Territorial Vocations (Camera di Commercio, 2014)
- 29. IPA Veronese: Aims IPA Veronese should be a driver for the innovation of processes of local developement, which acts as think-thank, which builds shared strategic scenarios, able to orienting future actions Issues: - Tourism - Agricolture - Urban regenerations (public and private heritage) - Etc. Methodology: - Sharing a vision for an vast area - Collecting ongoing local projects (topic, development and founds) - Connecting up strategies and local projects - Supporting the work of partners
- 30. IPA Veronese Actions Segreteria tecnica IPA’s Area Implemented proposals/Projects Opportunities Partners IPA Resources Partners IPA Region / EU Portfolio/ Projects agenda Features Potentials Proposals Scenarios/Strategies Information Proposals IPA Veronese: How it works Needs Resources
- 31. IPA Veronese – Setting up actions, assesting results and performances Area Vasta Veronese: The RFSC framework (Mario Paris, 2015) Reference Framework for European Sustainable Cities – RFSC
- 33. Research framework within Urb&Com Lab. (DAStU-PoliMI) Since 1998, a deregulation strategy in retail sector generated an overlay of different processes: - horizontal and vertical competition (spontaneous and planned poles) - process of modernization of urban retail - Inertia of urban retail systems - raising of retail poles/superplaces - Innovative formats After the 2008 crisis: - Role of e-commerce - Experience economy and Sharing economy - Shrinkage of retail sector RQs. Which impacts of the competition? Is this process just erasing the traditional urban retail? Aims. Exploring the current evolution of urban retail systems affected by the competition with planned sub- urban poles and/or other spontaneous aggregates. Focusing on the characteristics of abandoned retail spaces
- 34. How to map a multi-level retail system? Geography of spontaneous poles (retail and integrated urban economic activities) Mapping urban retail systems: Traditional retail (corner shops) Horeca Artisans and craftmans Leisure OfficesDensity of urban economic activities. (Data: ISTAT 2001 and 2011, elaborated by Limonta, 2016)
- 35. 2. How to map a multi-level retail system? Geography of planned poles Different typologies (dimension, mix, specialization) Geografia delle polarità commerciali pianificate: strutture di vendita organizzate in forma unitaria esistenti e autorizzate (inquadramento regionale). (Limonta, 2016)
- 36. Spatial knowledge as a support for public action (strategies, policies and actions) Maps as a tool to support public actors Regional Retail Observatory Opendata Italian National Institute of Statistics Opendata «Shopping relevant» activites dynamics (2001 – 2011) Small size stores dynamics (2008-2011) Big and Medium size store database Local retail system dynamics map Regional Retail polarities map (220 items) Catchment areas overlapping map Urban retail systems map These kinds of analysis should change of scale and achieve a different degree of precision.
- 37. Lombardy as testing ground Milan and a system of medium cities (Bergamo, Brescia, Monza, etc.) Density of population and activities Processes of mature metropolization Interest of retail companies Vibrancy for economy and retail (two scales)Population density Shopping Centres by region
- 38. Catchment areas overlapping map Current situation
- 39. Competition for catchment areas and market saturation Catchment areas overlapping map Future scenario
- 40. Local retail system dynamics map
- 41. Potential fragility of Urban retail system map Urban retail fragility Local retail system dynamic Catchment areas overlapping Very high Desertification Very high Desertification High Desertification Medium High Desertification Low Desertification Very Low Medium high Balance Very high Balance High Substitution Very high Medium Substitution High Balance Medium Strengthening Very high Medium low Balance Low Balance Very Low Substitution Medium Low Substitution Low Substitution Very Low Strengthening High Very Low Strengthening Medium Strengthening Low Strengthening Very Low
- 42. Potential fragility of Urban retail system map Urban retail fragility Local retail system dynamic Catchment areas overlapping Very high Desertification Very high Desertification High Desertification Medium High Desertification Low Desertification Very Low Medium high Balance Very high Balance High Substitution Very high Medium Substitution High Balance Medium Strengthening Very high Medium low Balance Low Balance Very Low Substitution Medium Low Substitution Low Substitution Very Low Strengthening High Very Low Strengthening Medium Strengthening Low Strengthening Very Low Current situation
- 43. Potential fragility of Urban retail system map Urban retail fragility Local retail system dynamic Catchment areas overlapping Very high Desertification Very high Desertification High Desertification Medium High Desertification Low Desertification Very Low Medium high Balance Very high Balance High Substitution Very high Medium Substitution High Balance Medium Strengthening Very high Medium low Balance Low Balance Very Low Substitution Medium Low Substitution Low Substitution Very Low Strengthening High Very Low Strengthening Medium Strengthening Low Strengthening Very Low Future scenario
- 44. How urban retail systems react? The example of the DUC Bergamo Changing scale: facing local dynamics Sensing and mapping urban retail systems Testing and comparing trends through a spatial reading A potential role for TCM associations
- 45. An extended survey Producing «spatial knowledge» (Paris & Limonta, 2016a)
- 46. Strengthening Attractiveness for users and investors High streets Role of urban quality Innovative formats Retail
- 47. Strengthening Integrated offers Leisure, tourism and culture Real estate market Cafés, Bars and Restaurants
- 48. Desertification Lack of vibrancy and urban life How to regenerate? Role of public actor Closed activities, disused shops
- 50. Substitution Role of artisans and craftsman Promoting alternative spinnerets Craftsman activities
- 51. Substitution Towards an advanced cultural districts? New vocations for the city New entrepreneurships (migrants) Offices and tertiary activities
- 52. Substitution Towards an advanced cultural districts? New vocations for the city New entrepreneurships (migrants) Migrant entrepreneurs
- 53. OPPORTUNITIES Producing spatial knowledge to support: Public actors (Strategies, policies, actions and regulation) Private investors (innovation and reinforcement) Relevance of this approach
- 55. Institutional Opendata (Istat, Public Agencies, etc.) • Transversal • Administrative scales (municipal, provincial, regional) • Quantitative But we found some critical aspects: • Low spatial information (most of institutional opendata are simple databases) • Low geographic detail (due to the geocoding process used to define the spatial information) • “Meso”/Intermediate scales (districts, basins)? • Updates? • Shopping-relevant activities (craftsman, horeca, ICC)? They are not enough! We look for “other kinds” of data Involving geographical information in research and applied research
- 56. A definition Volunteered Geographic Information (VGI) are georeferenced informations coming from collaborative mapping projects that represent the set of geographic information generated and shared by a community of users (Goodchild M., 2007). The main projects include: •OpenStreetMap (OSM) •Wikimapia •Google Maps (unitl march of 2016 was Google map maker). VGI (Volunteered Geographic Information)
- 57. Volunteered Geographic Information Institutional map (Geographic DB) Continouos updates Periodic updates (5-10 years) Uneven and not completed updates Transversal and completed updates Variable attribute structure Fixed attribute structure Not uniform structure data Uniform structure information data Mapping done by volunteers Mapping done by specialized companies Not uniform cartographic detail Uniform cartographic detail A comparison
- 58. Produsers (producers and users at the same time) - Engagement (from your research/survey/field-work to an open data) - Precision/Vandalism: the quality of the information - A common language A platform/ecosystem - License for information (Odbl) - Acquiring, Enriching and Sharing knowledge Not only single users (the role of institutions) - Producing useful data (Link) - Towards a cooperative protocol An active (or activated?) community
- 59. Obsolescence of information Contributors enrich the information (es. Accessibility) 2 febbraio 2016 - via Zambonate 2 maggio 2016 - via Zambonate Exceeding obsolescence
- 60. VGI data (as the OSM ones) are used by APPs and APIs (MAP.ME, OsmAnd, etc.) Re-use of information
- 61. Reading ongoing phenomena, evaluating public policies (benchmark) Screening and observatories
- 62. Periodic reports OpenStreetMap Comune di Bergamo (SIT e Ufficio Commercio) Institutional data about the Opening/dismatling of local shops Collection data (from Comune, and stakeholders) Distretto Urbano del Commercio DUC Stakeholders (Shop tenants and Local associations) Alerts and advices to DUC Edit information Edit information Contributors (OSM Local community) Towards a circular process/ cooperative protocol
- 63. A demo-pilot: DUC di Bergamo February 2016 Survey – I phase May 2016 upload - caricamento della mappatura delle attività su OSM relativamente all’ambito del DUC “Centro”; June 2016 Survey – II phase July 2016 Workshop with local stakeholders February 2017 Definition of a protocol with Comune di Bergamo (SIT e Ufficio Commercio) and DUC Survey Febbraio 2016 Giugno 2016 2.413 activities Upload on OpenStreetMap OSM as Opendata ? Towards a circular protocol
- 64. OpenStreetMap Comunity or tourists Changeset: 58 changes authors: 16 (3 experts) ew openings: 4 Towards a circular protocol
- 65. 4. Conclusions
- 66. With creativity, engagement and effort, I produced an original spatial knowledge. So what?
- 67. Why should I give around my work (for free)??? As researcher - Responsibility (compare with Google maps policy) - Sharing knowledge/dissemination As expert/urban planner - Raw data available - Updating information - Creating benchmark