Download to read offline
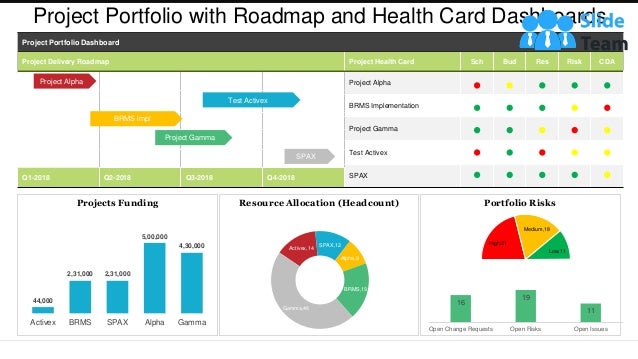

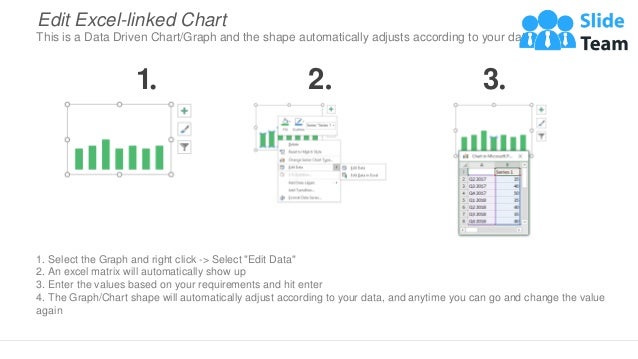
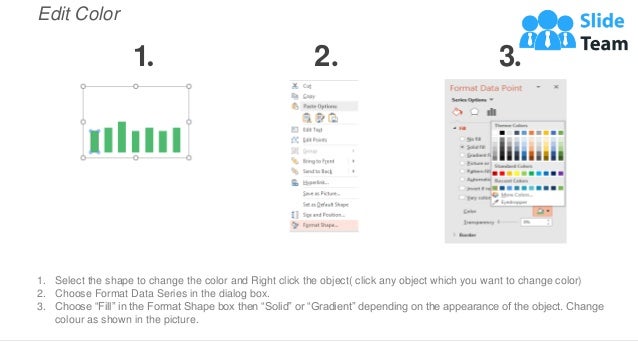


The document outlines the structure of project portfolio management, including funding allocation, risk assessment, and project delivery tracking through dashboards. It includes instructions for editing linked Excel charts and graphic elements in PowerPoint presentations. Additionally, it highlights the flexibility of modifying visuals and icons to enhance the presentation's design.


