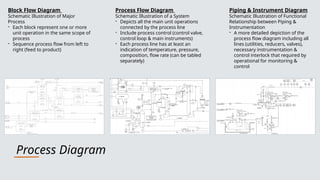
Process Diagram
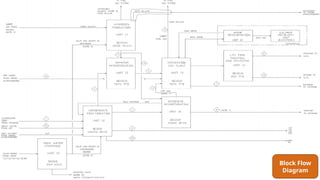
Block FlowDiagram
Schematic Illustration of Major
Process
- Each block represent one or more
unit operation in the same scope of
process
- Sequence process flow from left to
right (feed to product)
Process Flow Diagram
Schematic Illustration of a System
- Depicts all the main unit operations
connected by the process line
- Include process control (control valve,
control loop & main instruments)
- Each process line has at least an
indication of temperature, pressure,
composition, flow rate (can be tabled
separately)
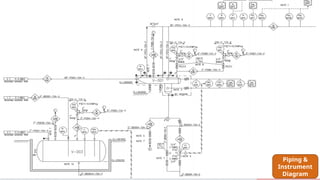
Piping & Instrument Diagram
Schematic Illustration of Functional
Relationship between Piping &
Instrumentation
- A more detailed depiction of the
process flow diagram including all
lines (utilities, reducers, valves),
necessary instrumentation &
control interlock that required by
operational for monitoring &
control
6.
Pictorial Representation
in ProcessFlow Diagram
• On the detailed flowsheets used for design & operation, the equipment is normally drawn in a
stylized pictorial form
• There are several international standards for PFD symbols
• ISO 10628 is the international standard for PFD drawing symbols
• British Standard (BS 1553 1997) : “Graphical Symbols for General Engineering Part 1 Piping System &
Plant” are more typical of those in common use
• For special equipment, some licensor uses their own symbols
ISO 10628
BS 1553
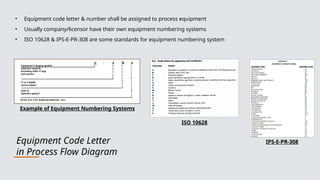
7.
Equipment Code Letter
inProcess Flow Diagram
• Equipment code letter & number shall be assigned to process equipment
• Usually company/licensor have their own equipment numbering systems
• ISO 10628 & IPS-E-PR-308 are some standards for equipment numbering system
Example of Equipment Numbering Systems
ISO 10628
IPS-E-PR-308
8.
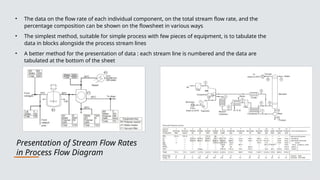
Presentation of StreamFlow Rates
in Process Flow Diagram
• The data on the flow rate of each individual component, on the total stream flow rate, and the
percentage composition can be shown on the flowsheet in various ways
• The simplest method, suitable for simple process with few pieces of equipment, is to tabulate the
data in blocks alongside the process stream lines
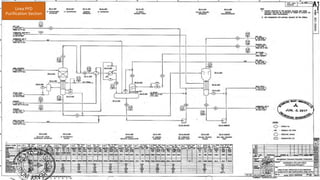
• A better method for the presentation of data : each stream line is numbered and the data are
tabulated at the bottom of the sheet
9.
Information to beIncluded
in Process Flow Diagram
• Essential Information
1. Stream composition, either the flow rate of each individual component or the stream
composition as a weight fraction
2. Total stream flow rate
3. Stream temperature
4. Nominal operating pressure (the required operating pressure)
5. Stream enthalpy
• Optional Information
1. Molar percentage composition and/or molar flow rate
2. Physical property data, mean values for the stream (such as density, viscosity, etc)
3. Stream name, a brief, one- or two- word description of the nature of the stream (for example
“Acetone Column Bottoms”)
10.
Reaksi Pembentukan Urea
PemekatanUrea Solution
Pemurnian Urea dan
Dekomposisi
Karbamat
PABRIK UREA
Pemurnian Air Proses
dengan Pemisahan Gas
Reaktan
Pembentukan Urea Prill /
Granul
Pembentukan Karbamat
dan Recycle Reaktan
GRANULATION
RECOVERY
PURIFCATION
CONCENTRATION WWT
SYNTHESIS