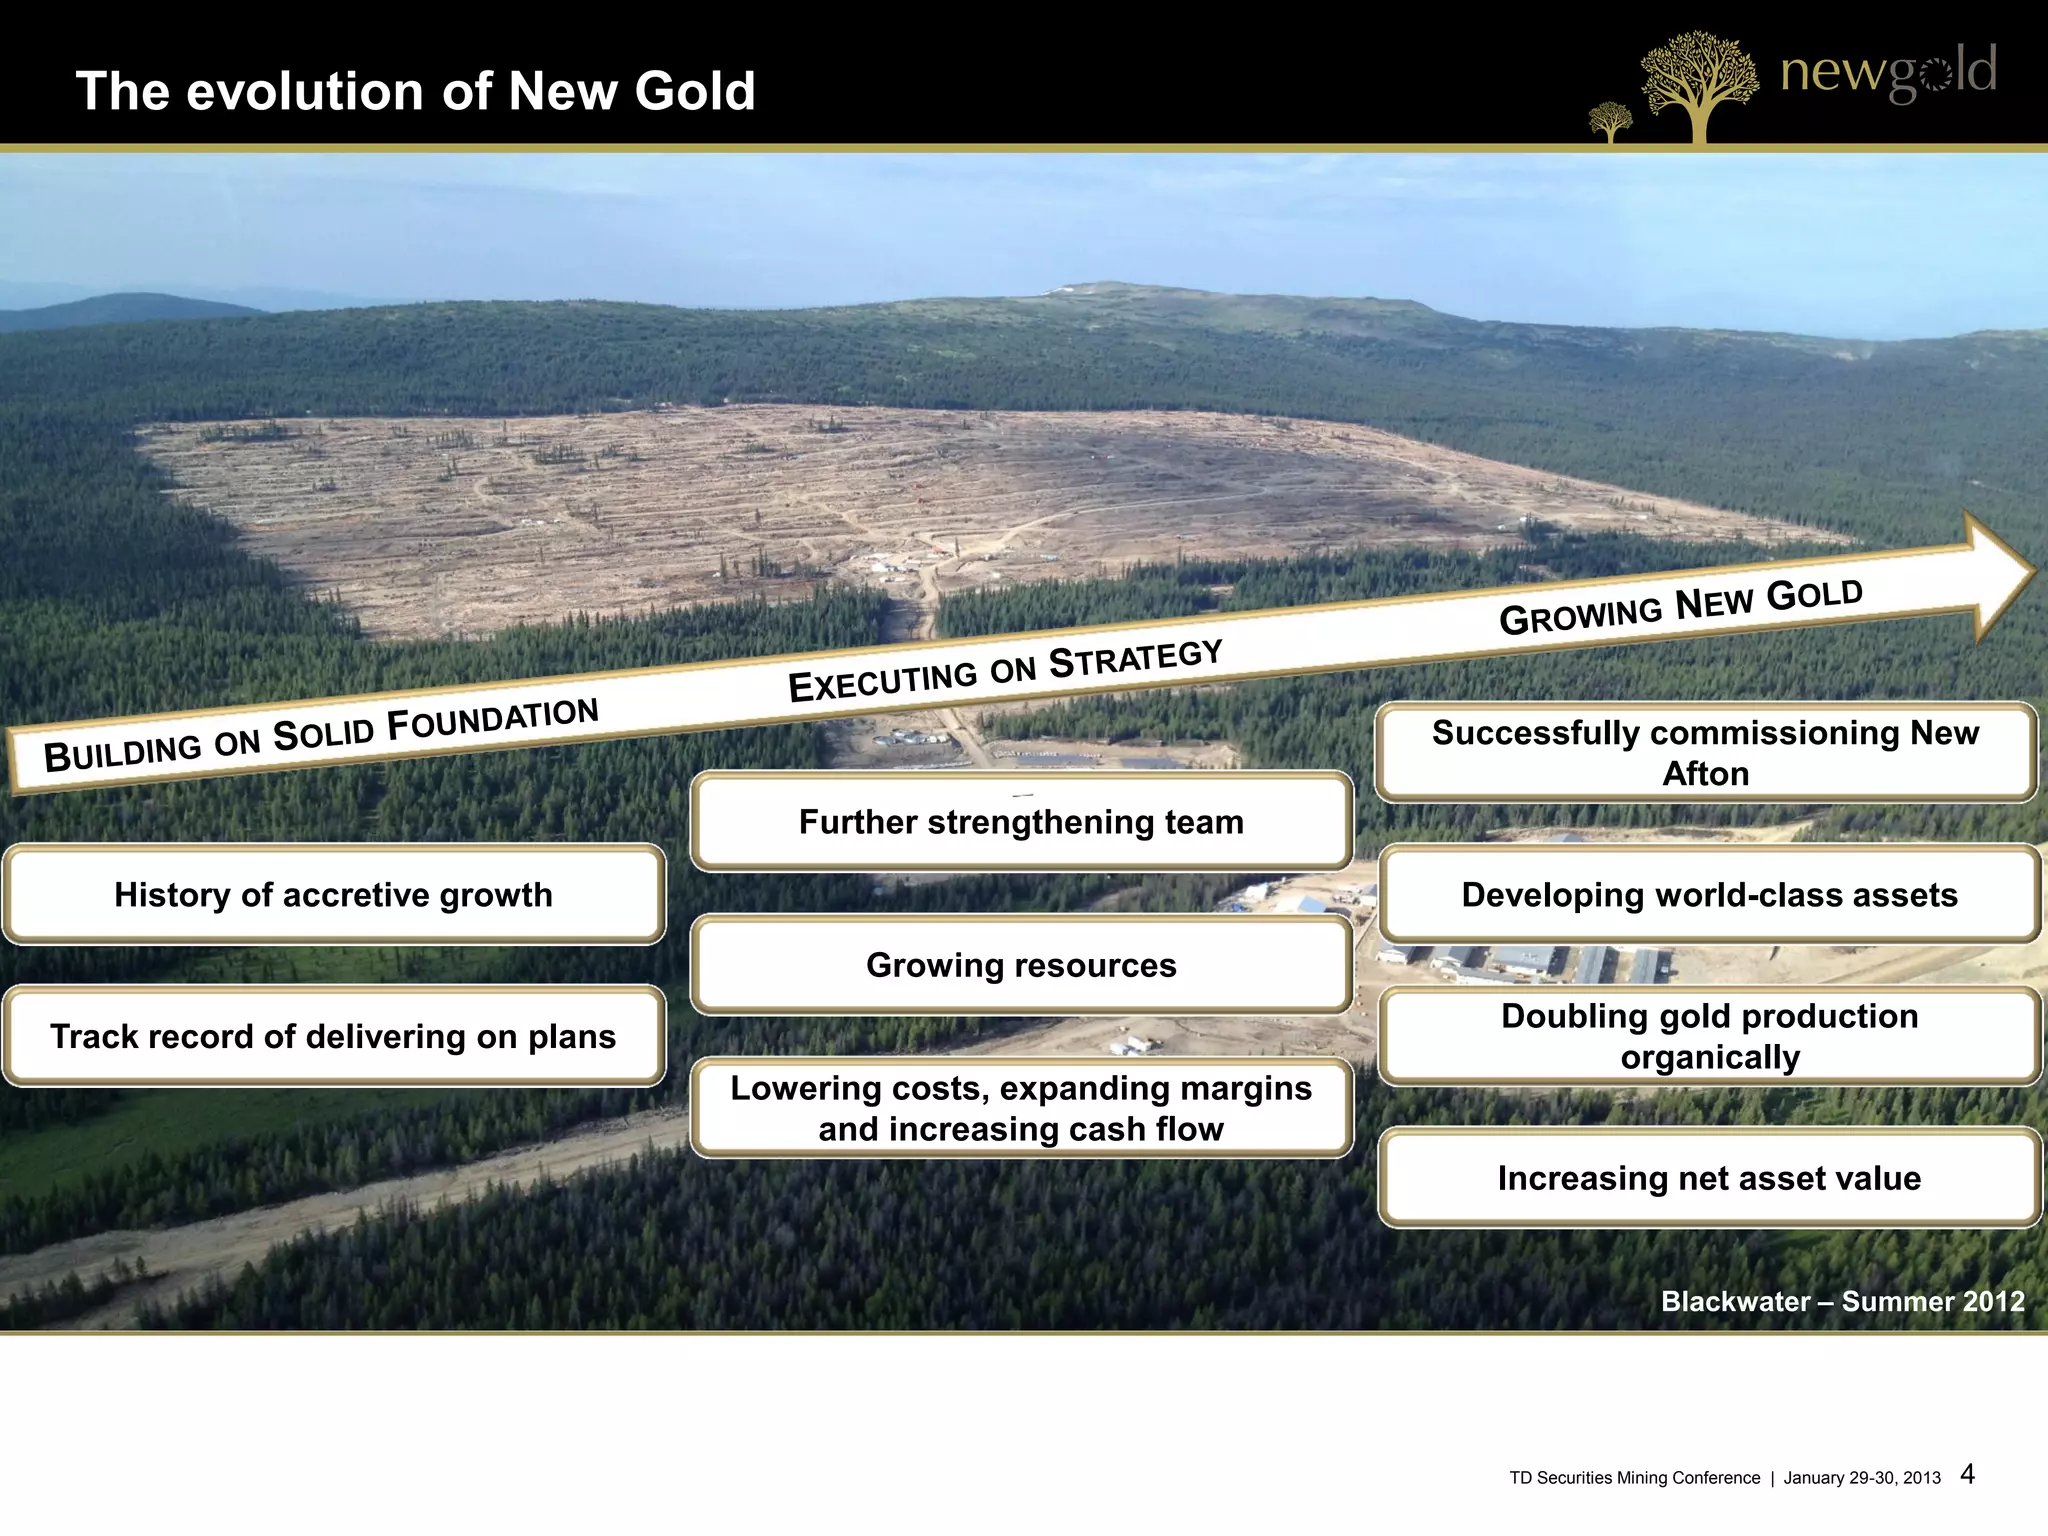
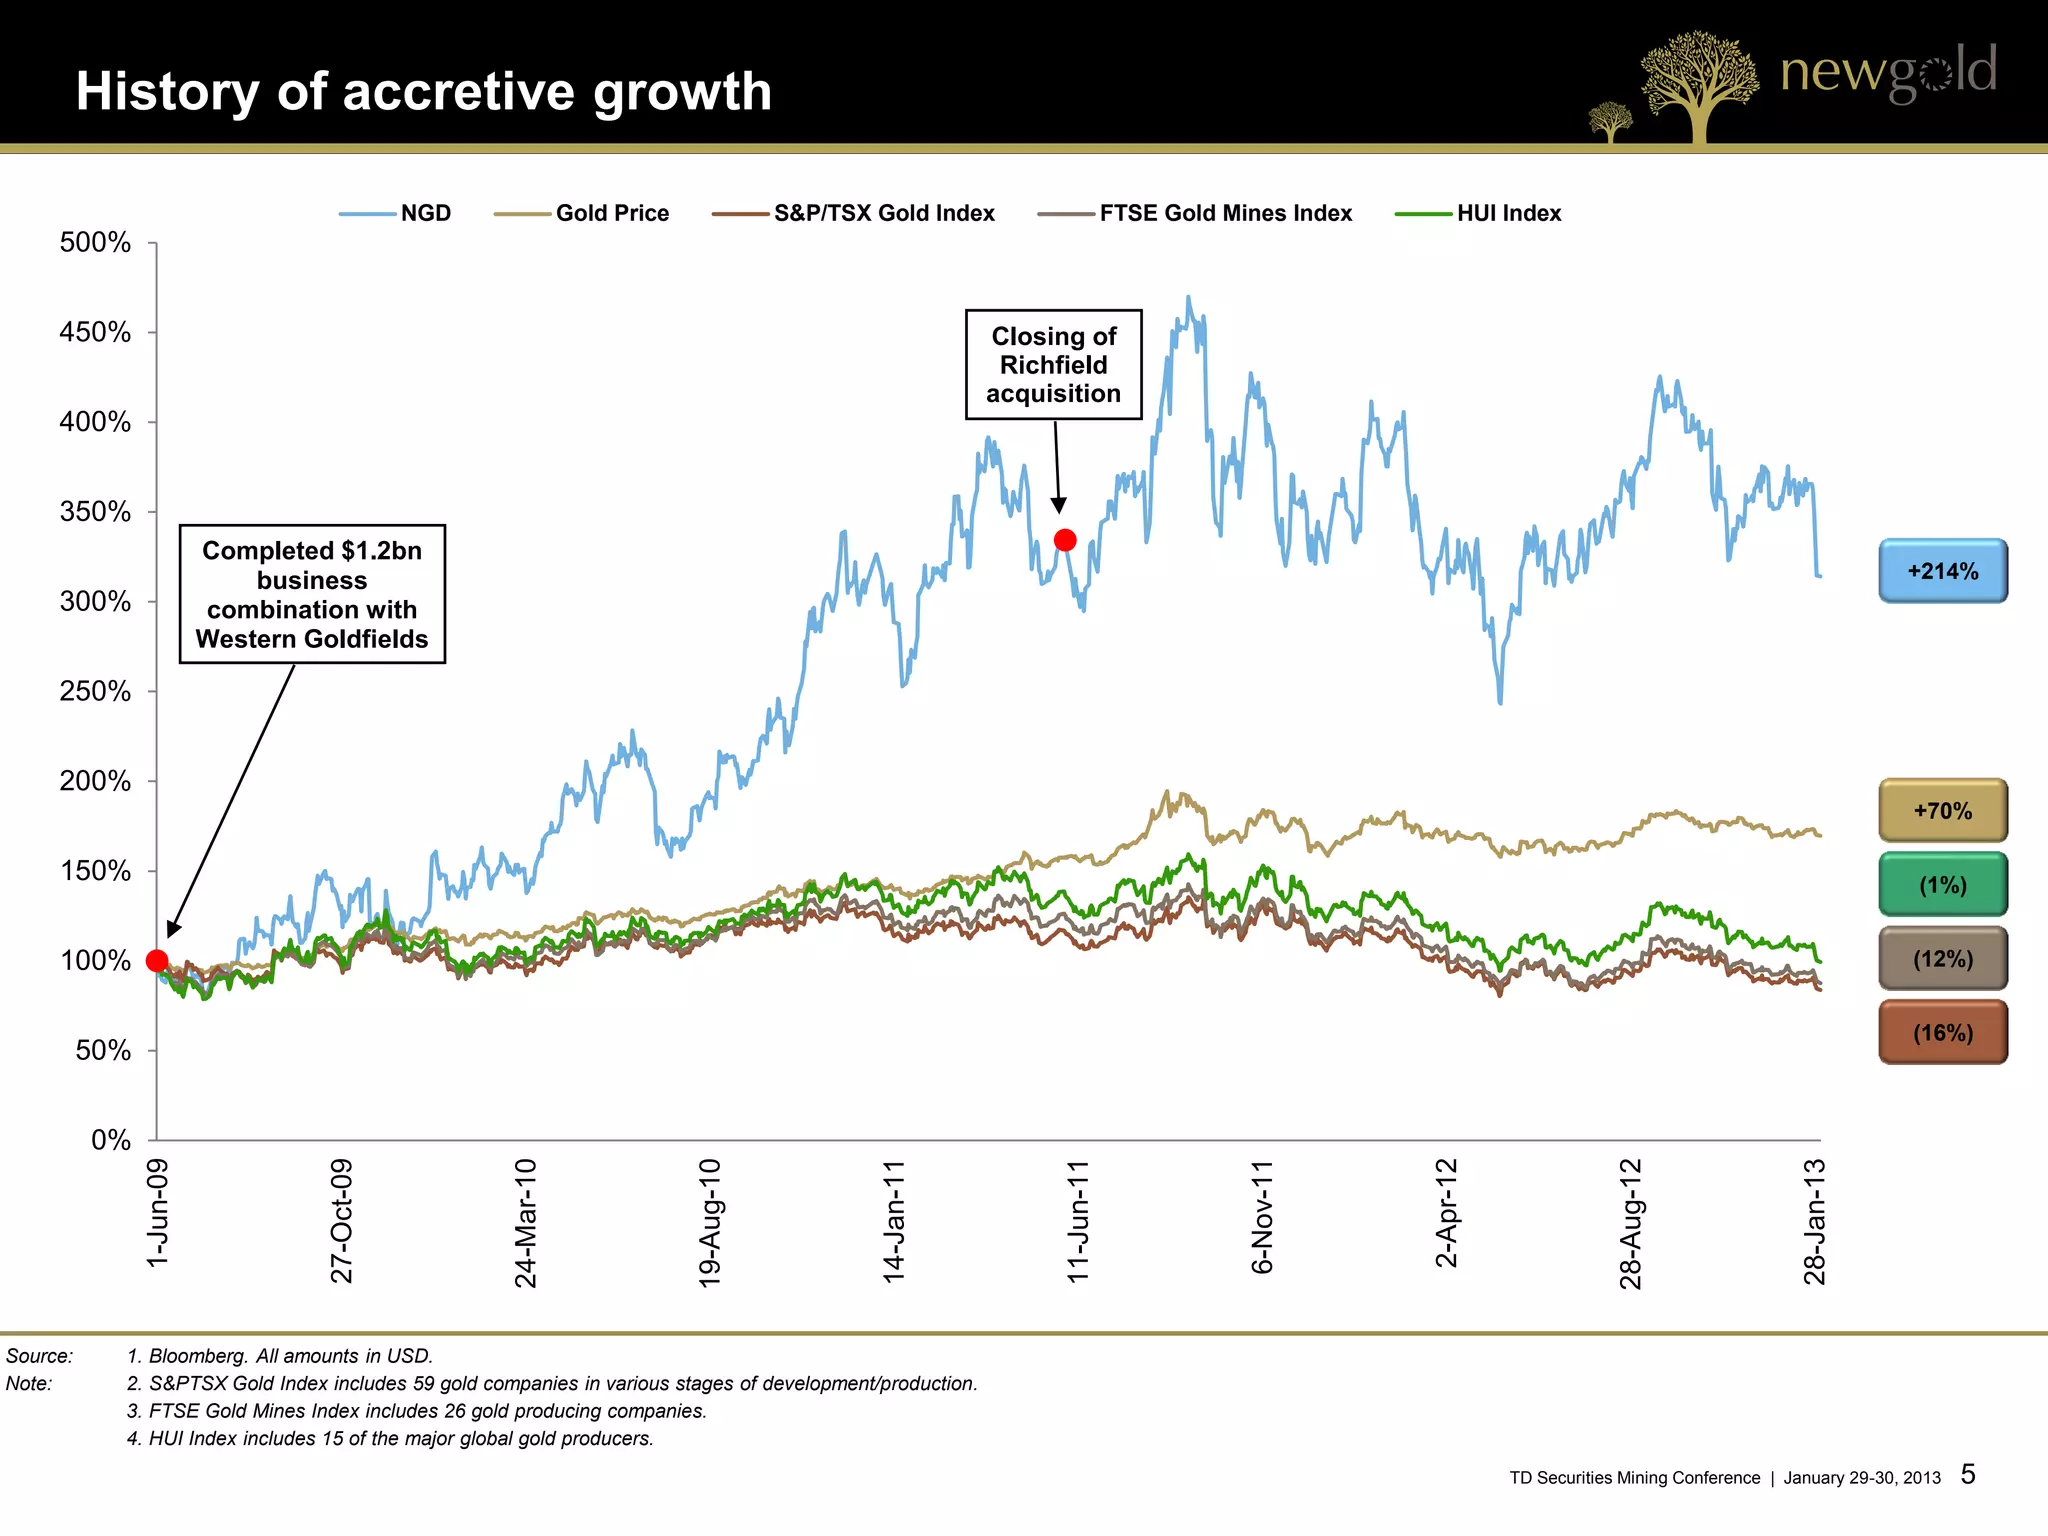
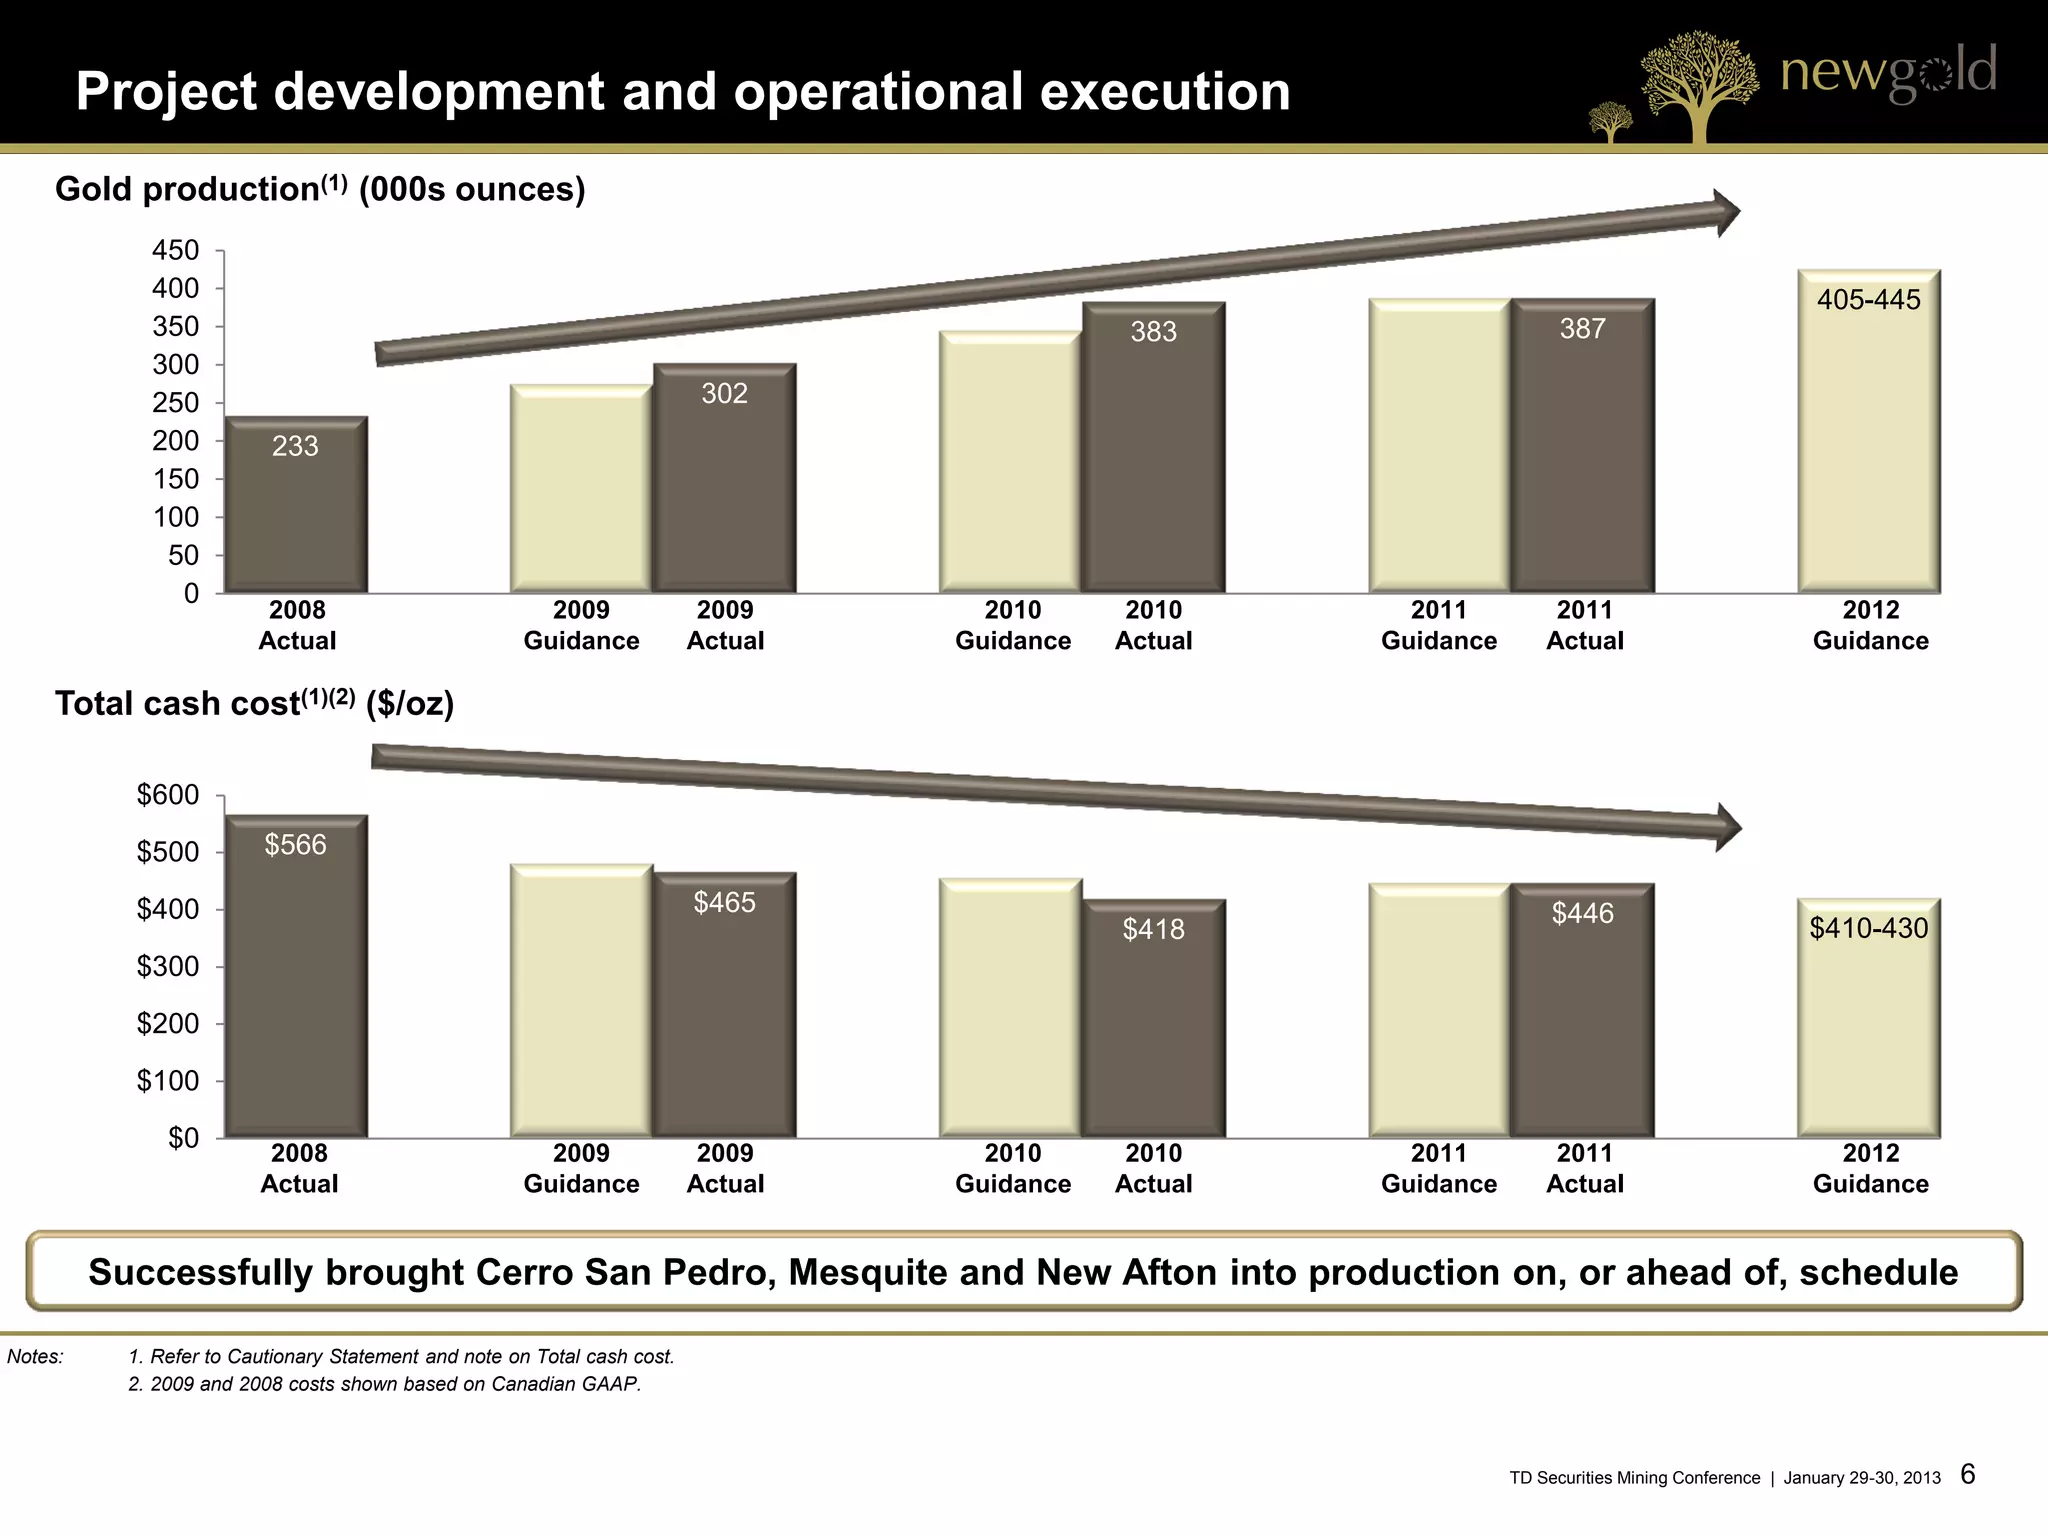
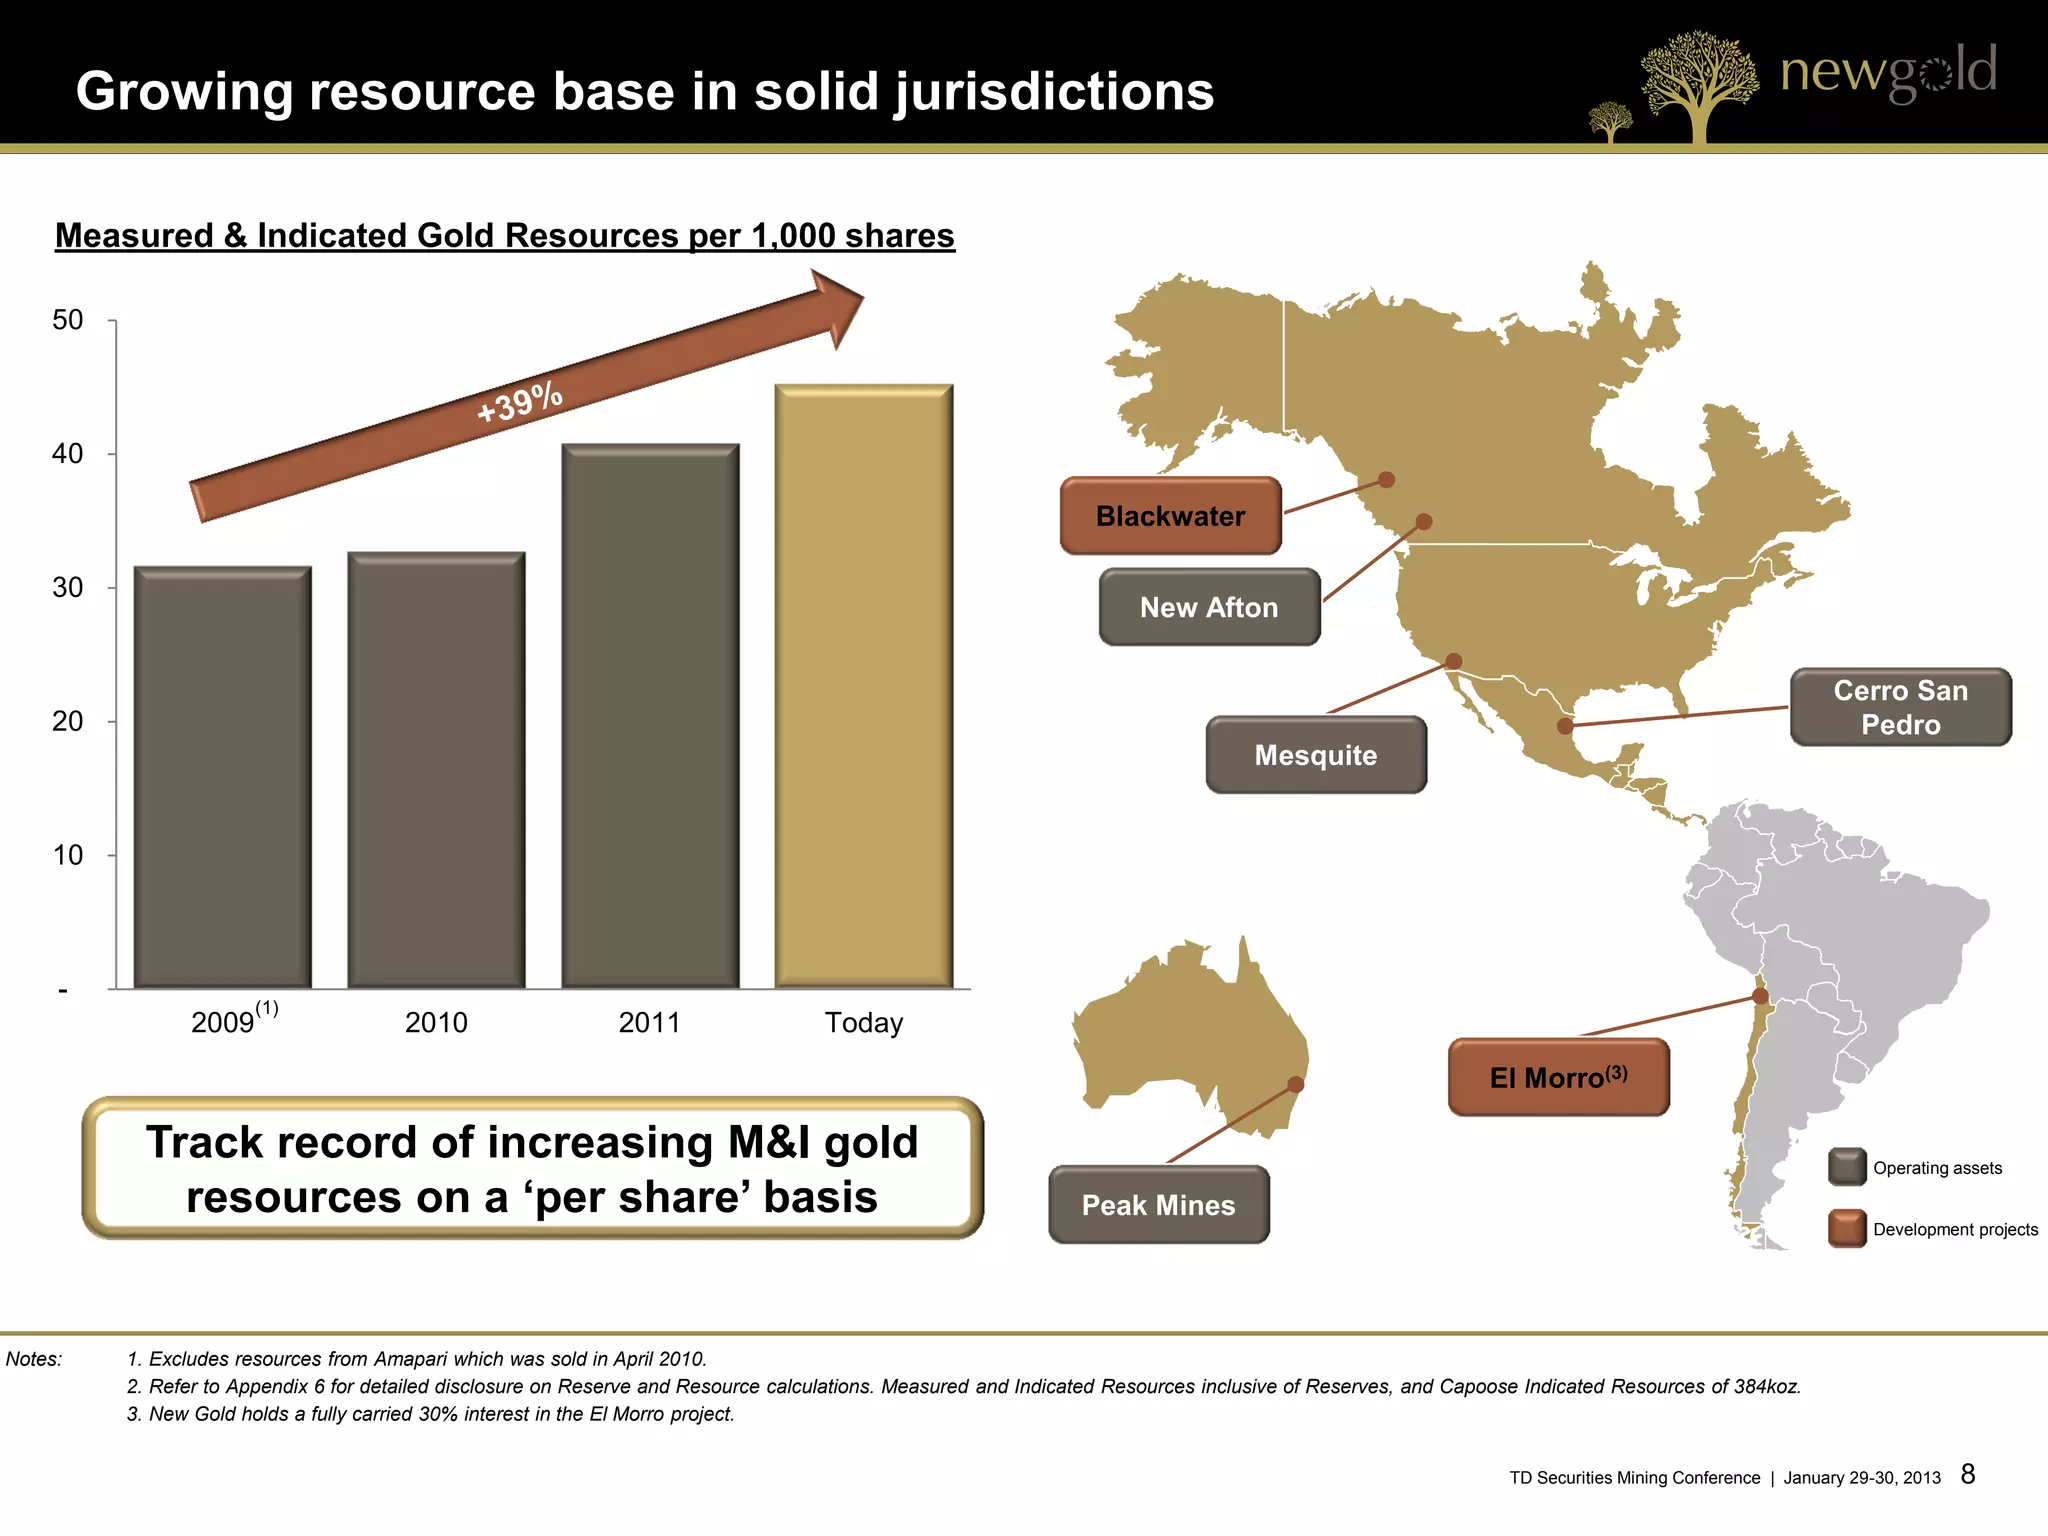
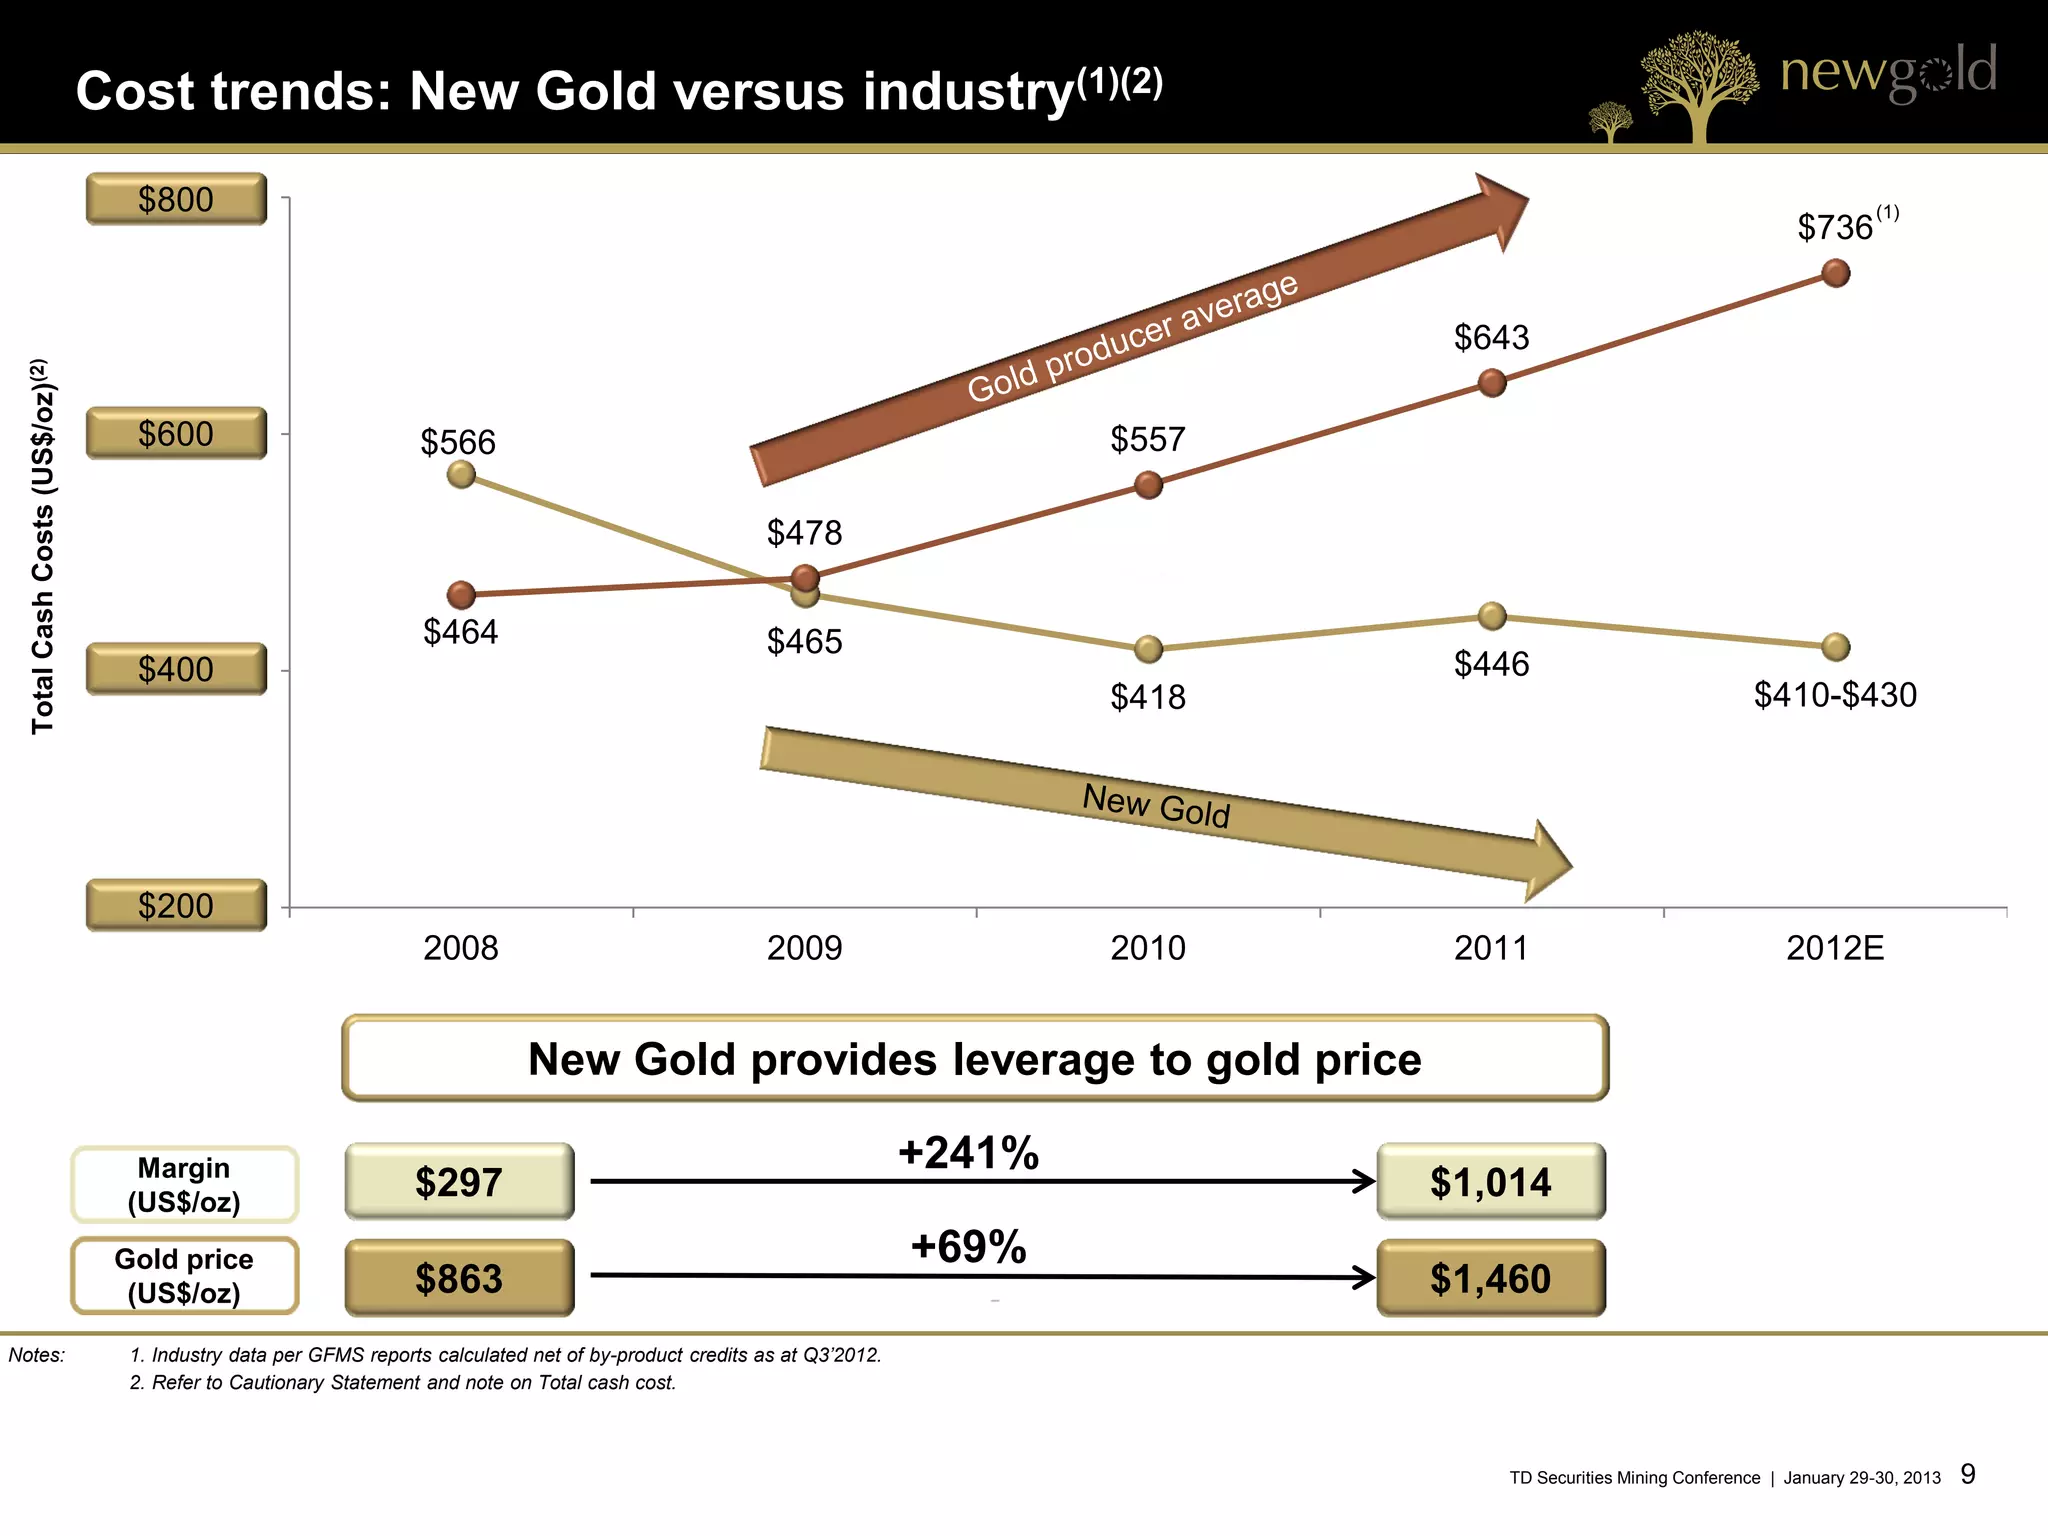
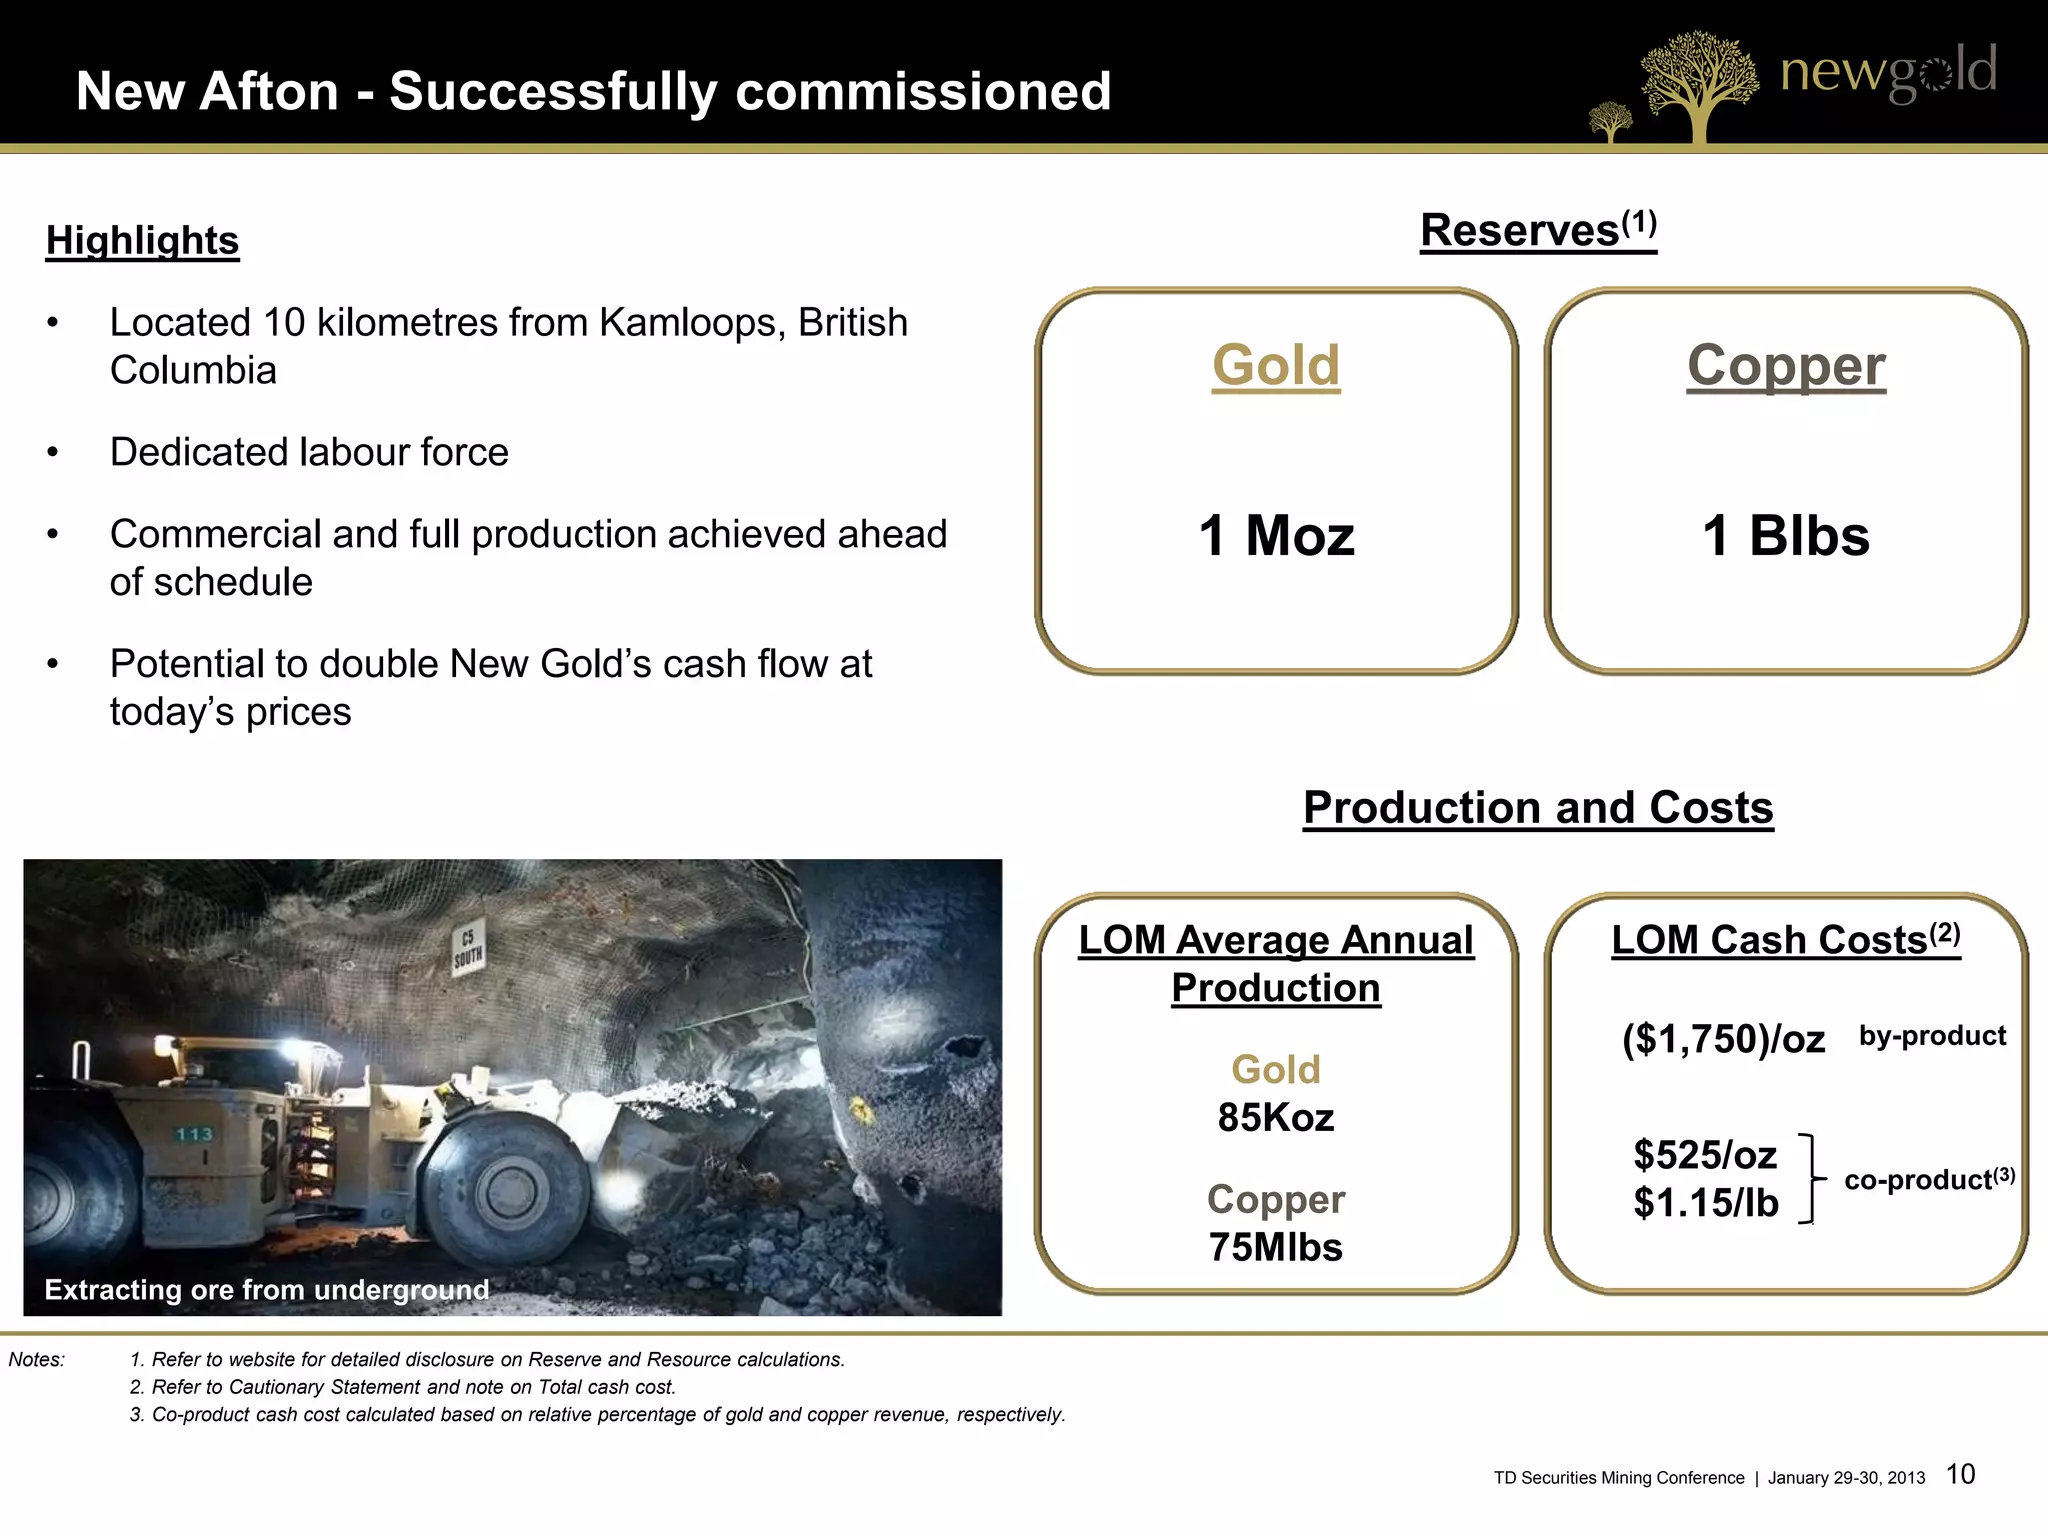
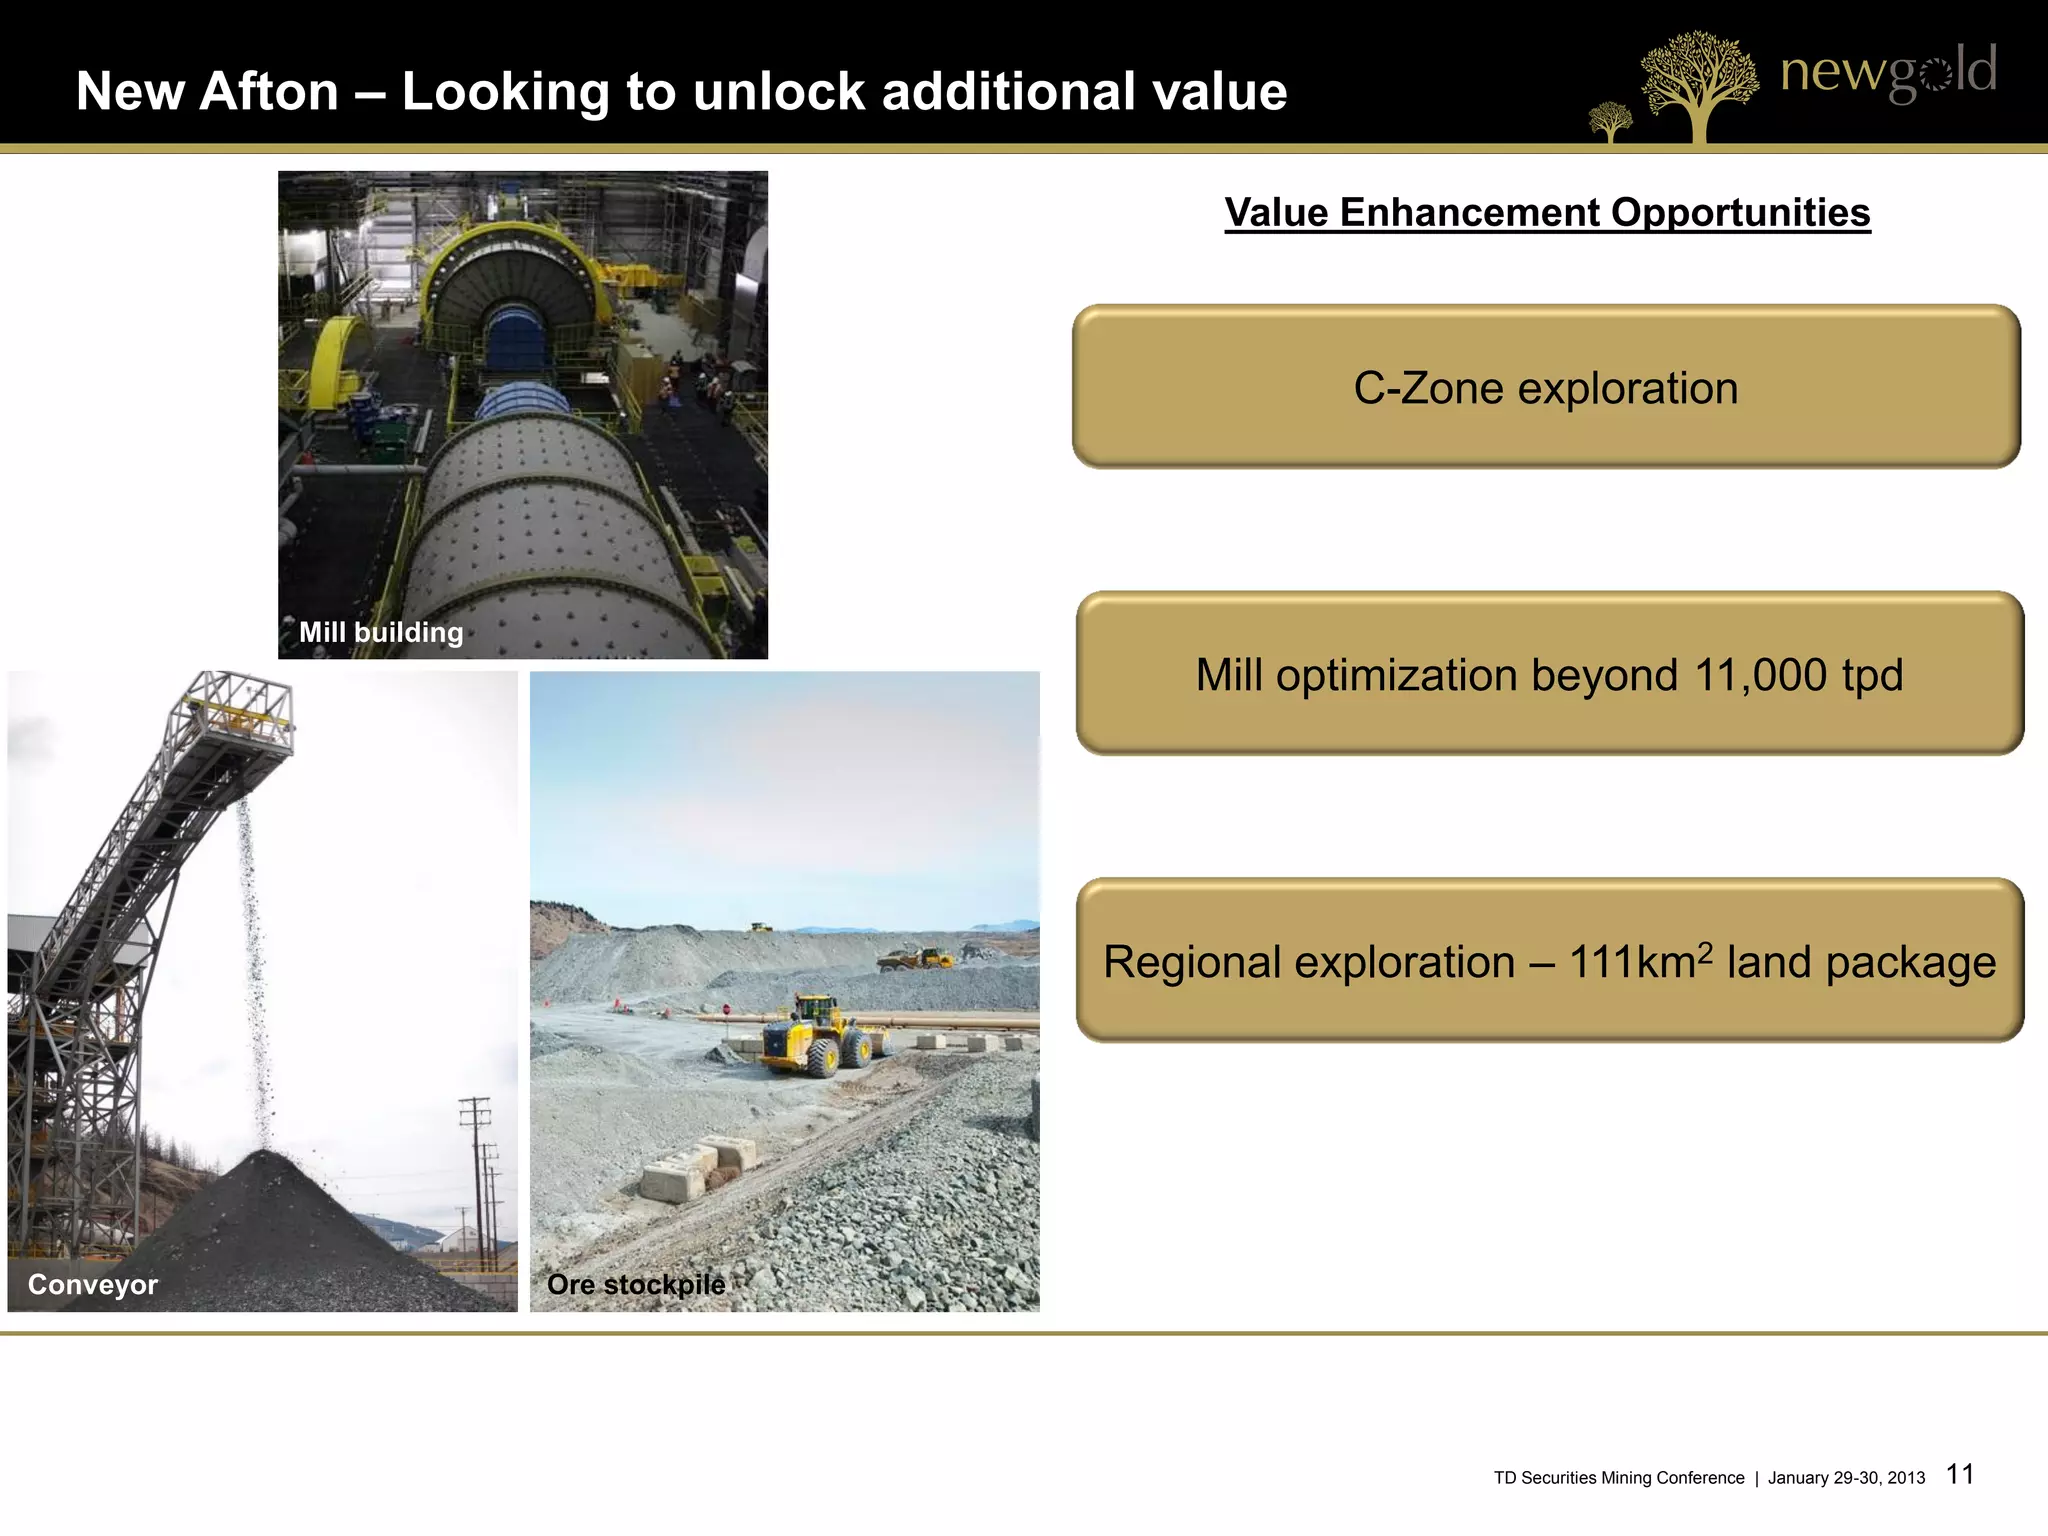
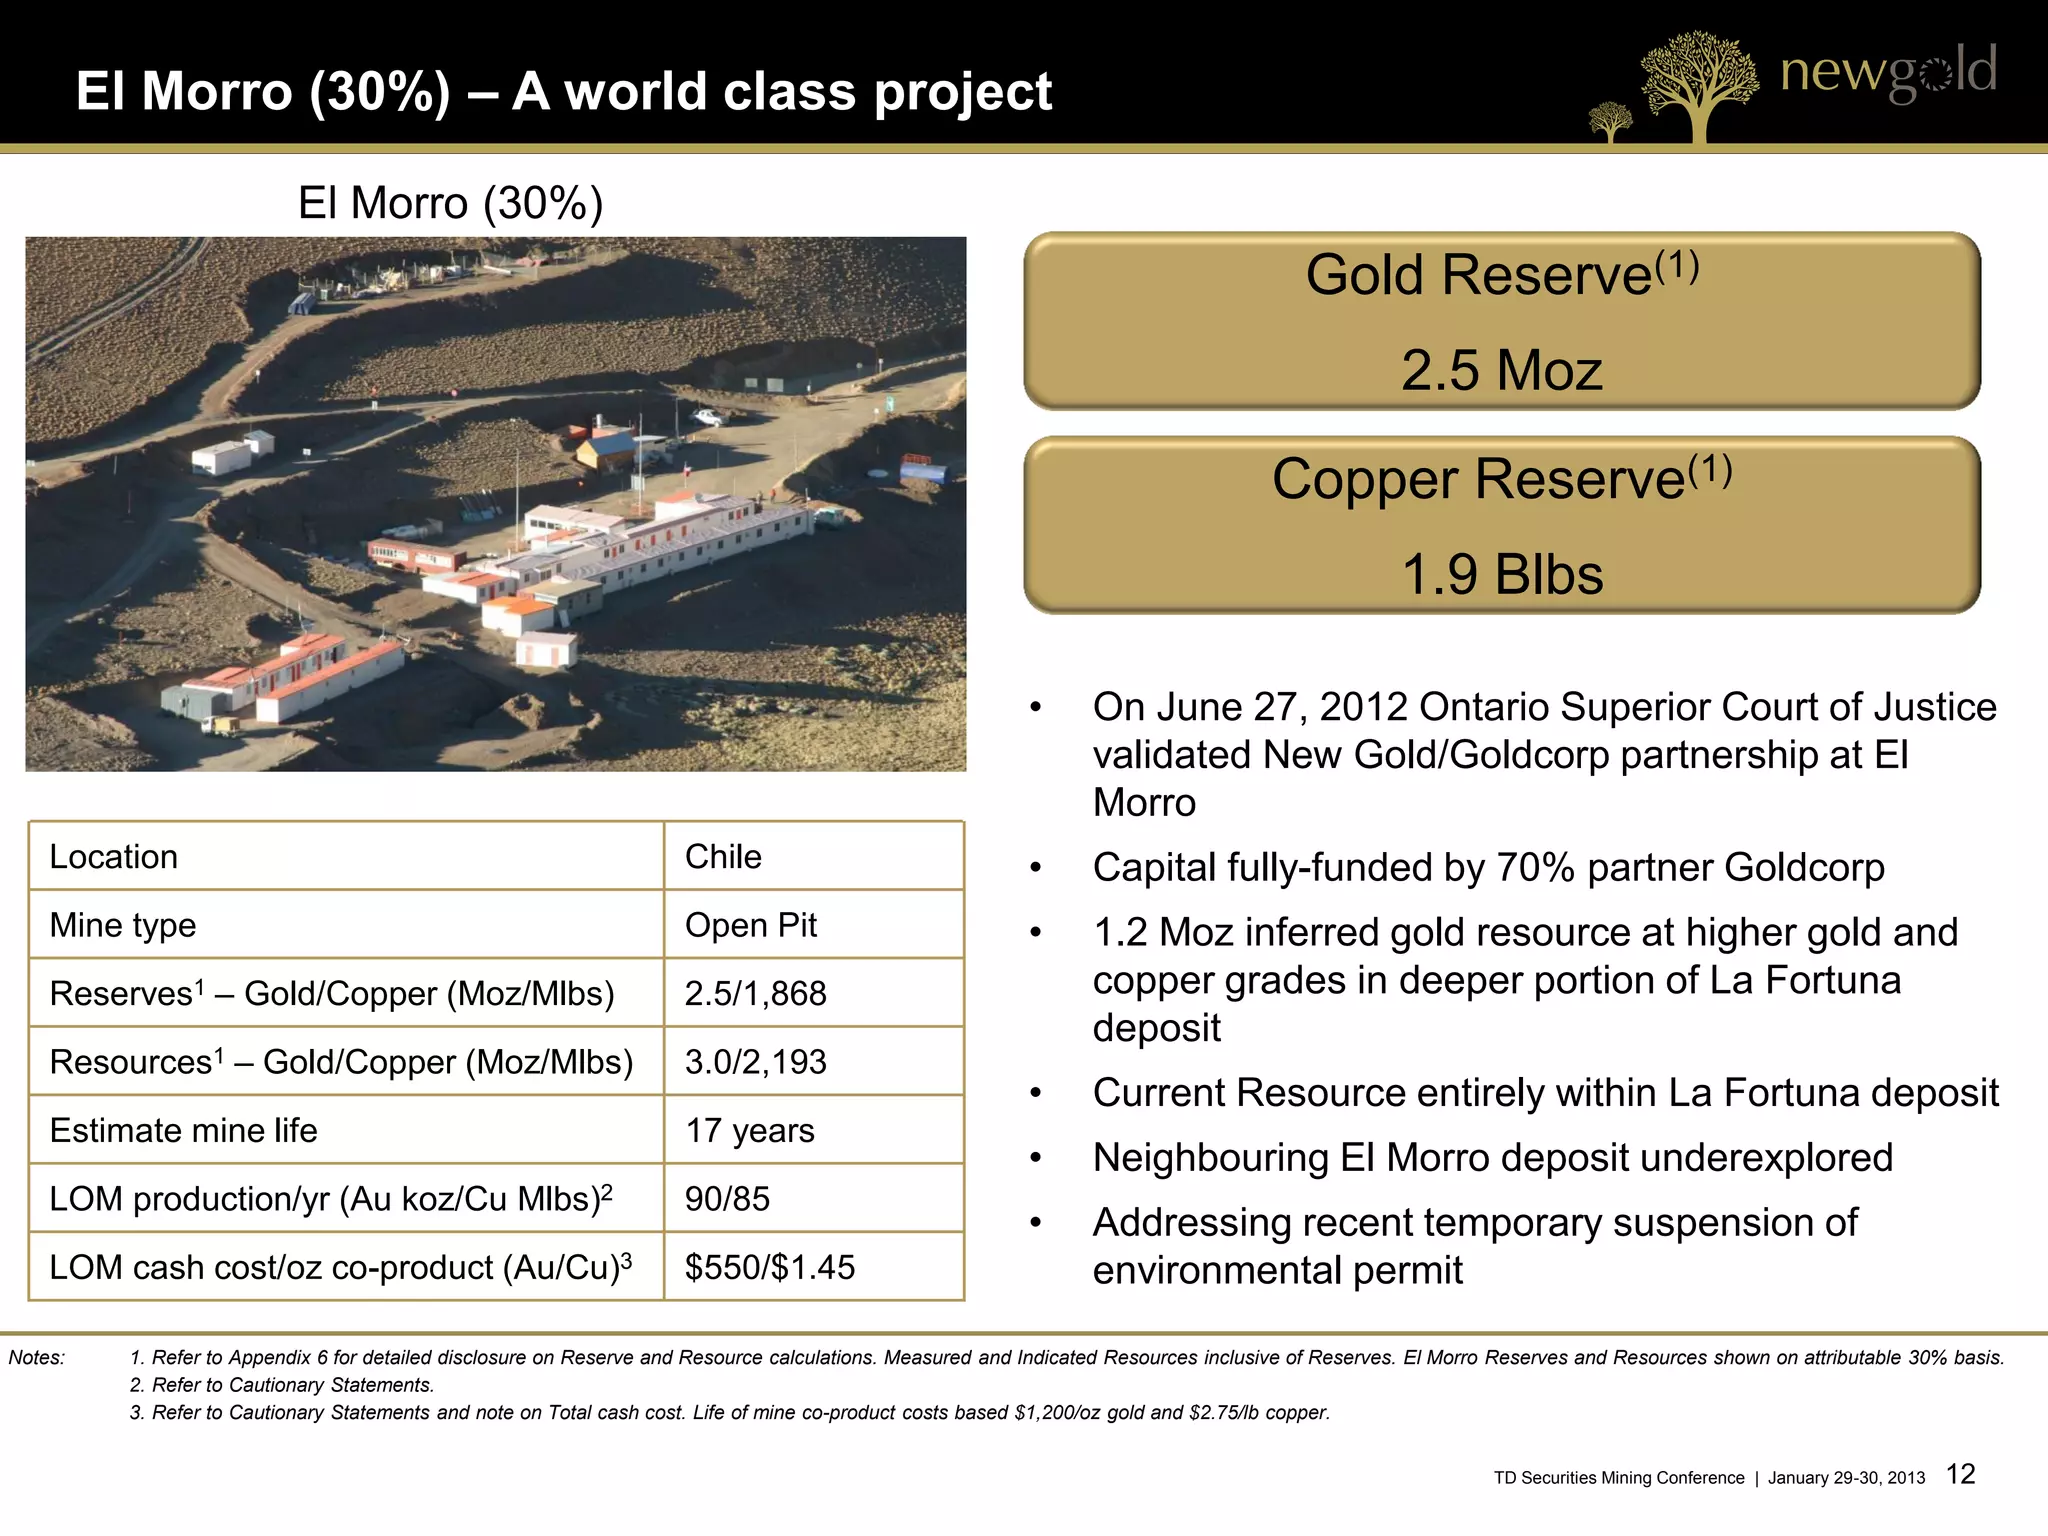
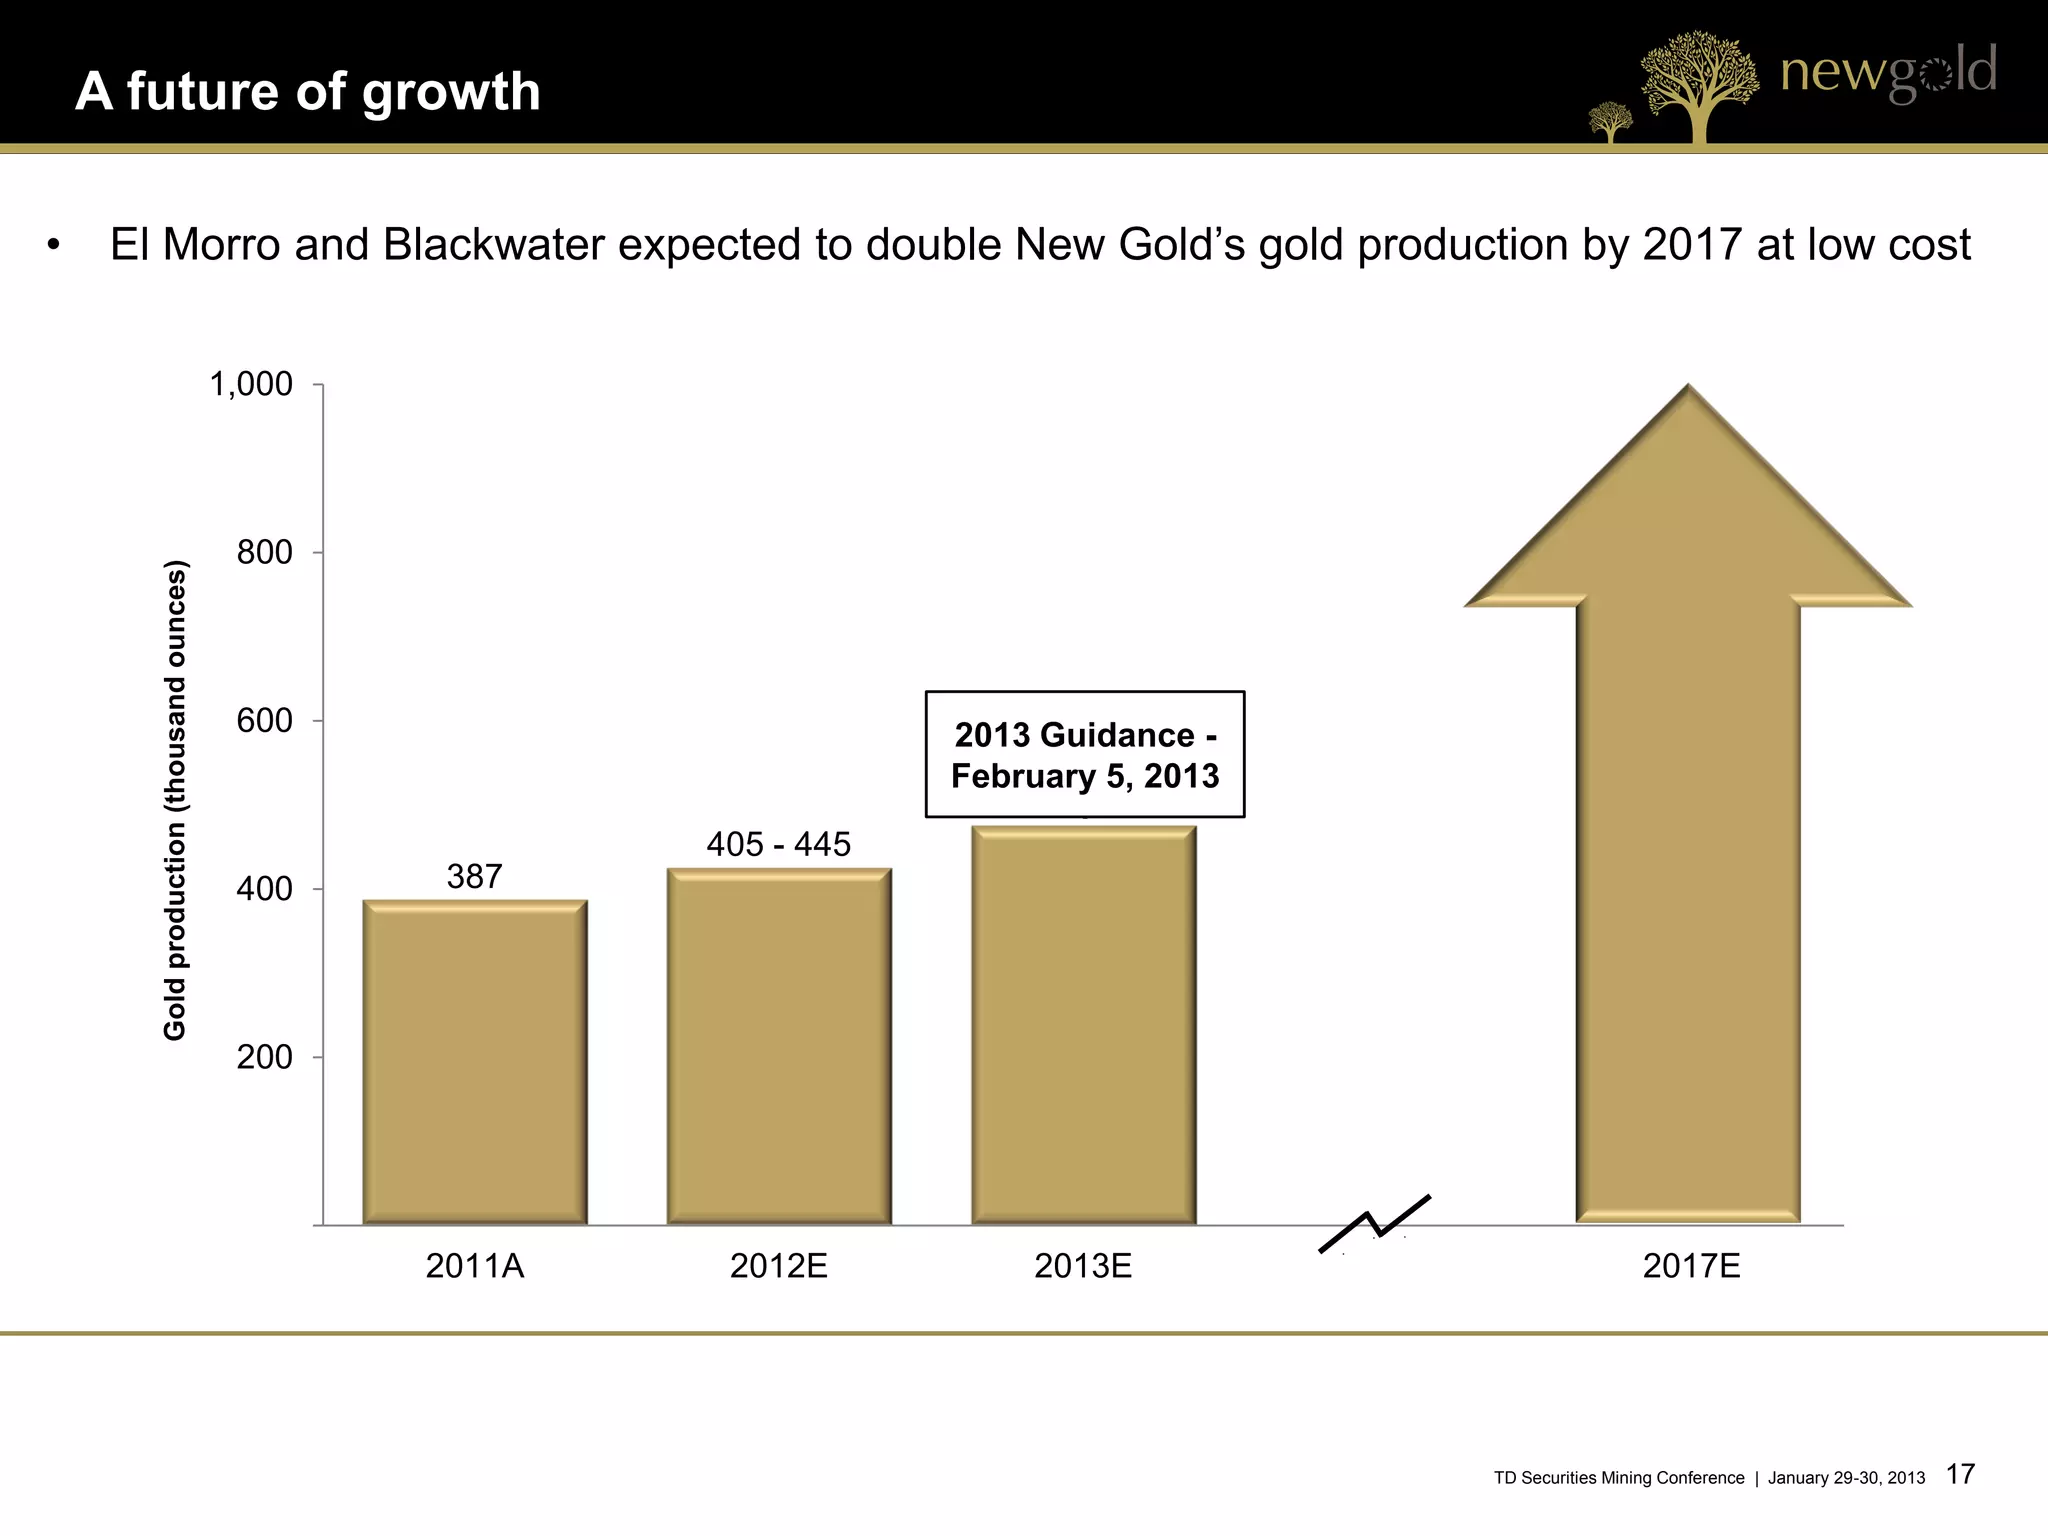
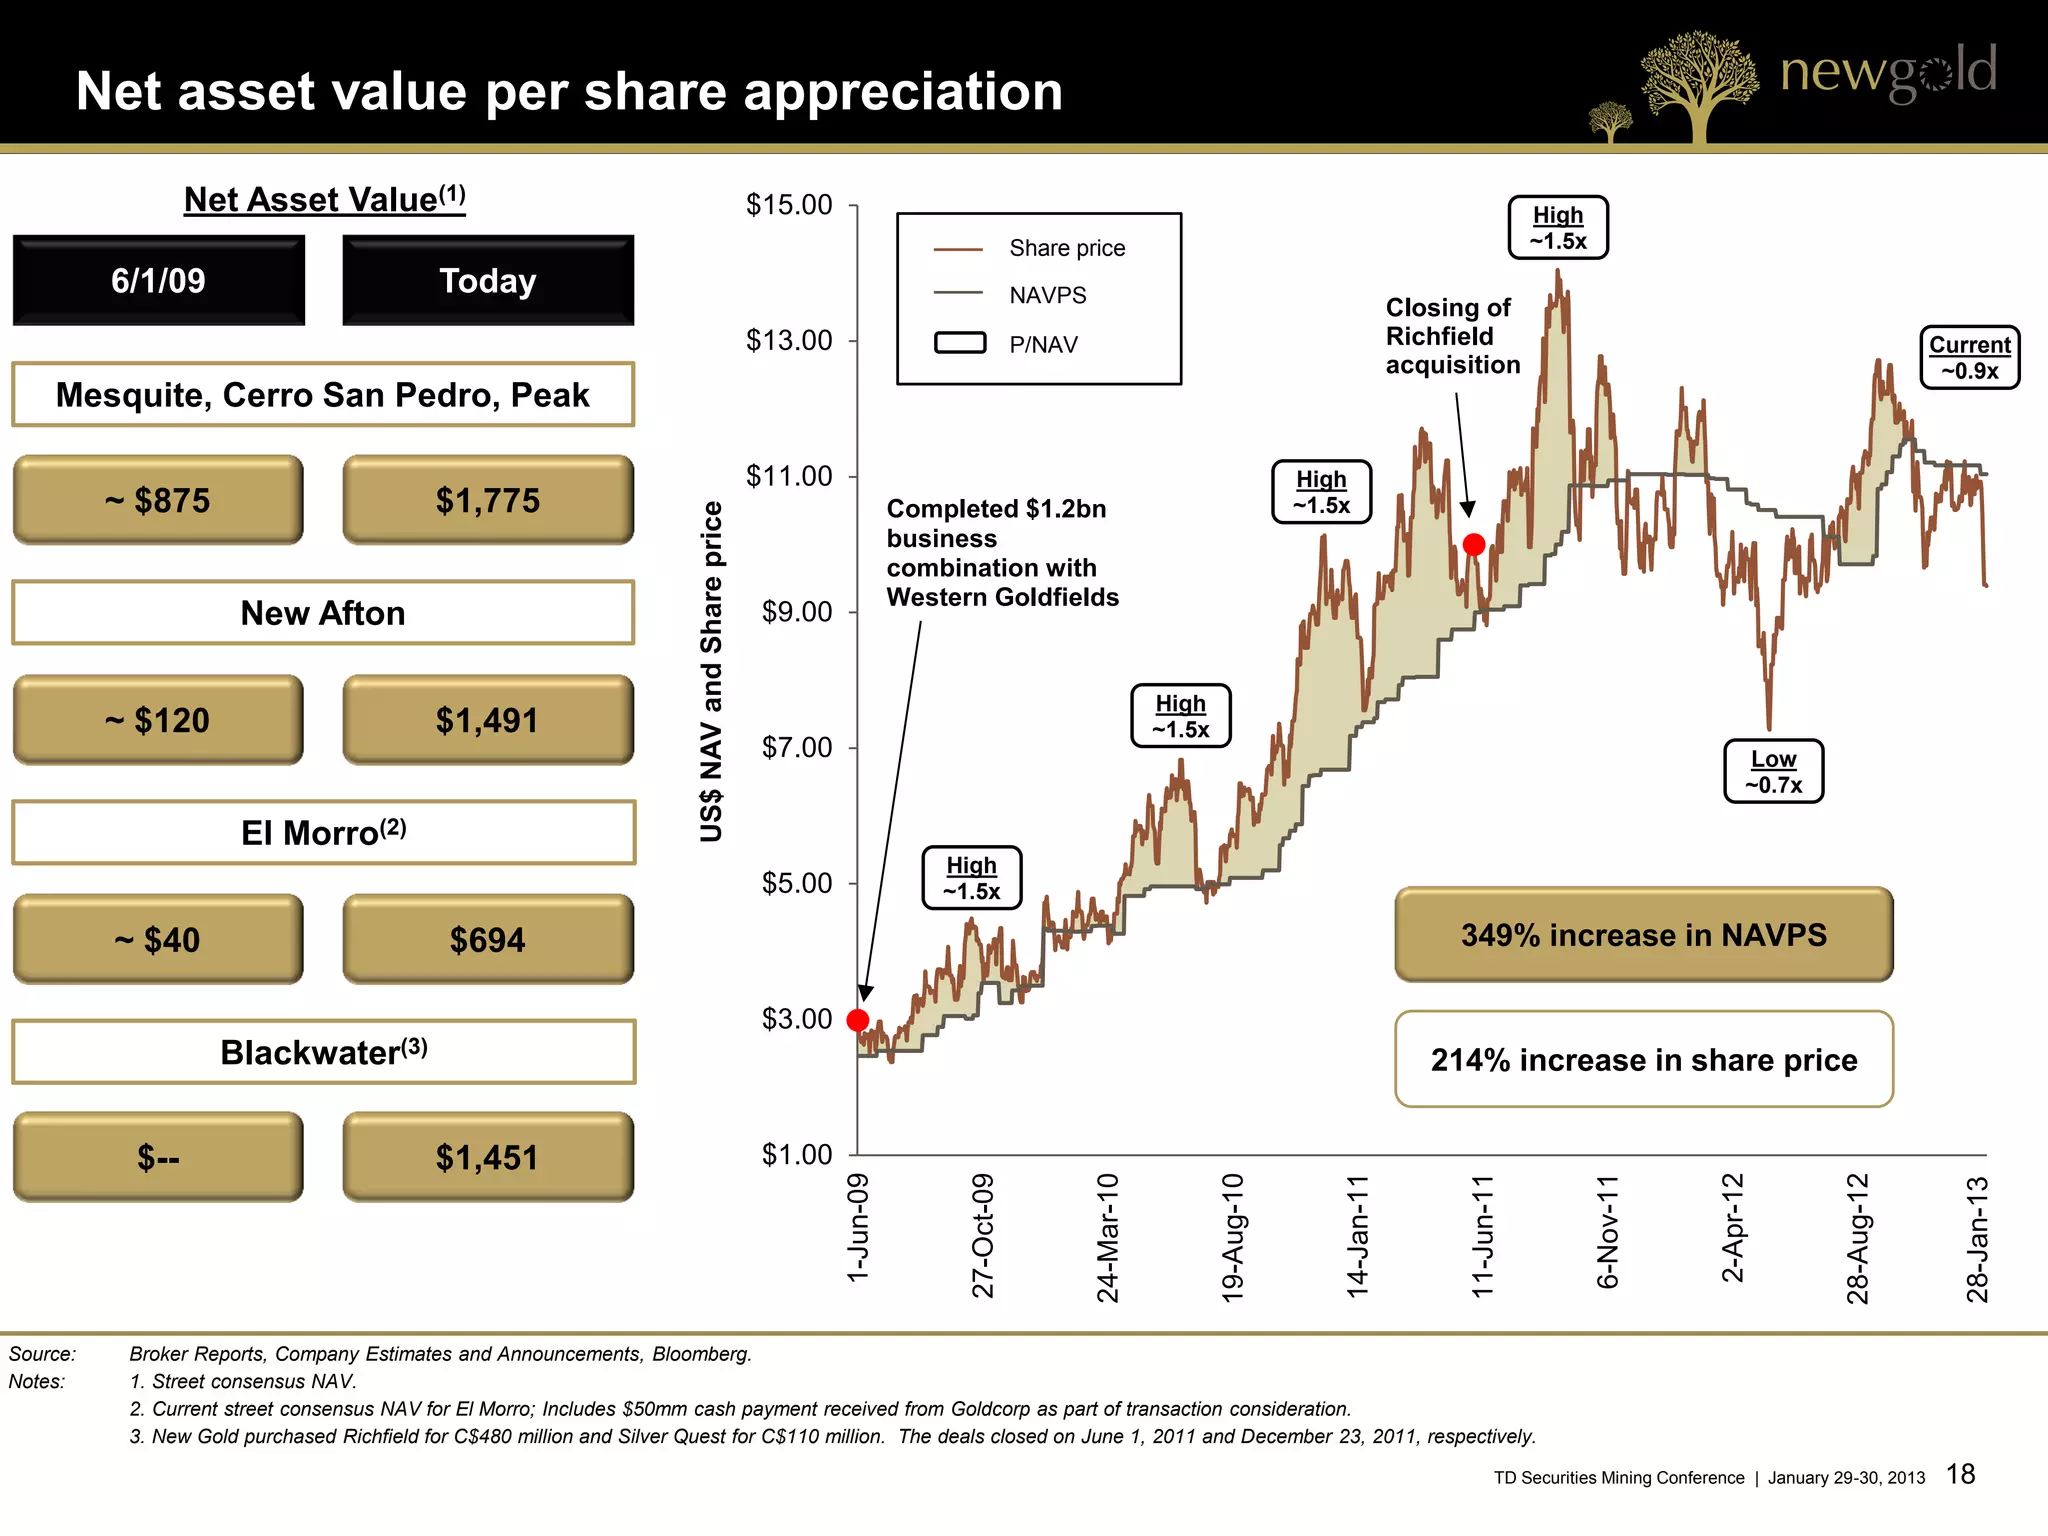
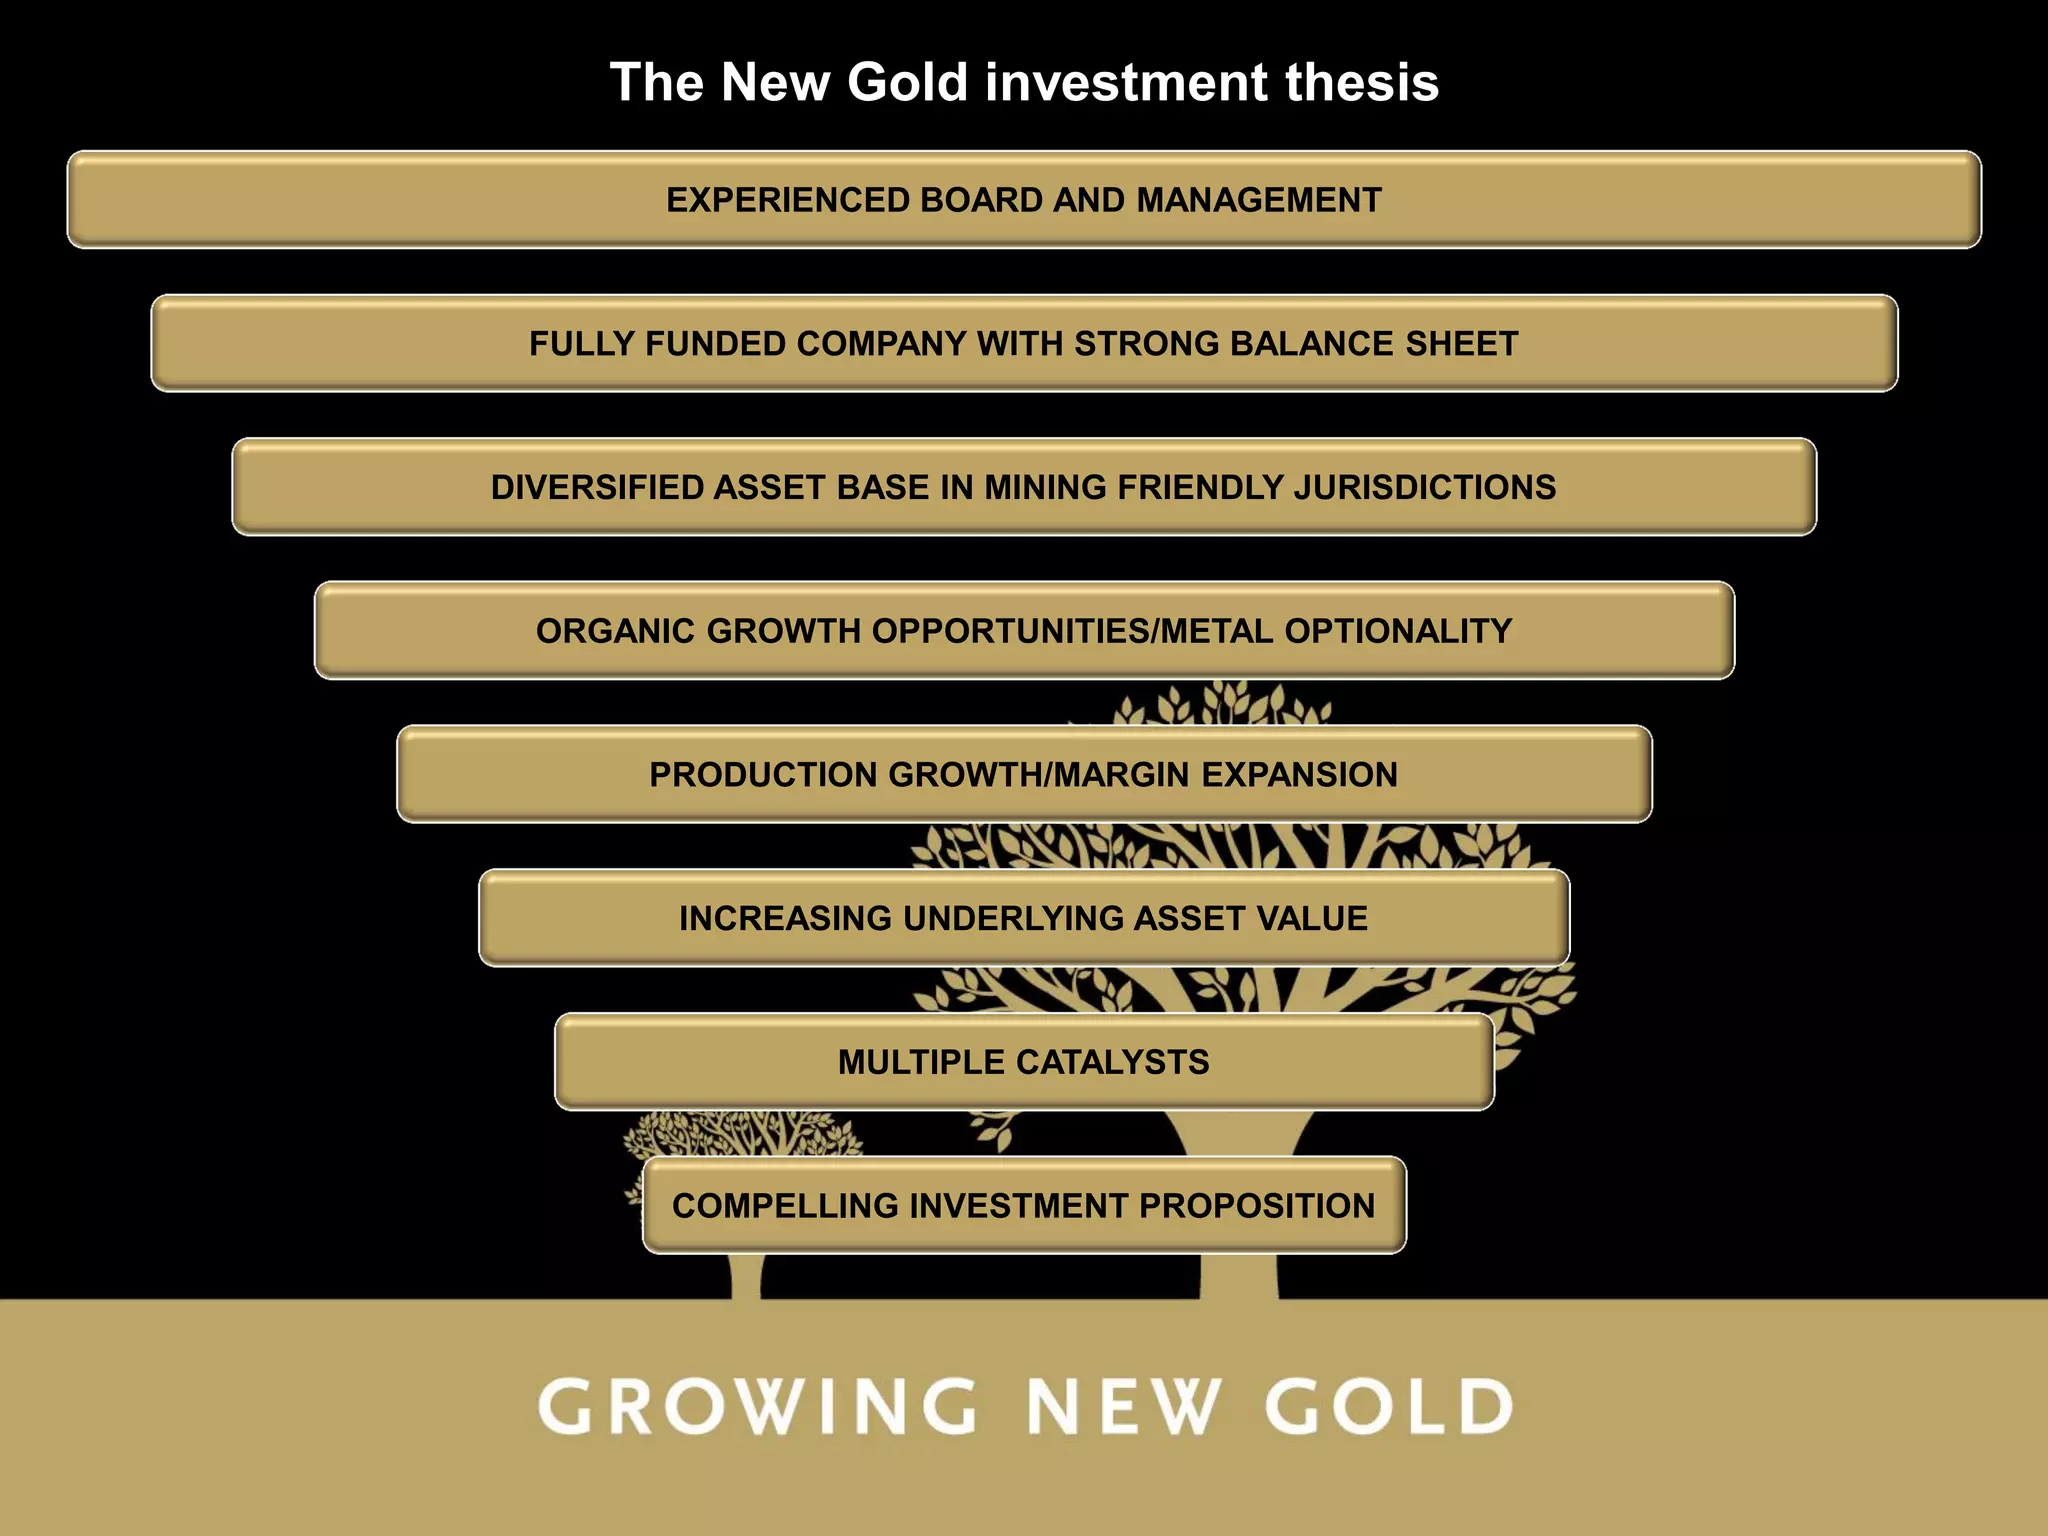
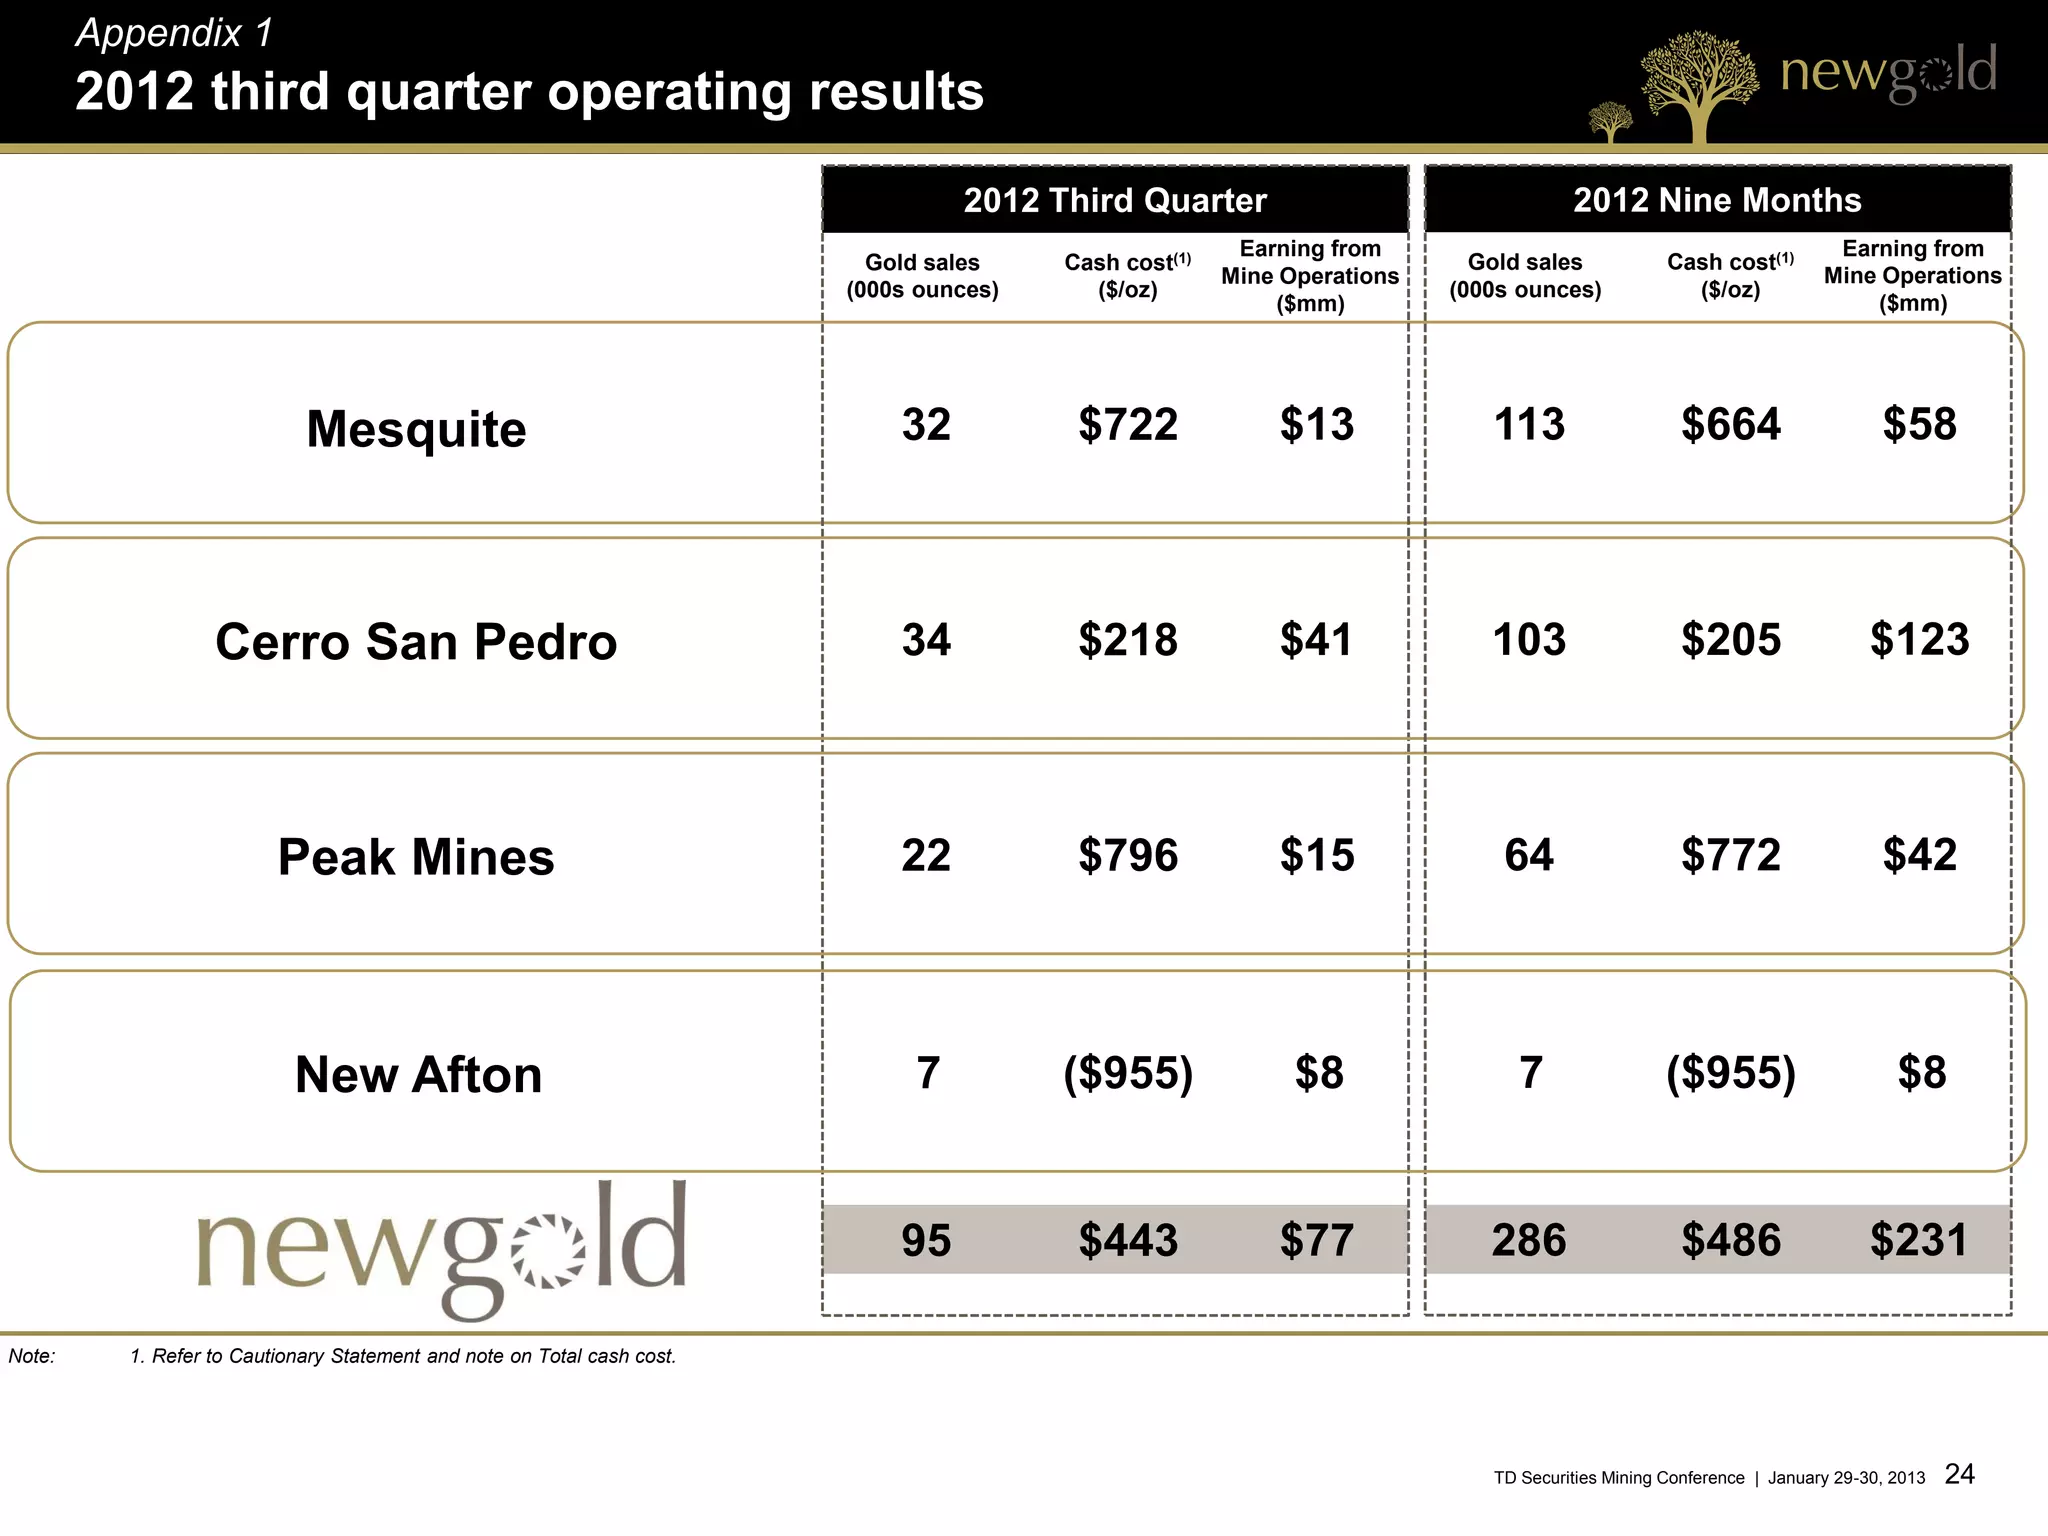
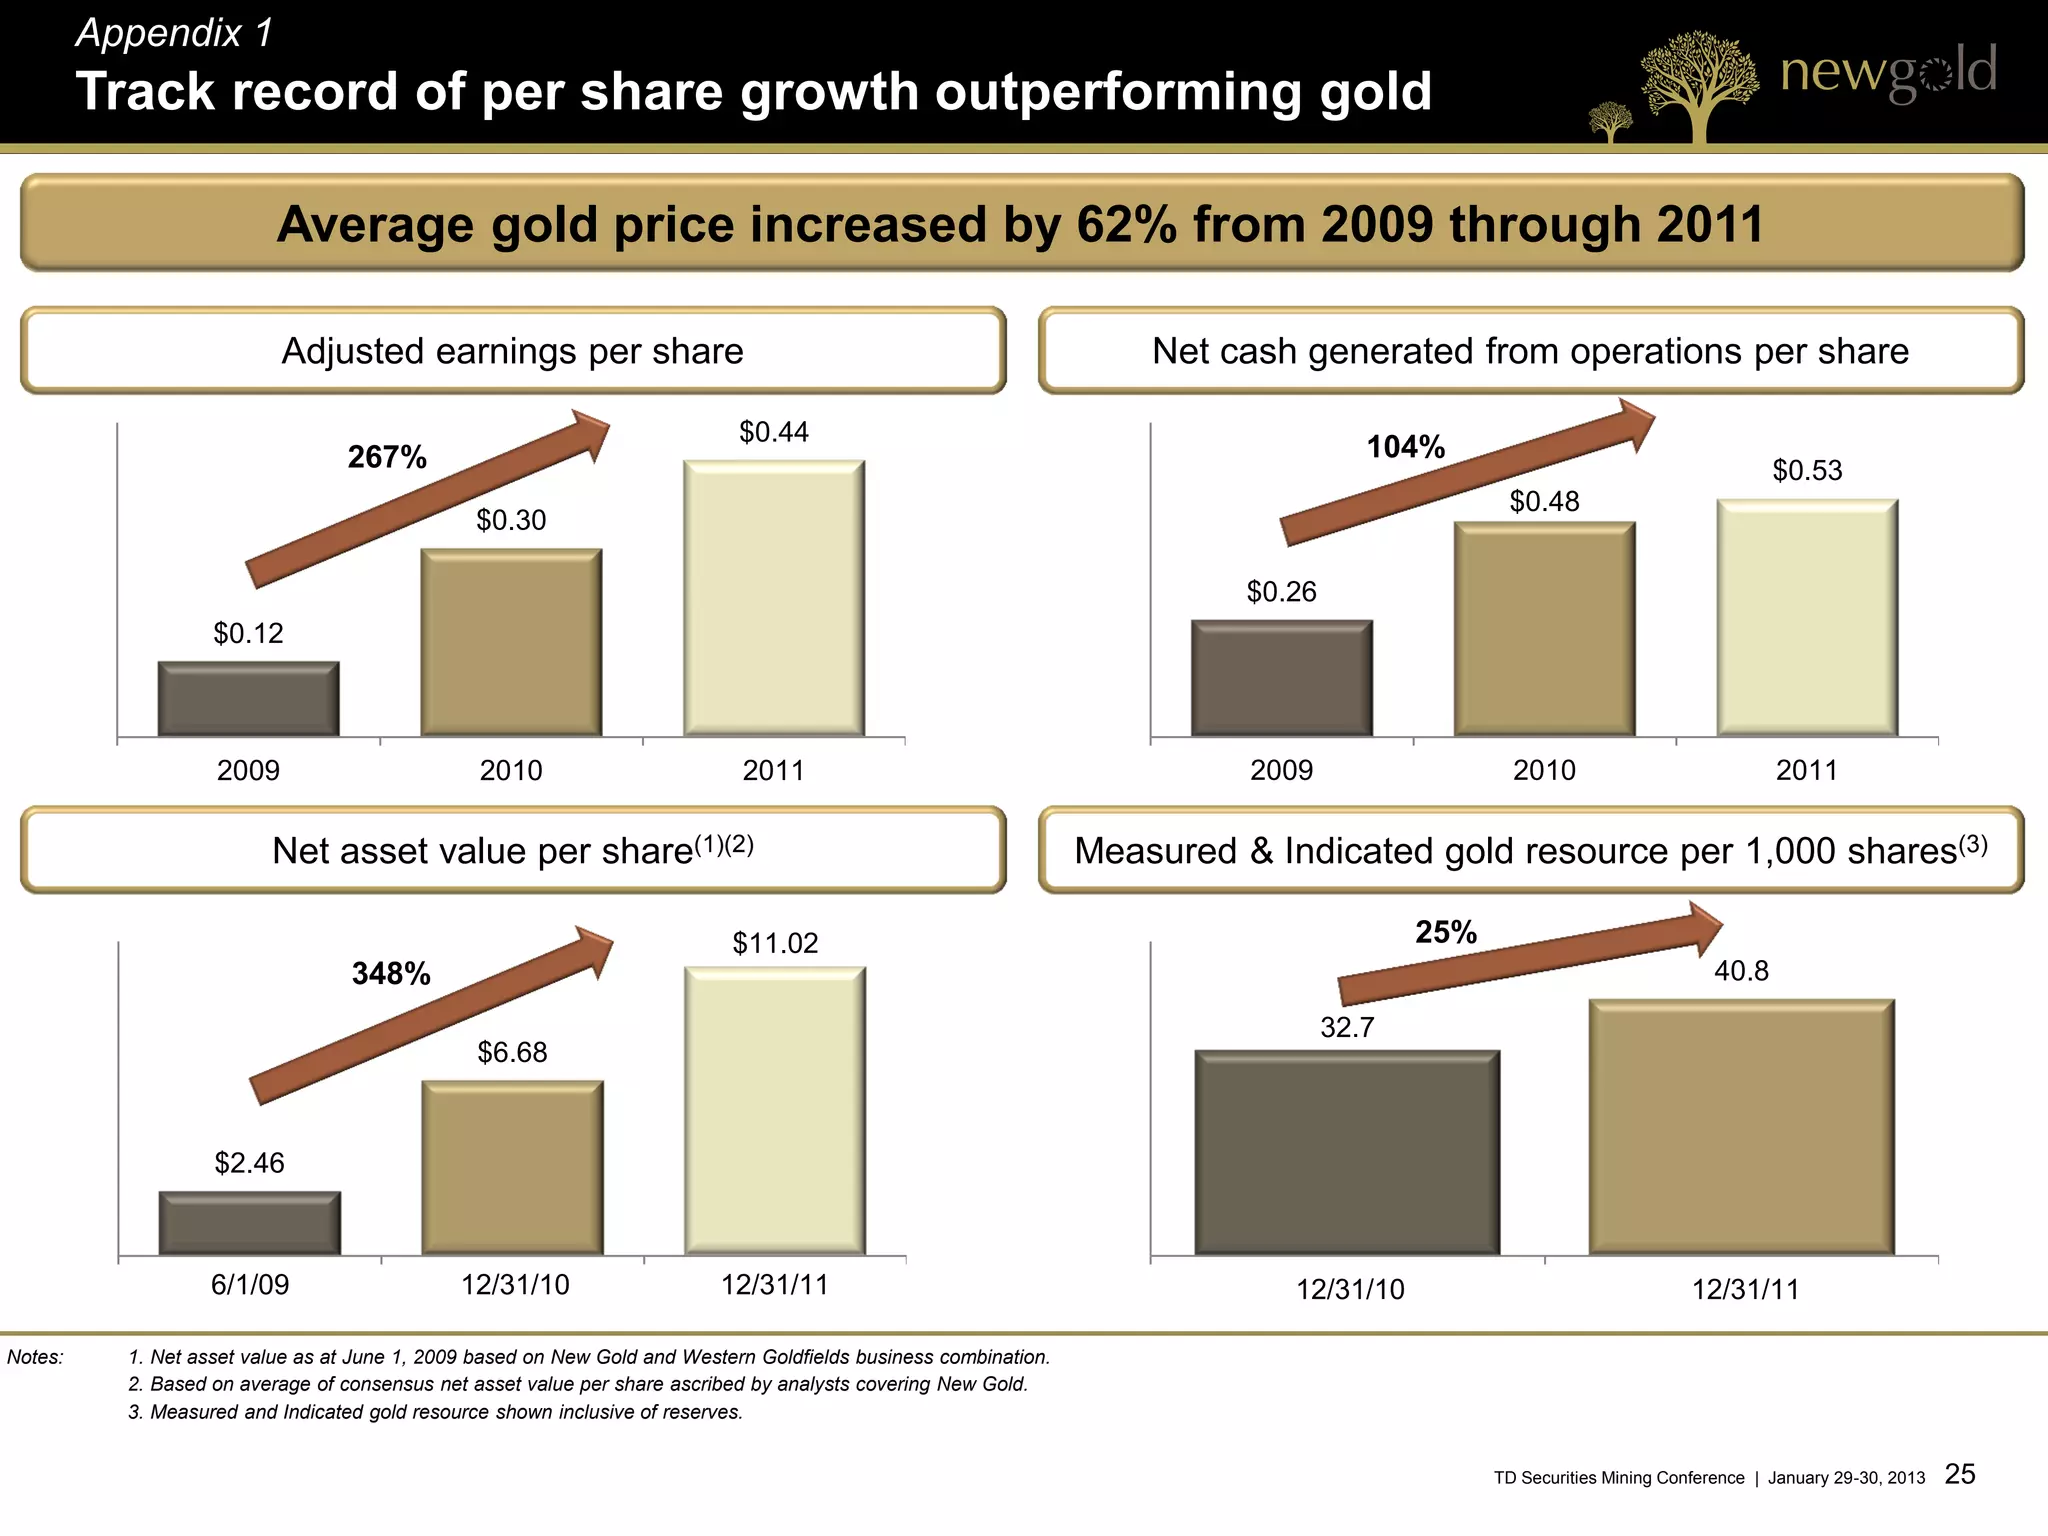
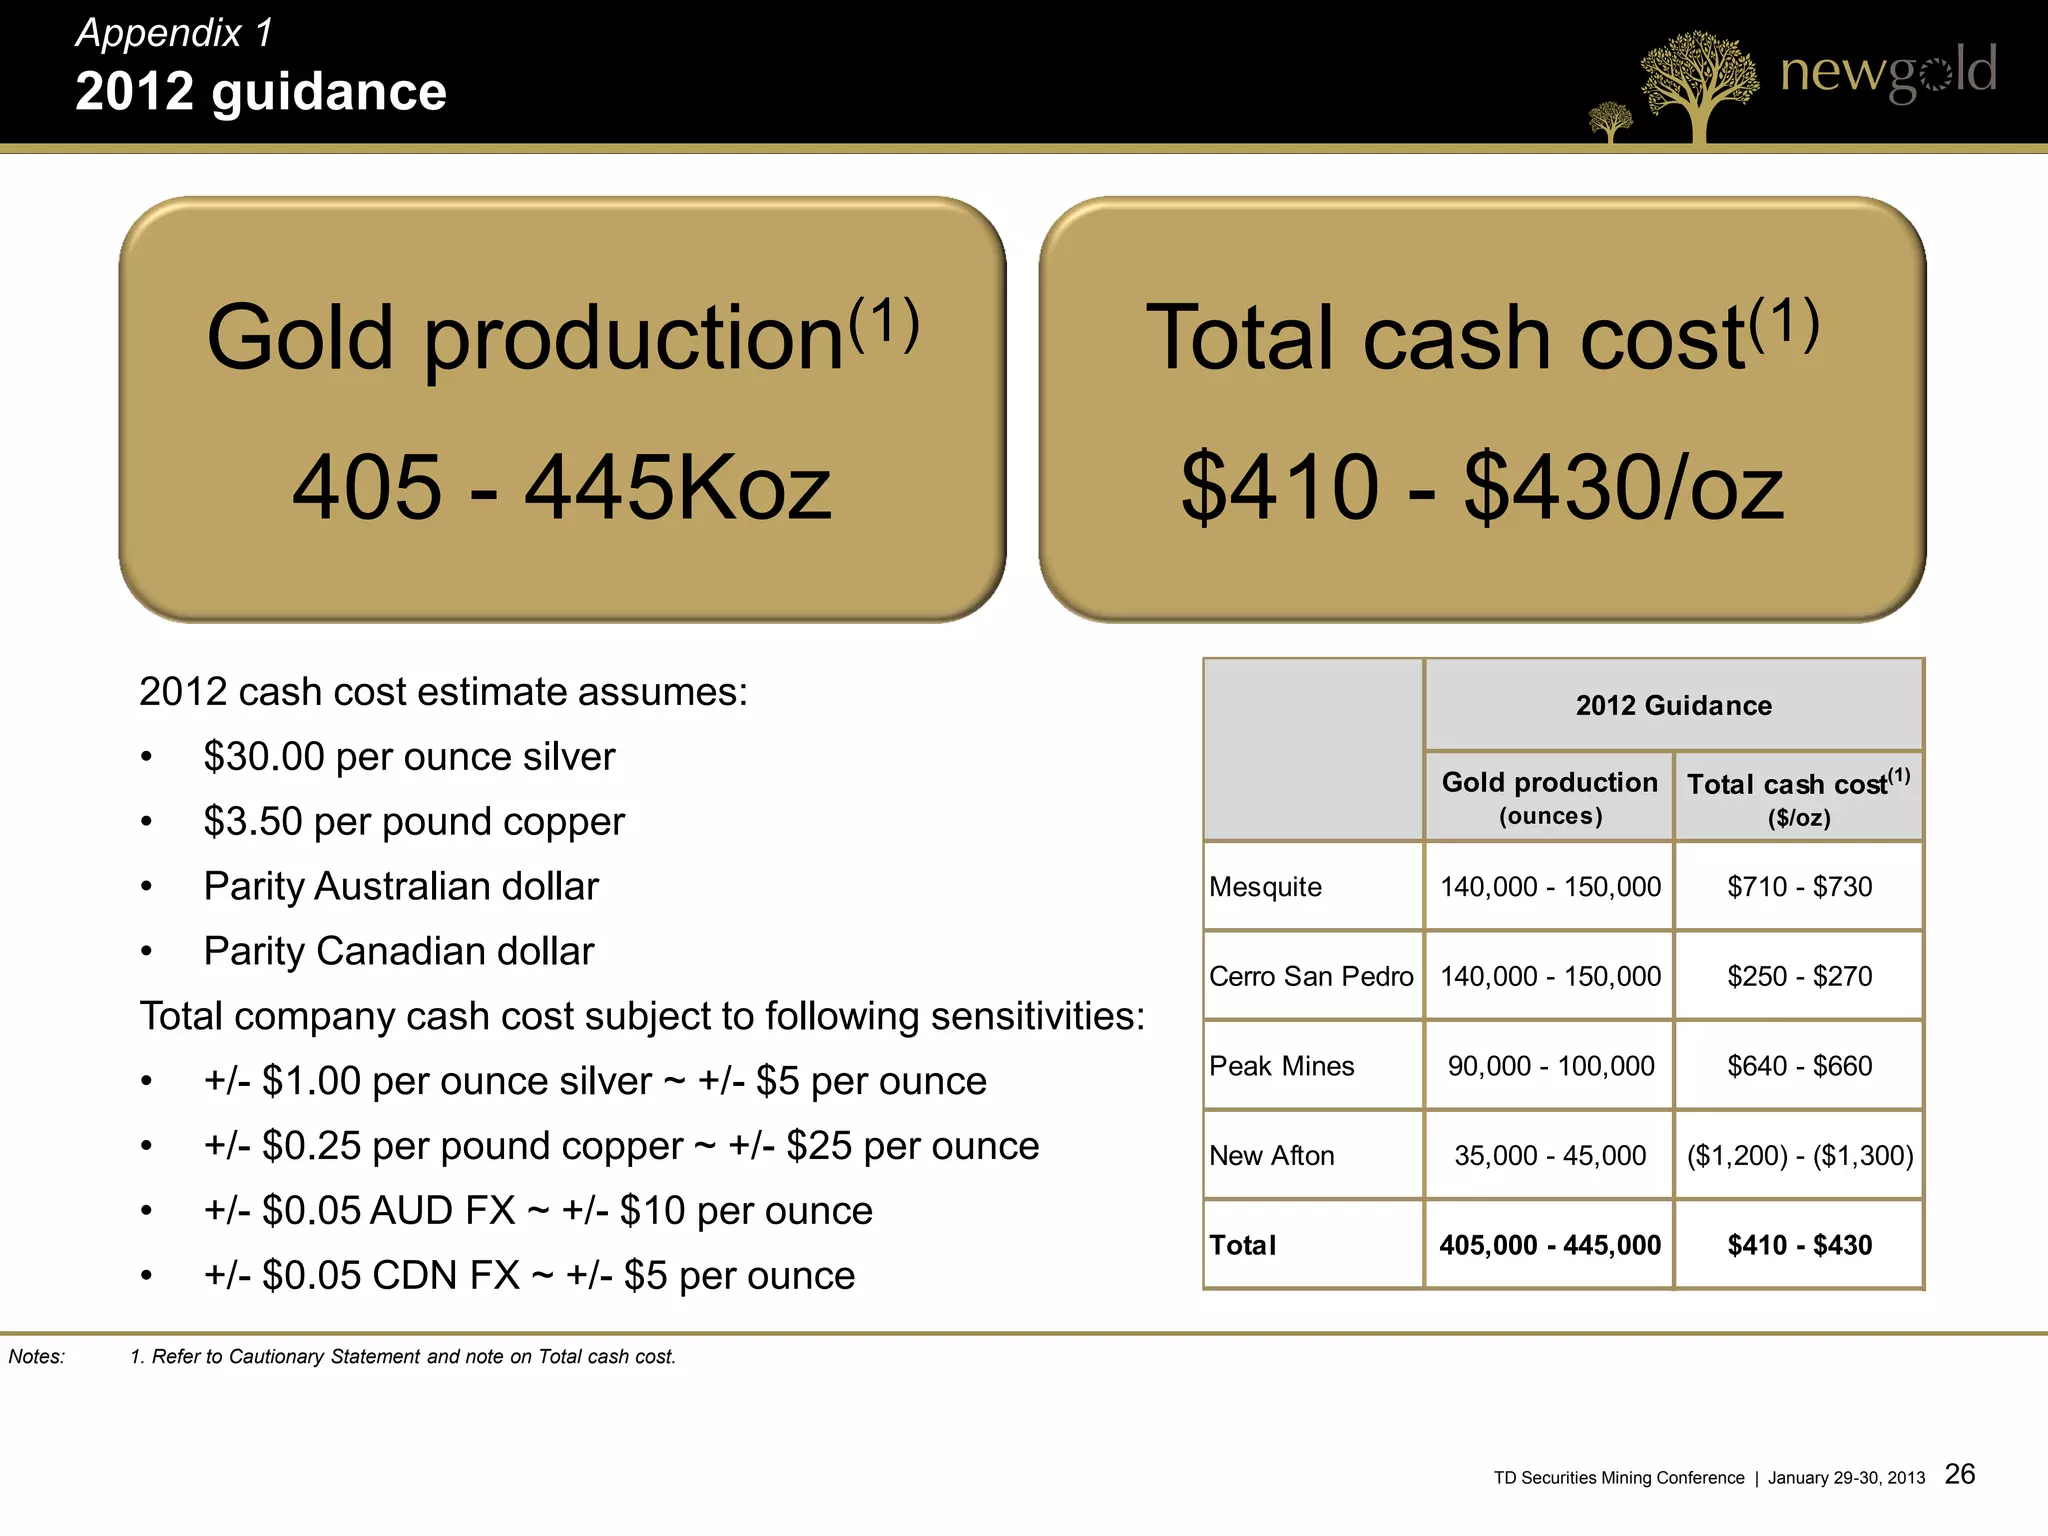
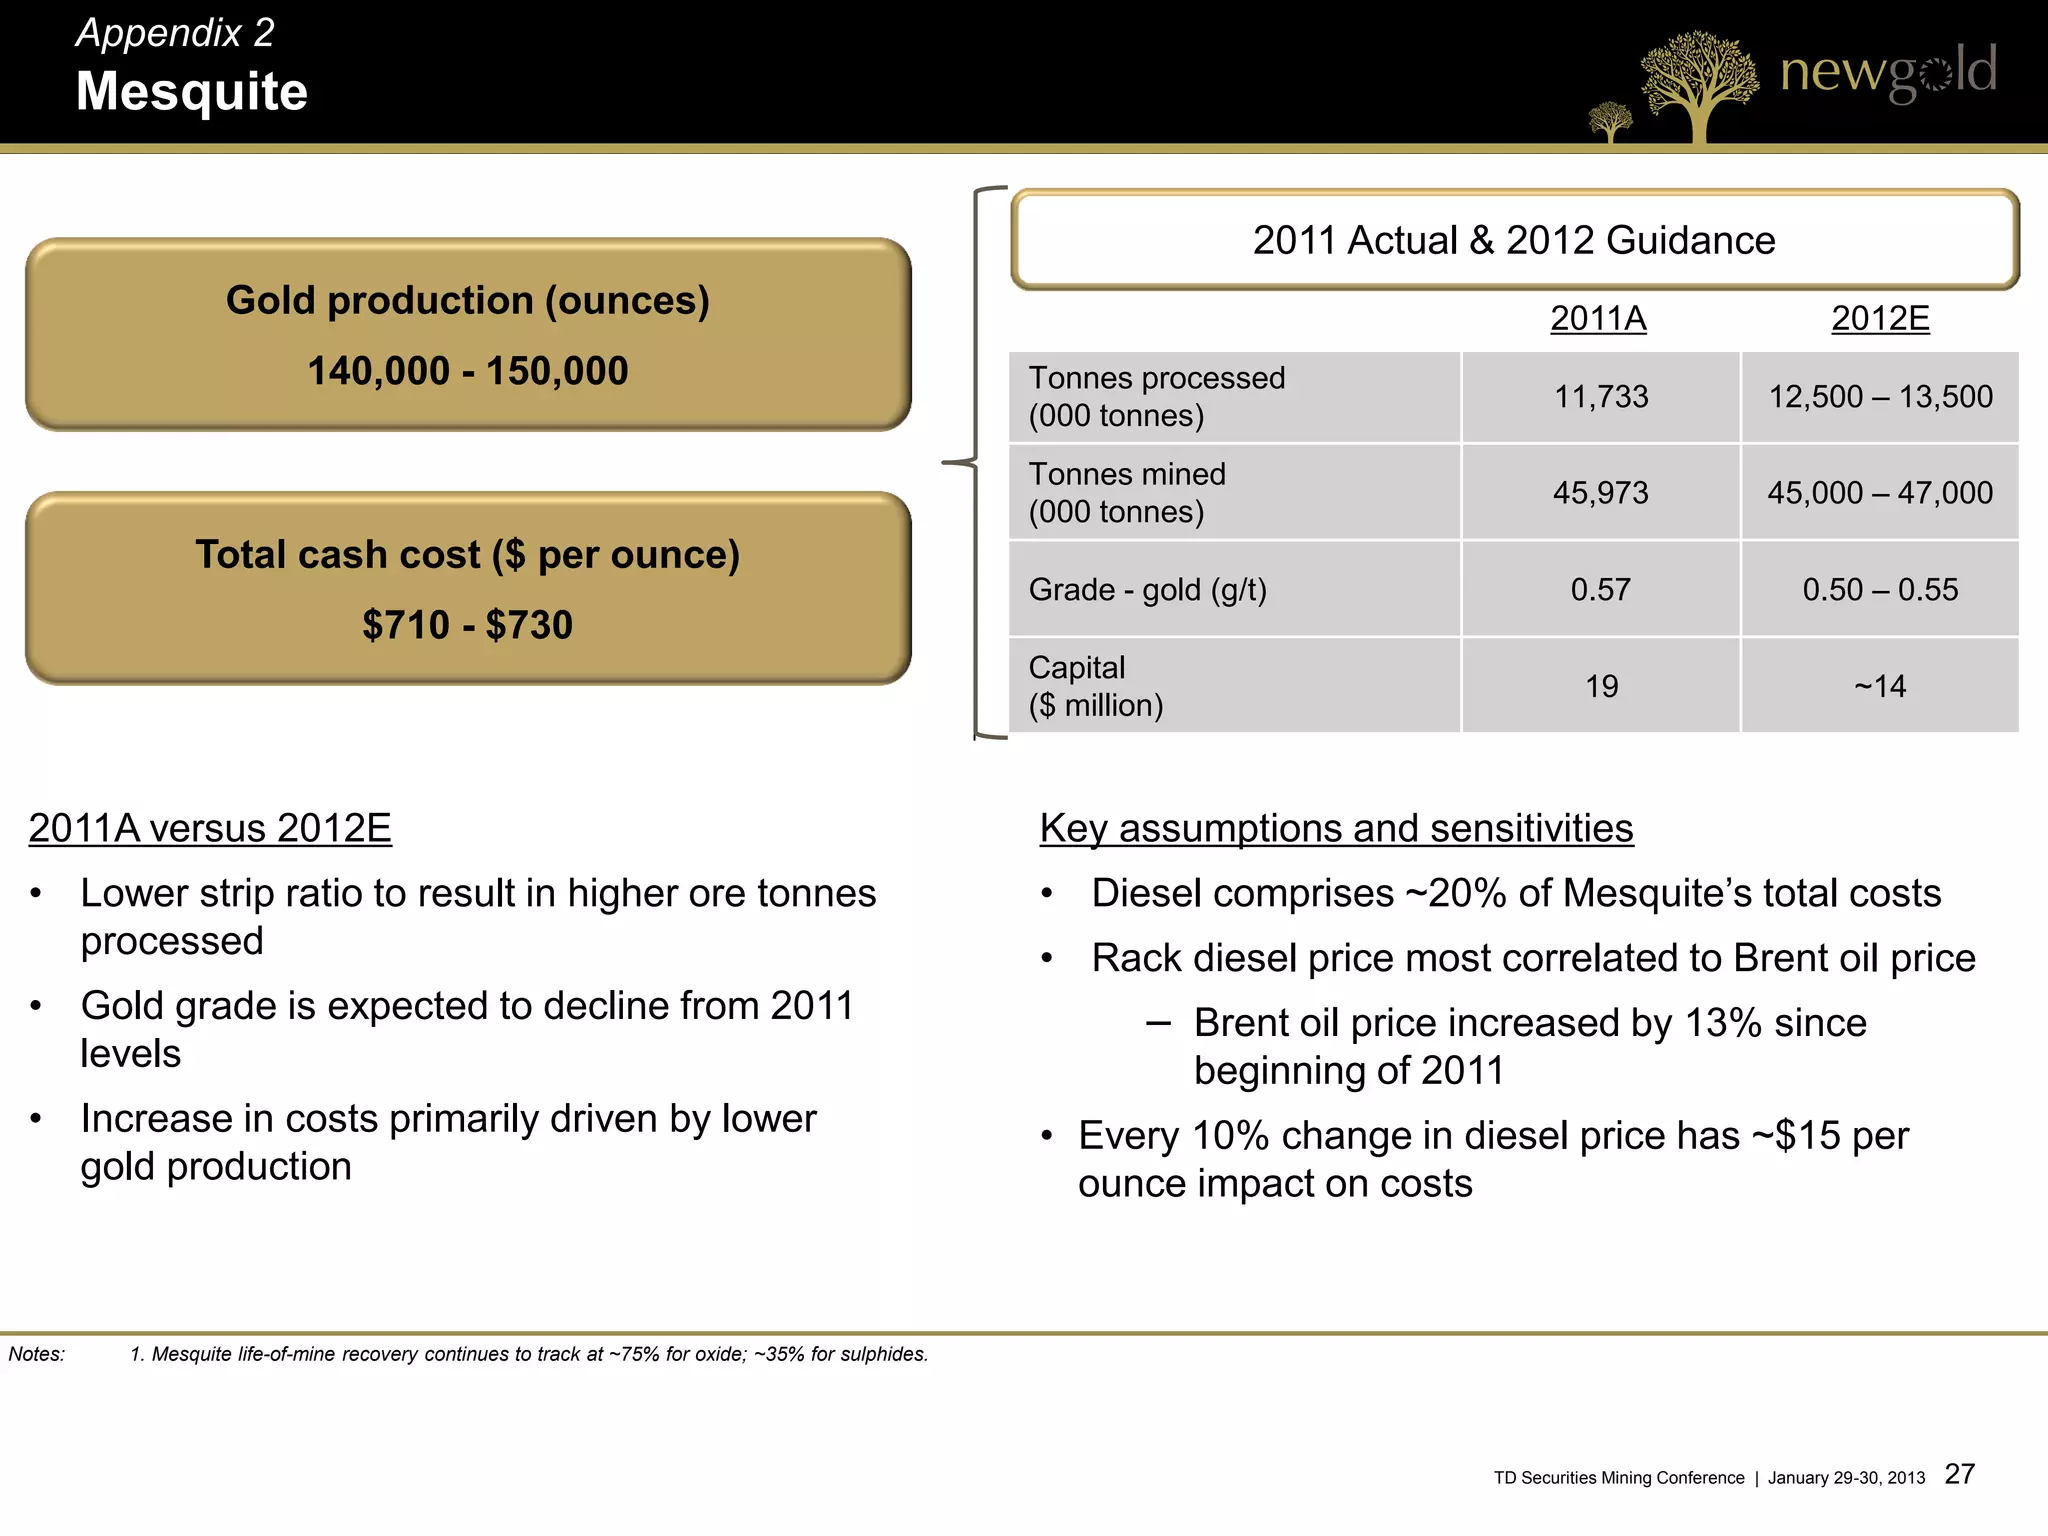
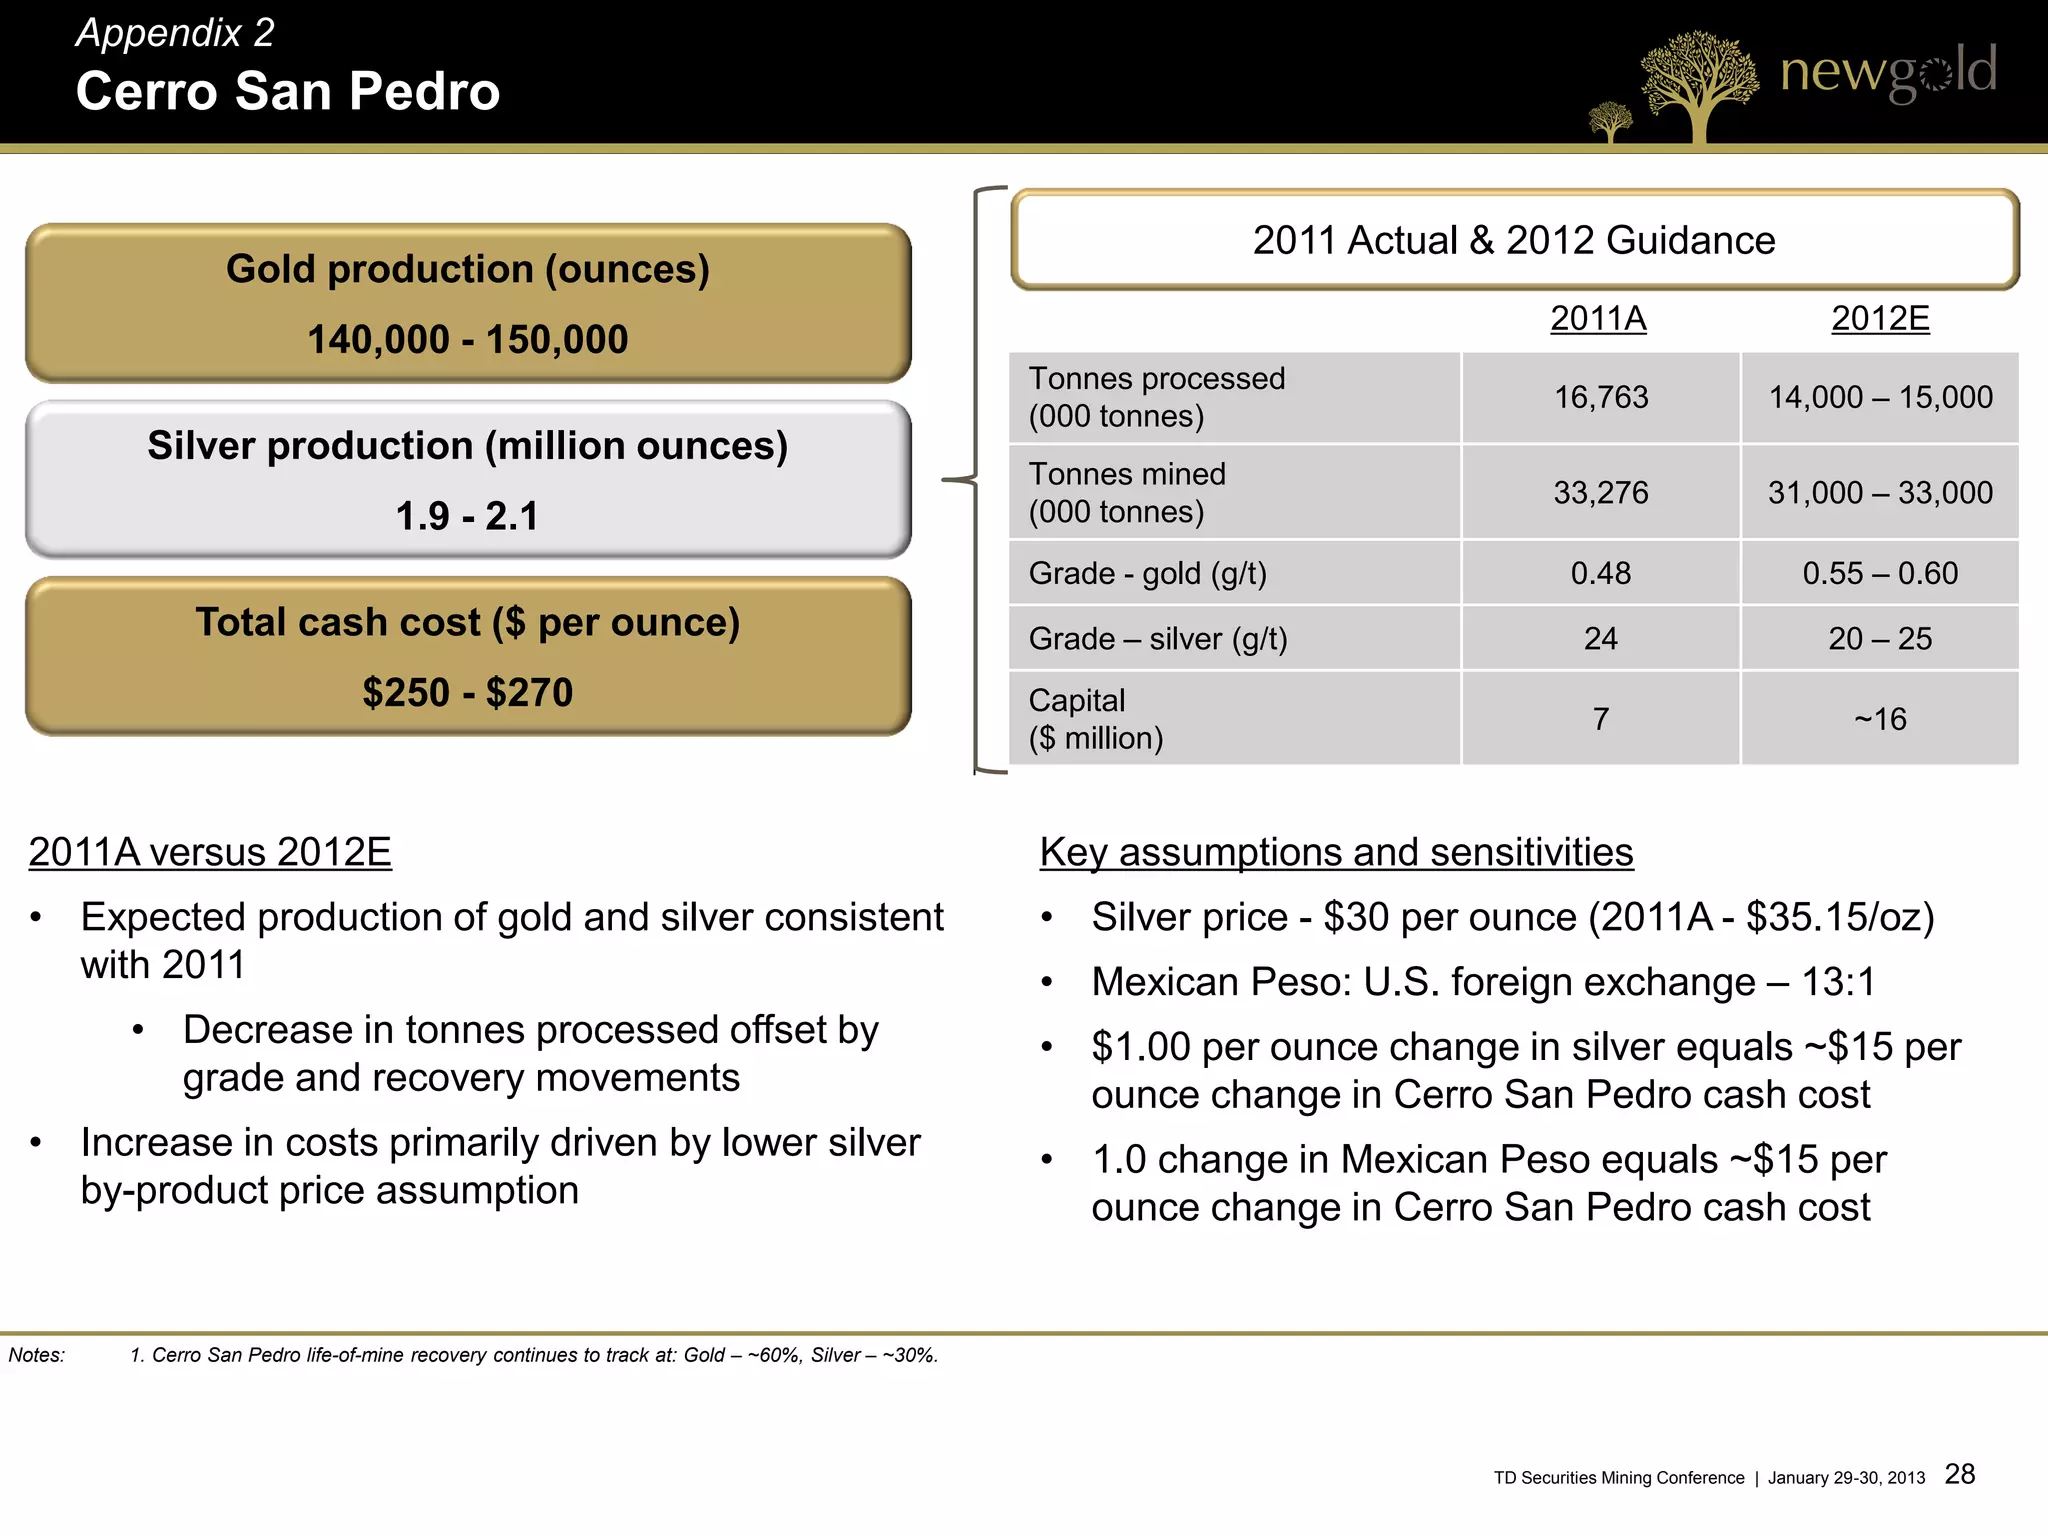
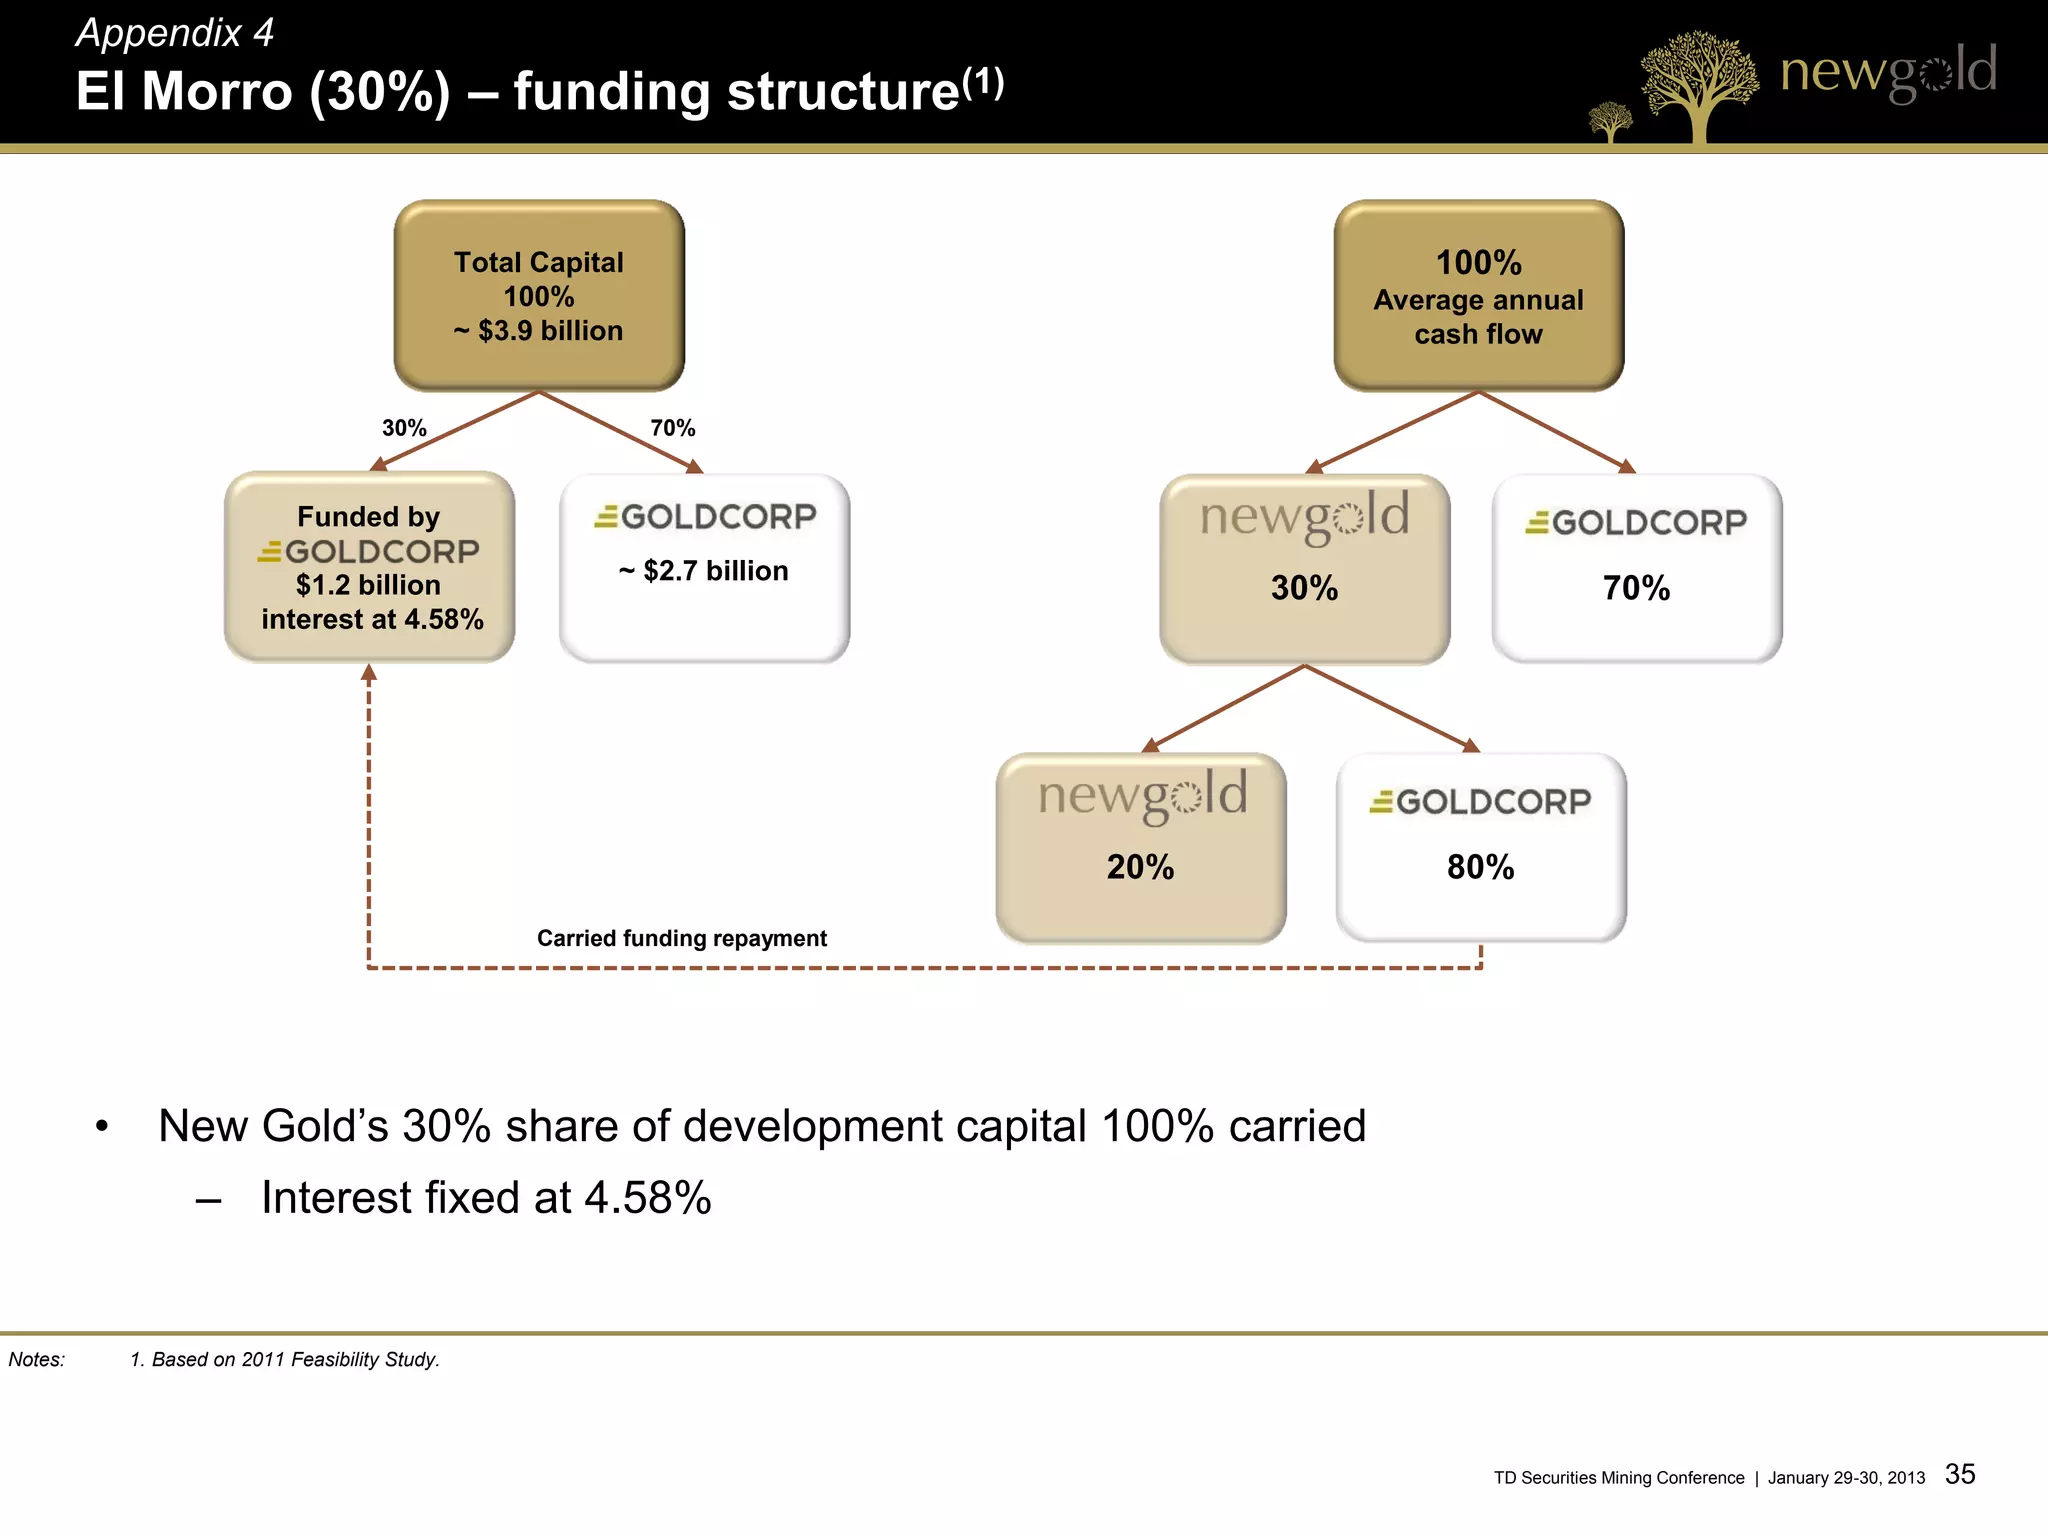
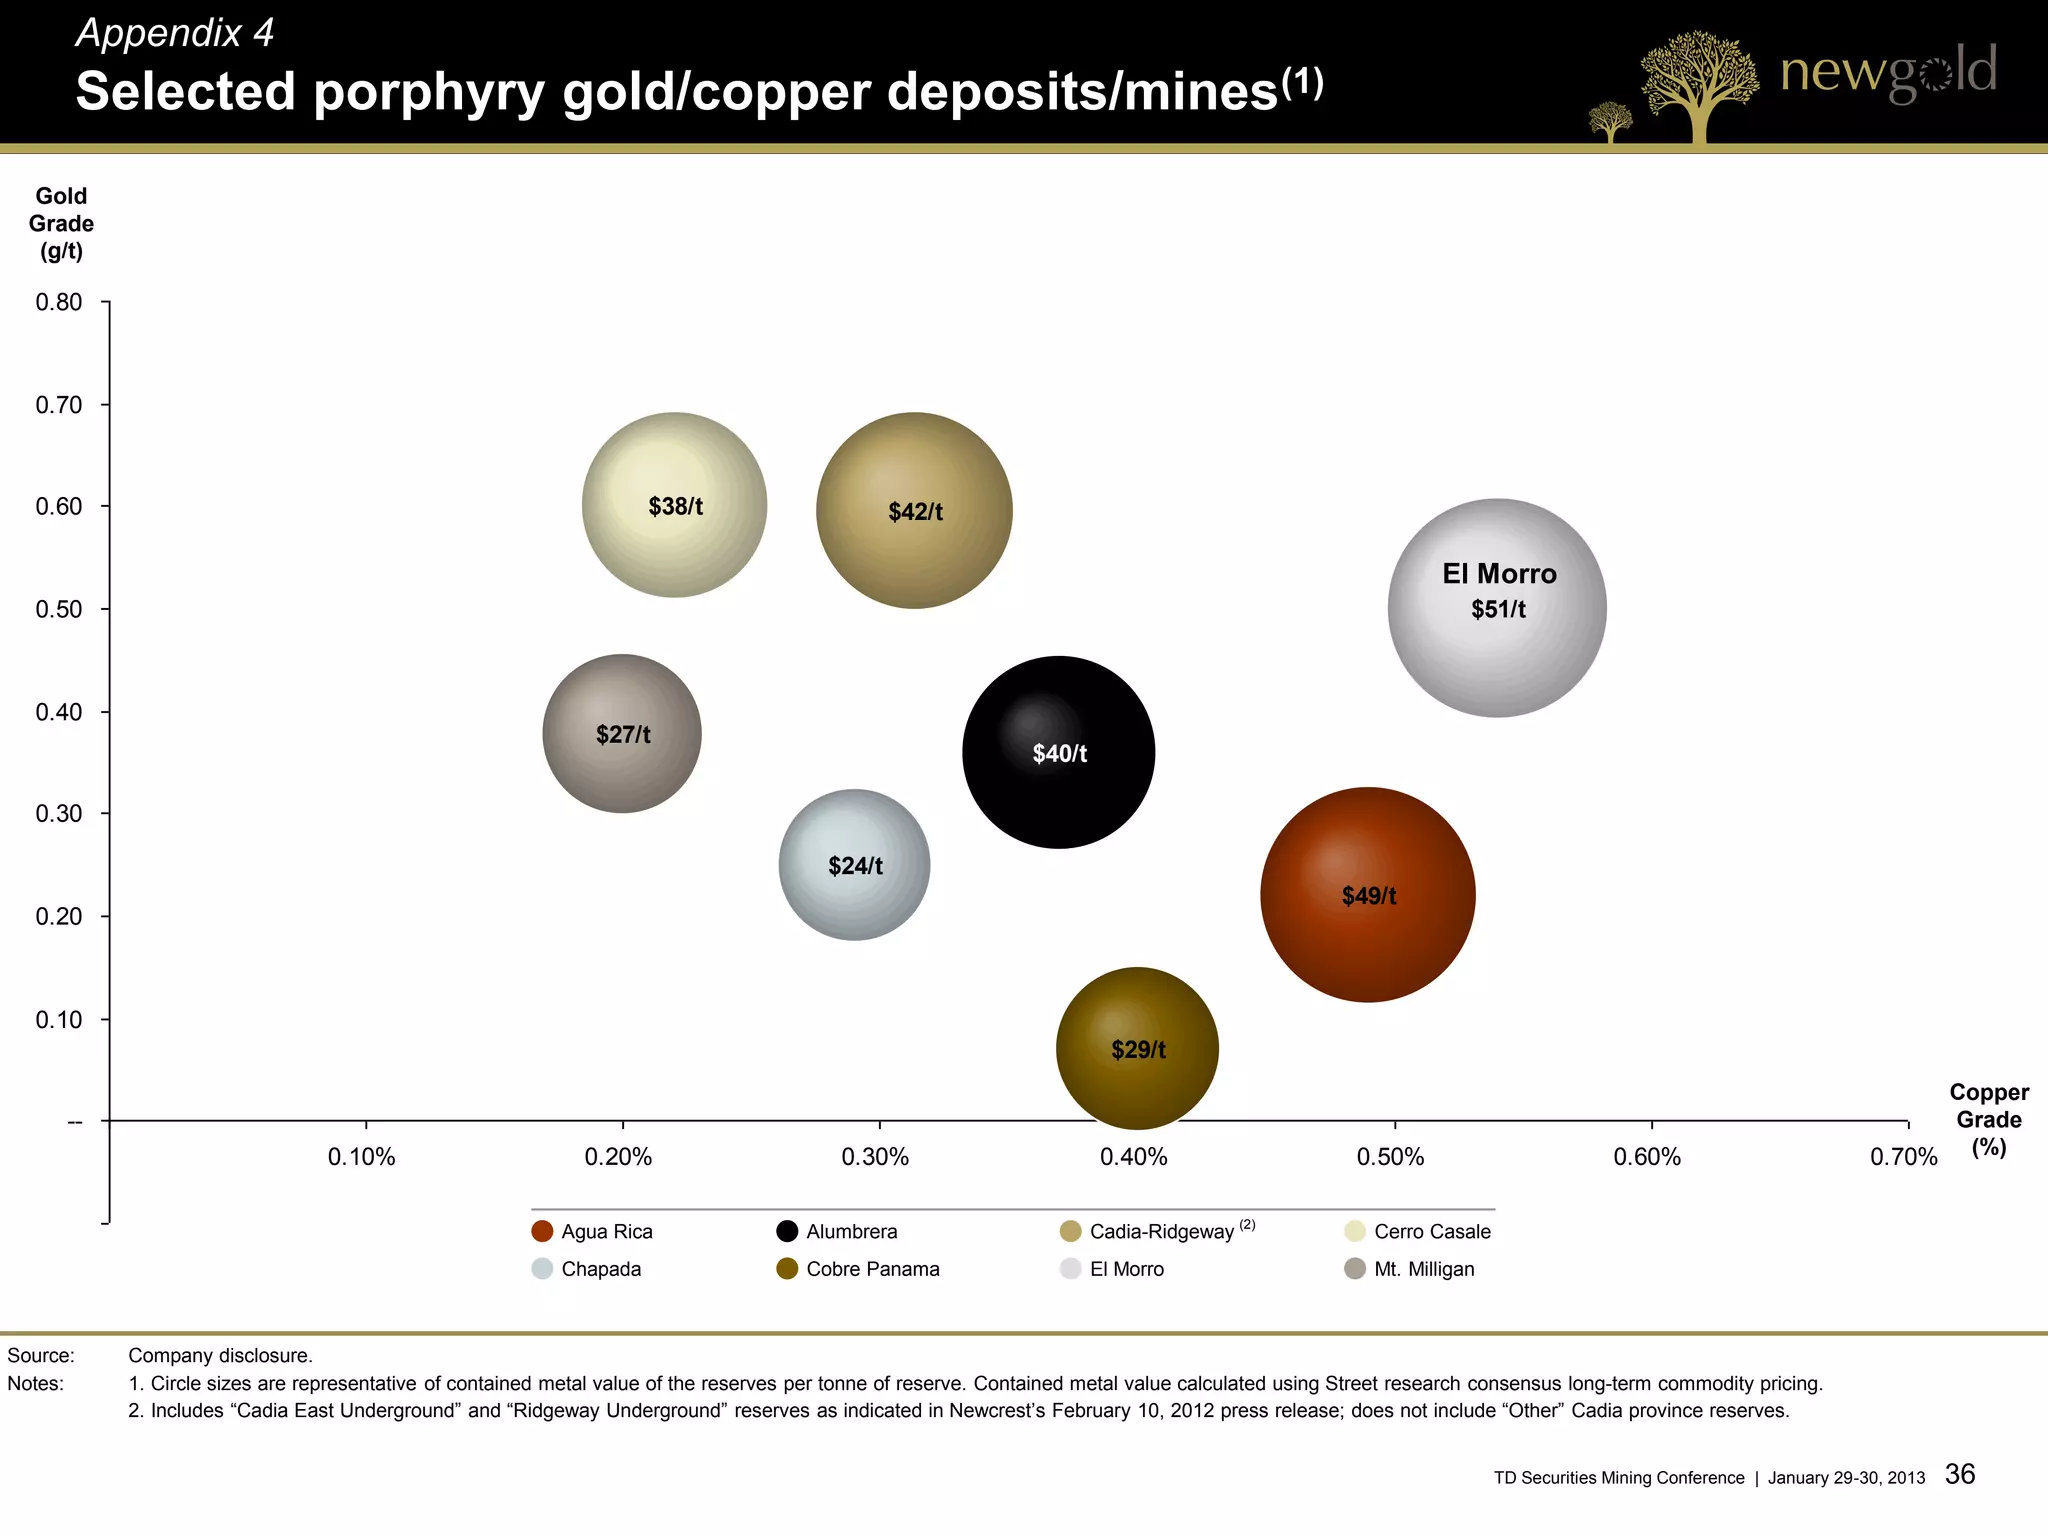
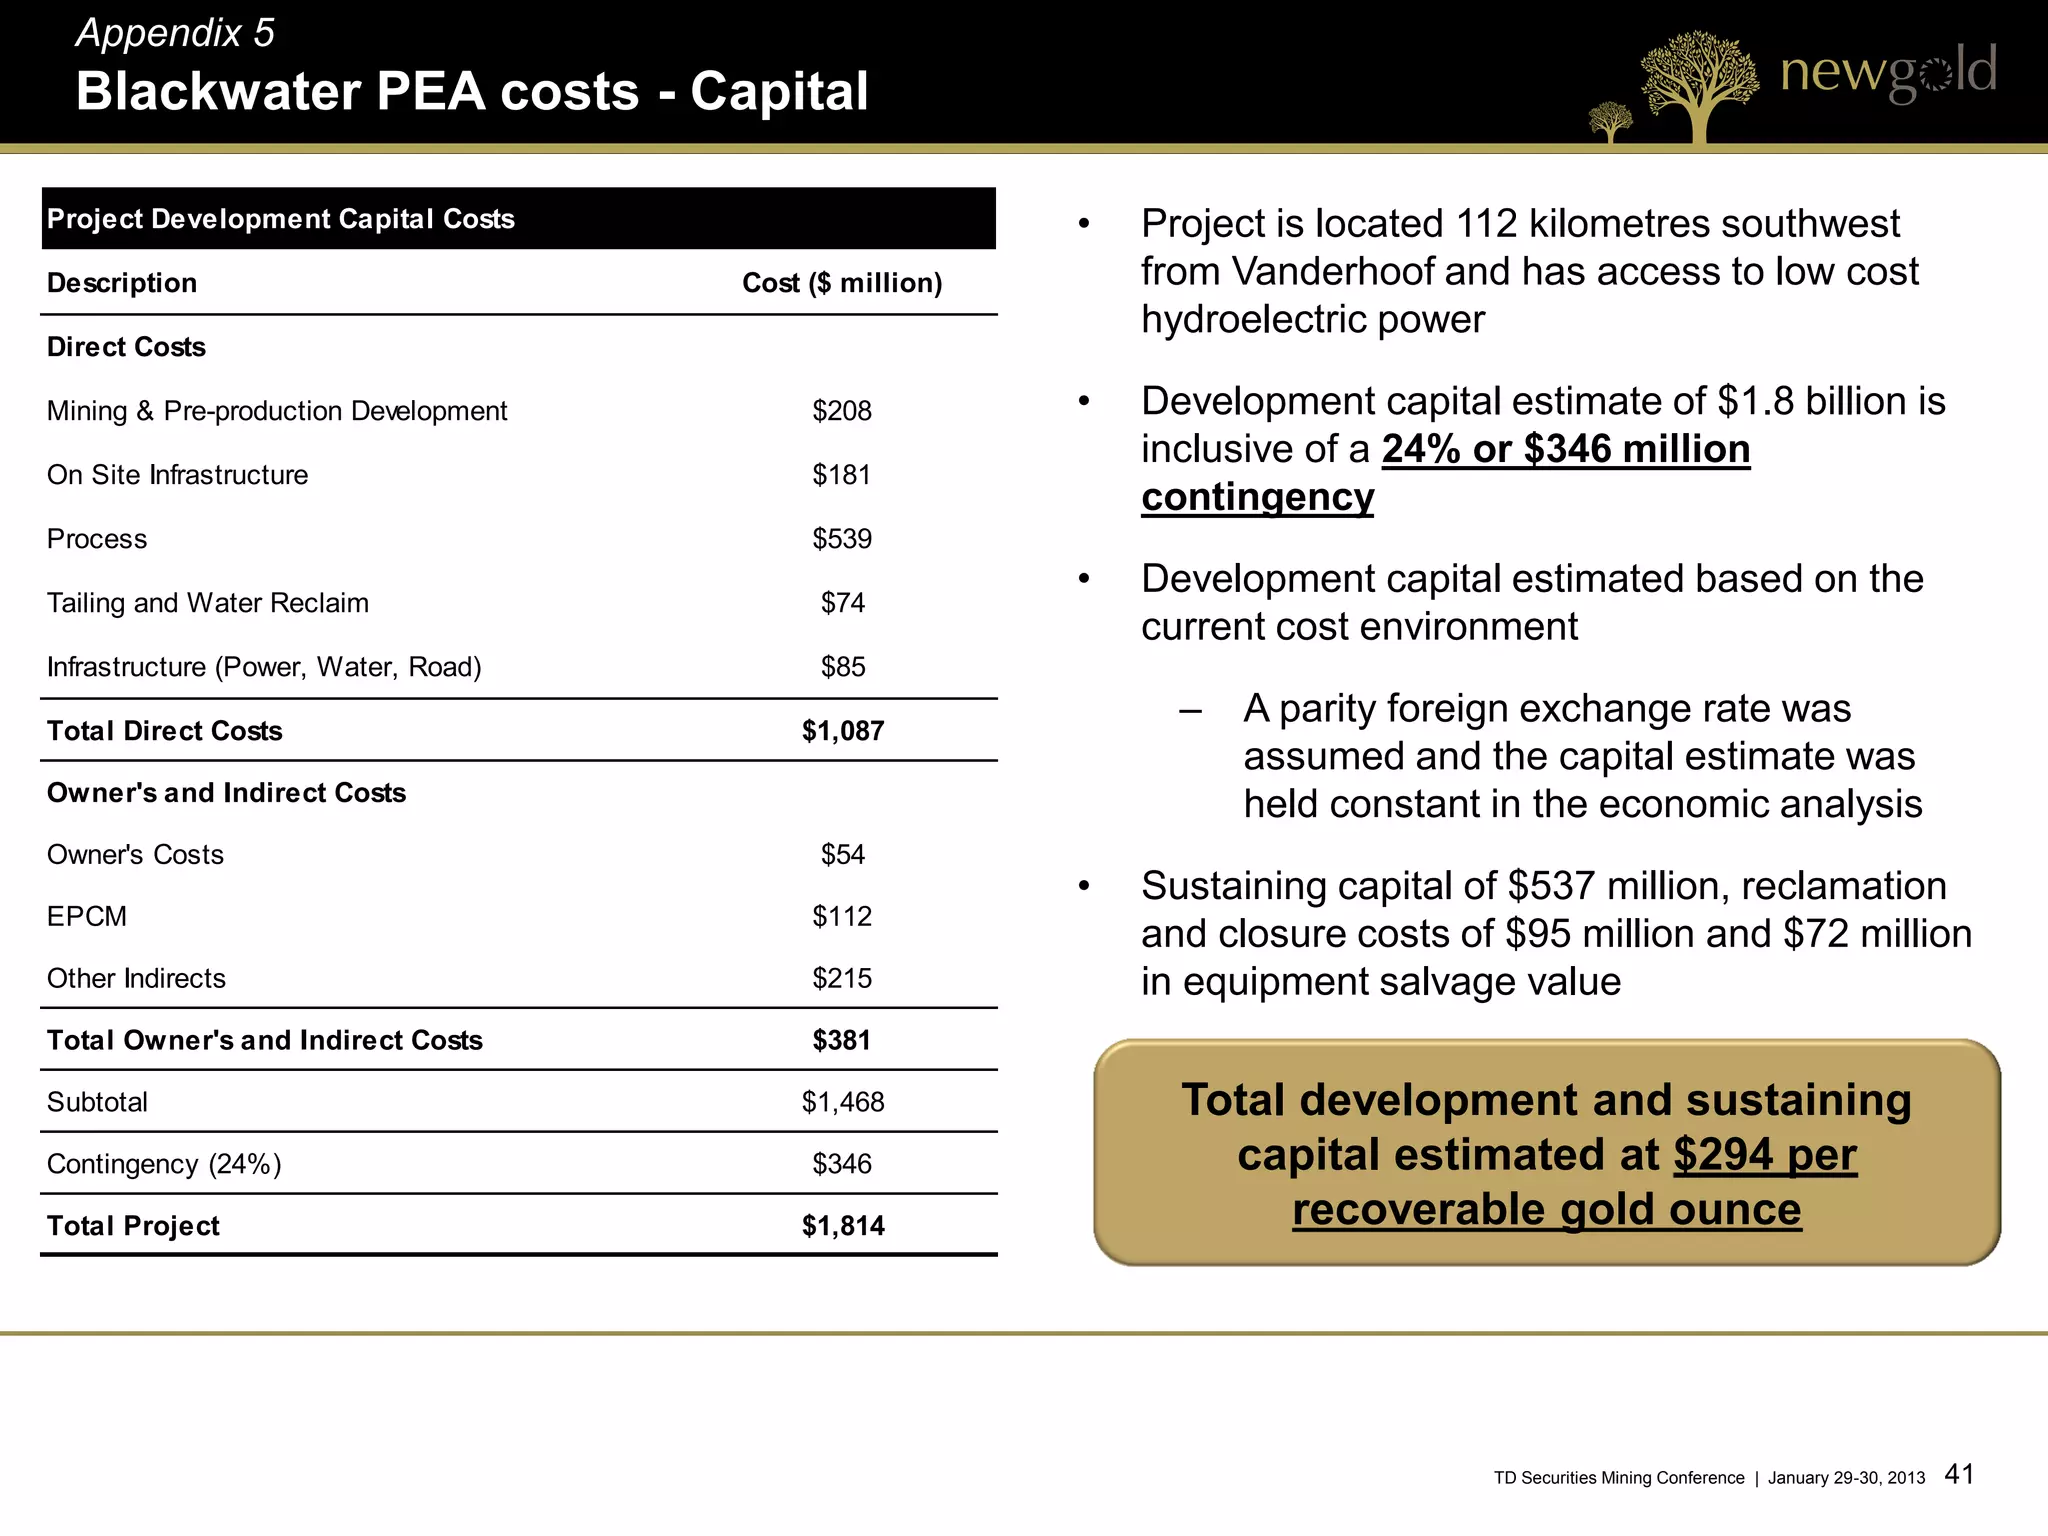
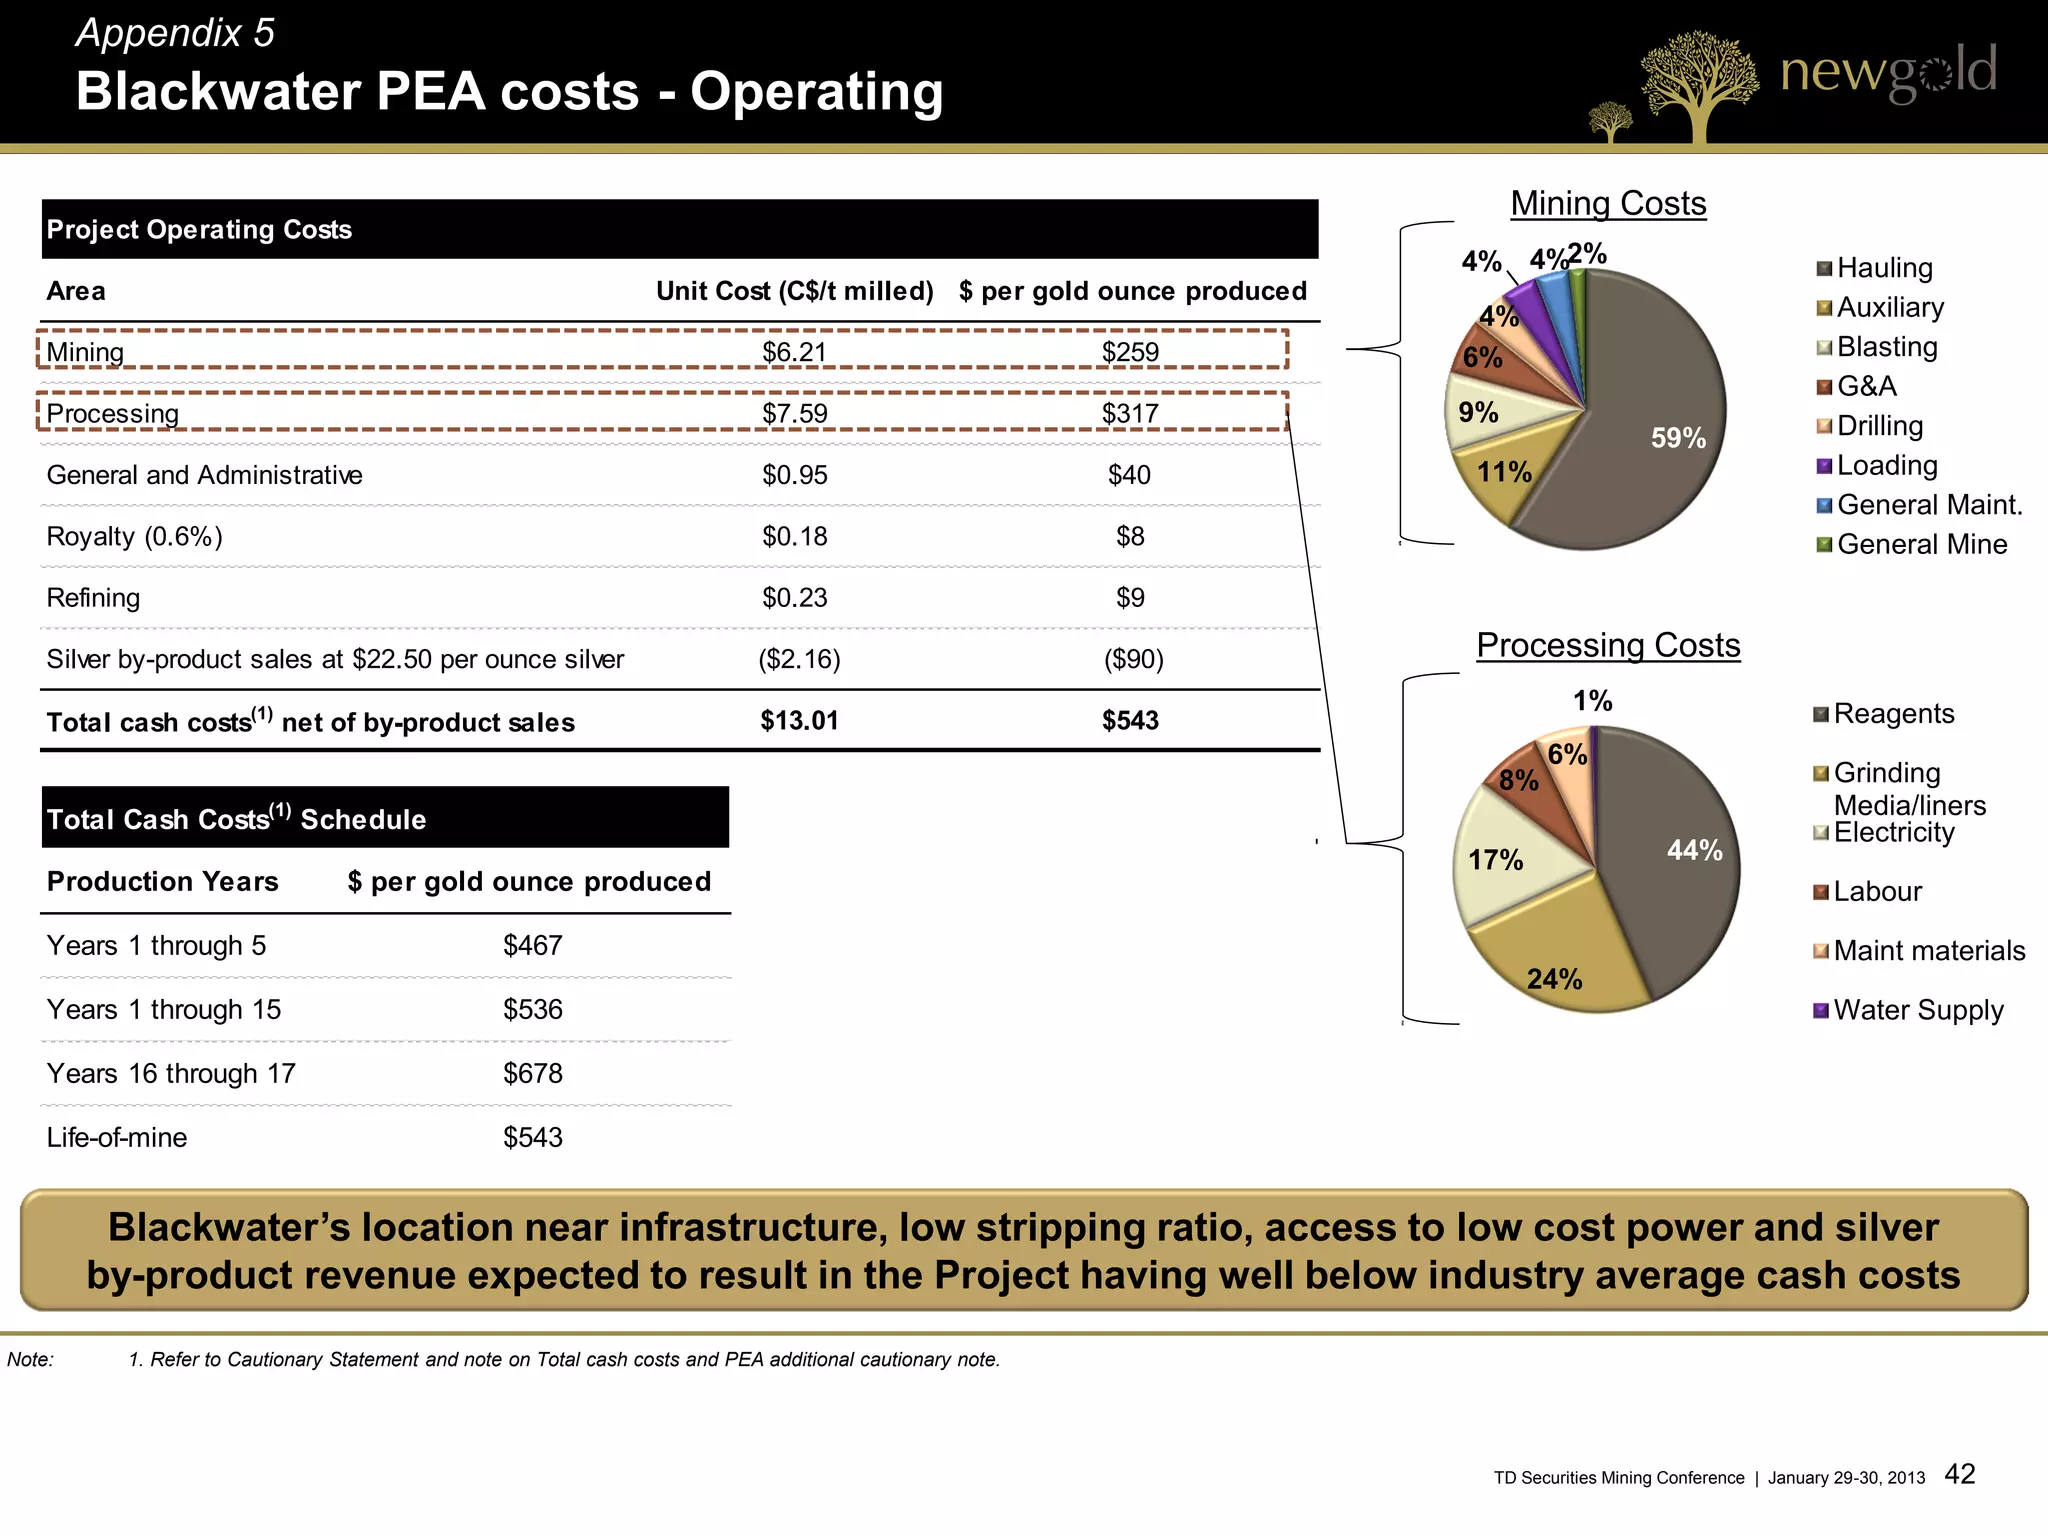
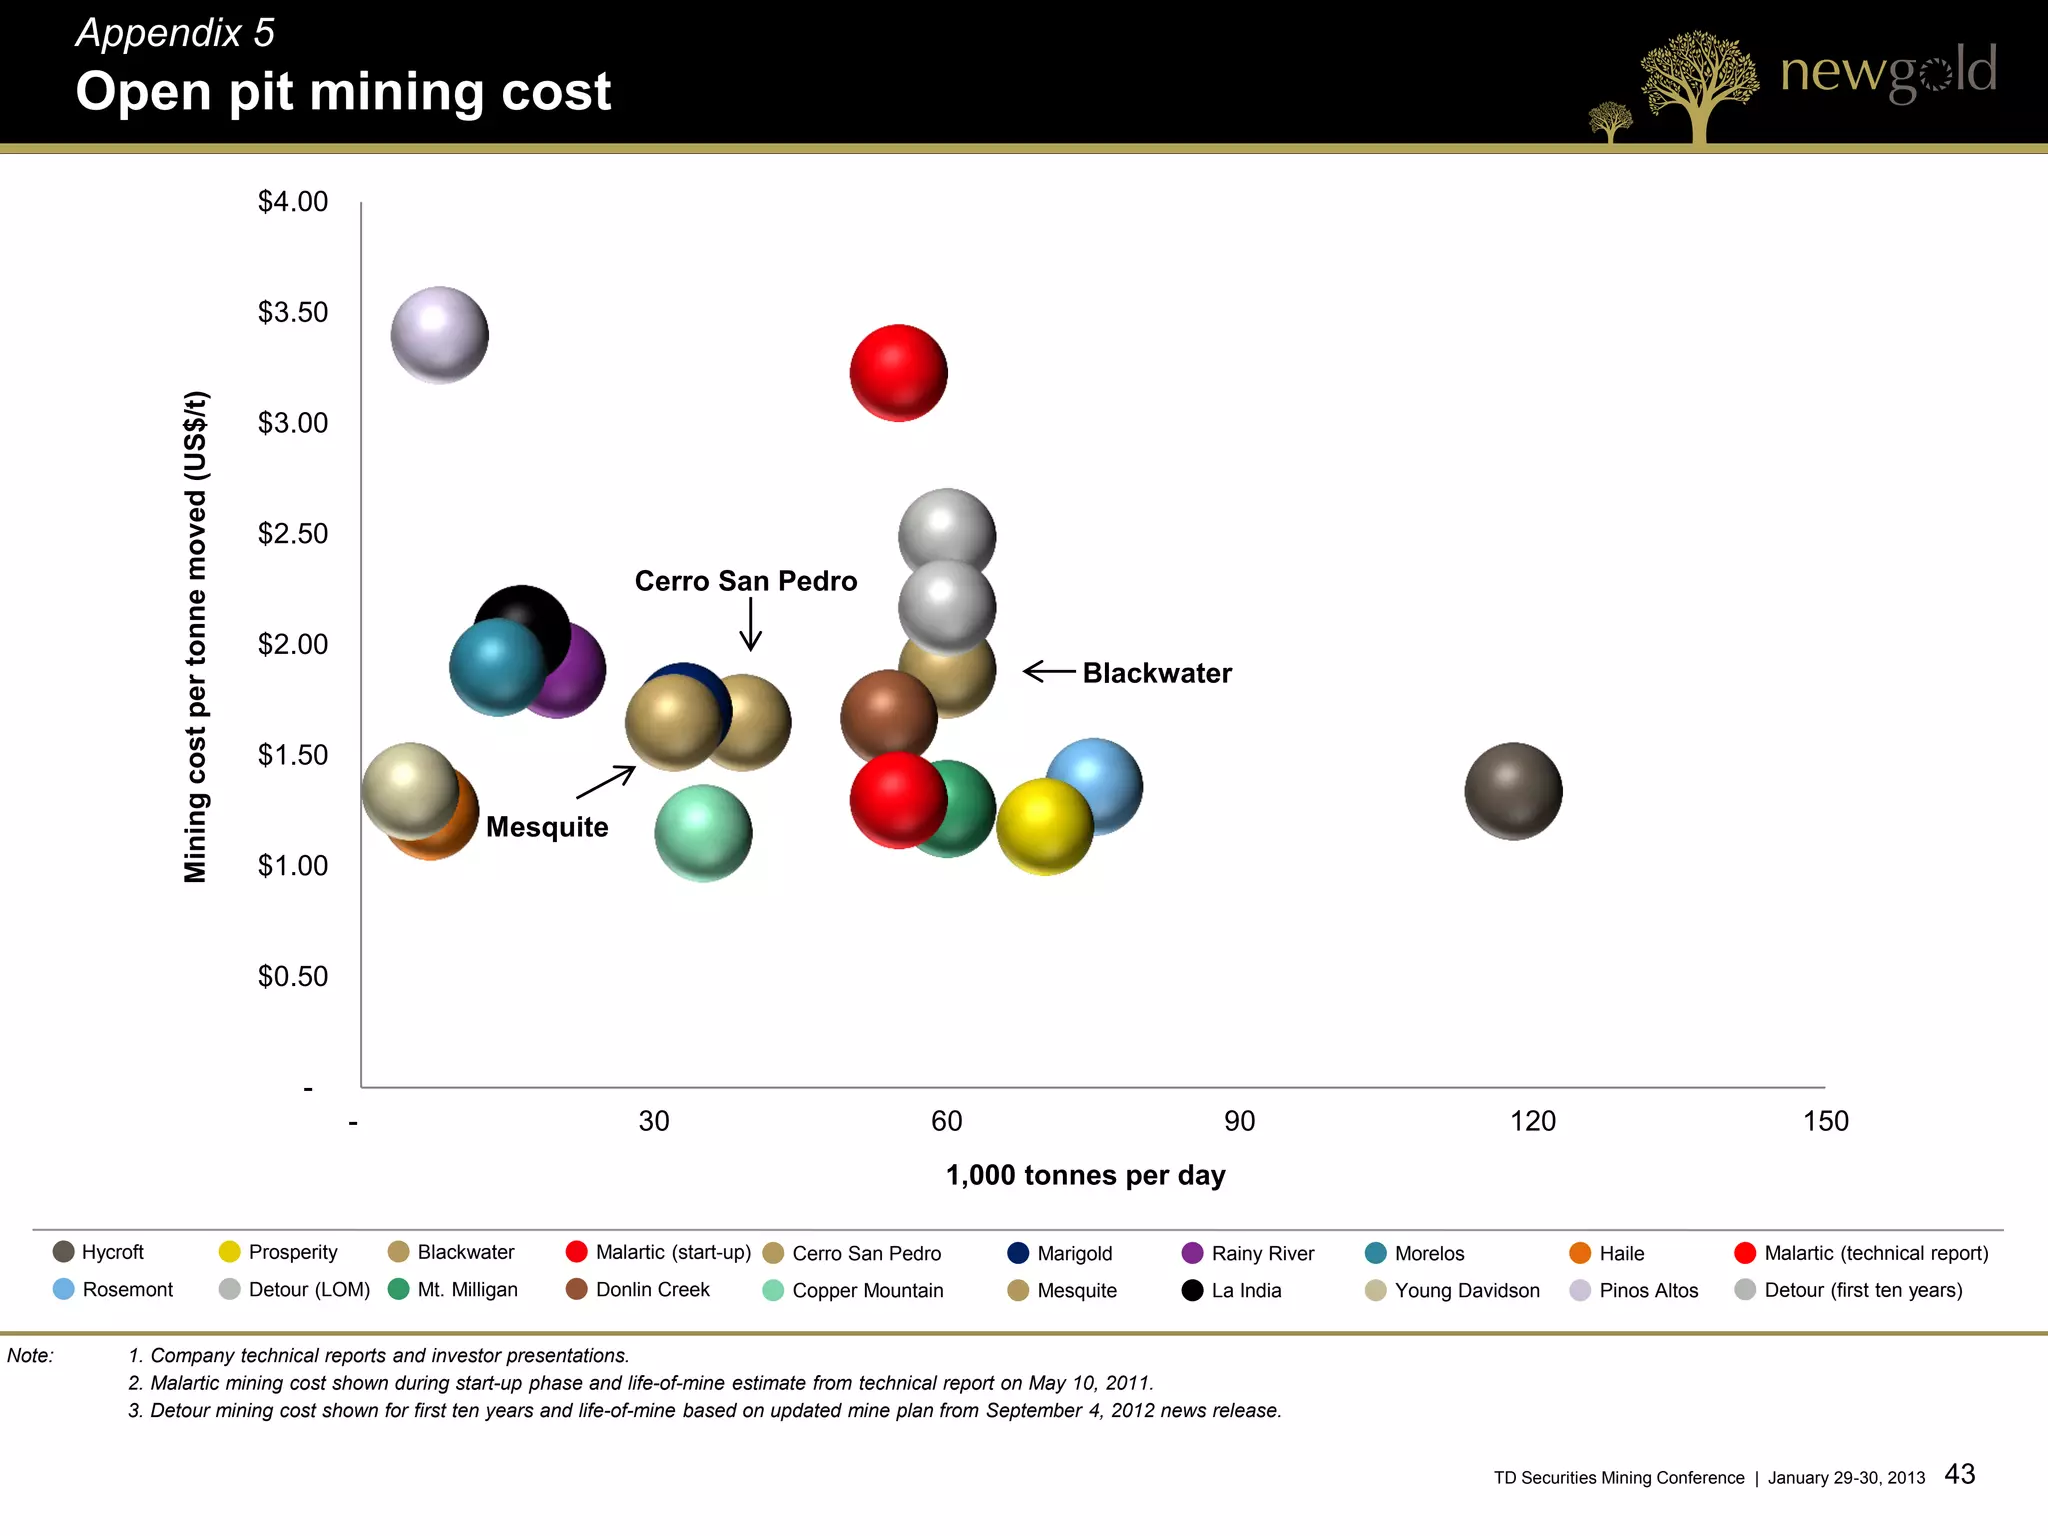
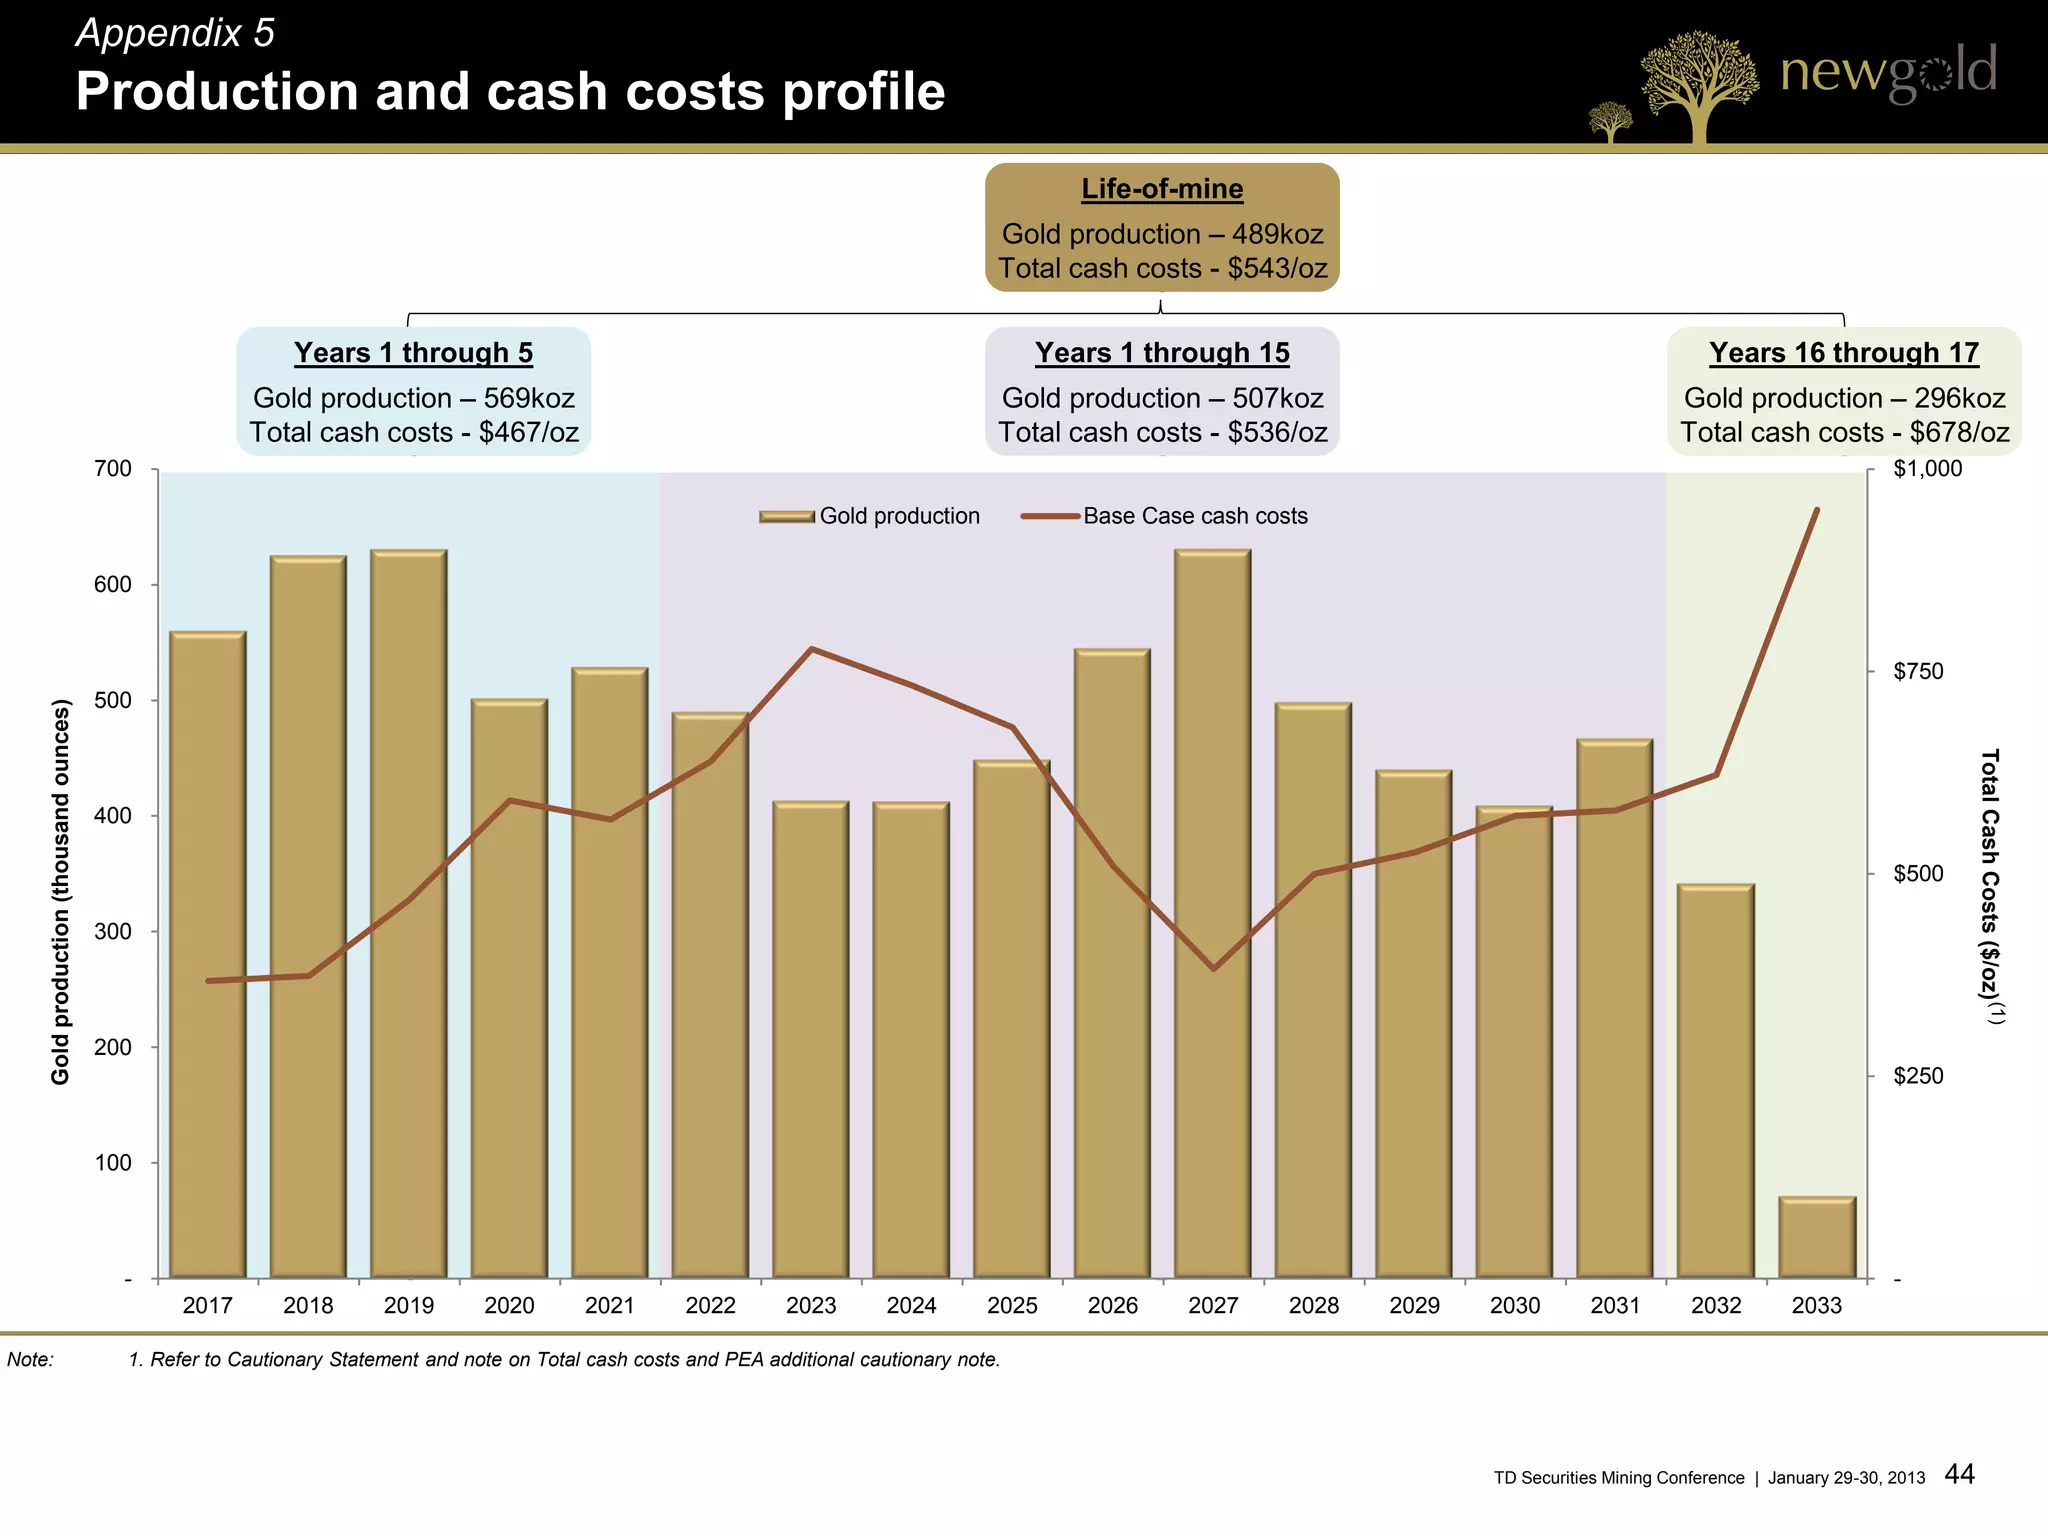
TD Securities Mining Conference | Toronto
             January 29-30, 2013
Cautionary statement

All monetary amounts in U.S. dollars unless otherwise stated
CAUTIONARY NOTE REGARDING FORWARD-LOOKING STATEMENTS
Certain information contained in this presentation, including any information relating to New Gold's future financial or operating performance may be deemed "forward looking". All statements
in this presentation, other than statements of historical fact, that address events or developments that New Gold expects to occur, are "forward-looking statements. Forward-looking statements
are statements that are not historical facts and are generally, but not always, identified by the use of forward-looking terminology such as "plans", "expects", "is expected", "budget",
"scheduled", "estimates", "forecasts", "intends", "anticipates", “projects”, “potential”, "believes" or variations of such words and phrases or statements that certain actions, events or results
"may", "could", "would", “should”, "might" or "will be taken", "occur" or "be achieved" or the negative connotation. All such forward-looking statements are based on the opinions and estimates
of management as of the date such statements are made and are subject to important risk factors and uncertainties, many of which are beyond New Gold's ability to control or predict.
Forward-looking statements are necessarily based on estimates and assumptions that are inherently subject to known and unknown risks, uncertainties and other factors that may cause
actual results, level of activity, performance or achievements to be materially different from those expressed or implied by such forward-looking statements. Such factors include, without
limitation: significant capital requirements; fluctuations in the international currency markets and in the rates of exchange of the currencies of Canada, the United States, Australia, Mexico and
Chile; price volatility in the spot and forward markets for commodities; impact of any hedging activities, including margin limits and margin calls; discrepancies between actual and estimated
production, between actual and estimated reserves and resources and between actual and estimated metallurgical recoveries; changes in international, national and local government
legislation in Canada, the United States, Australia, Mexico and Chile or any other country in which New Gold currently or may in the future carry on business; taxation; controls, regulations and
political or economic developments in the countries in which New Gold does or may carry on business; the speculative nature of mineral exploration and development, including the risks of
obtaining and maintaining the validity and enforceability of the necessary licenses and permits and complying with the permitting requirements of each jurisdiction that New Gold operates,
including, but not limited to obtaining the necessary permits for the Blackwater project, in Mexico where the Cerro San Pedro mine has a history of ongoing legal challenges related to our EIS
and Chile where the courts have temporarily suspended the approval of the environmental permit for the El Morro project; the lack of certainty with respect to foreign legal systems, which may
not be immune from the influence of political pressure, corruption or other factors that are inconsistent with the rule of law; the uncertainties inherent to current and future legal challenges the
company is or may become a party to,; diminishing quantities or grades of reserves; competition; loss of key employees; additional funding requirements; actual results of current exploration or
reclamation activities; changes in project parameters as plans continue to be refined; accidents; labour disputes; defective title to mineral claims or property or contests over claims to mineral
properties. In addition, there are risks and hazards associated with the business of mineral exploration, development and mining, including environmental hazards, industrial accidents, unusual
or unexpected formations, pressures, cave-ins, flooding and gold bullion losses (and the risk of inadequate insurance or inability to obtain insurance to cover these risks) as well as "Risk
Factors" included in New Gold's disclosure documents filed on and available at www.sedar.com. Forward-looking statements are not guarantees of future performance, and actual results and
future events could materially differ from those anticipated in such statements. All of the forward-looking statements contained in this presentation are qualified by these cautionary statements.
New Gold expressly disclaims any intention or obligation to update or revise any forward-looking statements, whether as a result of new information, events or otherwise, except in accordance
with applicable securities laws.


                                                                                                                                                  TD Securities Mining Conference | January 29-30, 2013   2   2
Cautionary statement (cont’d)
CAUTIONARY NOTE TO U.S. READERS CONCERNING ESTIMATES OF MEASURED, INDICATED AND INFERRED RESOURCES
Information concerning the properties and operations discussed in this presentation has been prepared in accordance with Canadian standards under applicable Canadian securities laws, and
may not be comparable to similar information for United States companies. The terms "Mineral Resource", "Measured Mineral Resource", "Indicated Mineral Resource" and "Inferred Mineral
Resource" used in this presentation are Canadian mining terms as defined in accordance with NI 43-101 under guidelines set out in the Canadian Institute of Mining, Metallurgy and Petroleum
("CIM") Standards on Mineral Resources and Mineral Reserves adopted by the CIM Council on December 11, 2005. While the terms "Mineral Resource", "Measured Mineral Resource",
"Indicated Mineral Resource" and "Inferred Mineral Resource" are recognized and required by Canadian regulations, they are not defined terms under standards of the United States
Securities and Exchange Commission. Under United States standards, mineralization may not be classified as a "reserve" unless the determination has been made that the mineralization
could be economically and legally produced or extracted at the time the reserve calculation is made. As such, certain information contained in this presentation concerning descriptions of
mineralization and resources under Canadian standards is not comparable to similar information made public by United States companies subject to the reporting and disclosure requirements
of the United States Securities and Exchange Commission. An "Inferred Mineral Resource" has a great amount of uncertainty as to its existence and as to its economic and legal feasibility. It
cannot be assumed that all or any part of an "Inferred Mineral Resource" will ever be upgraded to a higher category. Under Canadian rules, estimates of Inferred Mineral Resources may not
form the basis of feasibility or other economic studies. Readers are cautioned not to assume that all or any part of Measured or Indicated Resources will ever be converted into Mineral
Reserves. Readers are also cautioned not to assume that all or any part of an "Inferred Mineral Resource" exists, or is economically or legally mineable. In addition, the definitions of "Proven
Mineral Reserves" and "Probable Mineral Reserves" under CIM standards differ in certain respects from the standards of the United States Securities and Exchange Commission.

TECHNICAL INFORMATION
The scientific and technical information in this presentation has been reviewed by Mark Petersen, a Qualified Person under National Instrument 43-101 and an employee of New Gold.

(1) TOTAL CASH COSTS
“Total cash costs” per ounce figures are calculated in accordance with a standard developed by The Gold Institute, which was a worldwide association of suppliers of gold and gold products
and included leading North American gold producers. The Gold Institute ceased operations in 2002, but the standard is widely accepted as the standard of reporting cash cost of production in
North America. Adoption of the standard is voluntary and the cost measures presented may not be comparable to other similarly titled measures of other companies. New Gold reports total
cash costs on a sales basis. Total cash costs includes mine site operating costs such as mining, processing, administration, royalties and production taxes, but is exclusive of amortization,
reclamation, capital and exploration costs. Total cash costs are reduced by any by-product revenue and are then divided by ounces sold to arrive at the total by-product cash costs of sales.
The measure, along with sales, is considered to be a key indicator of a company’s ability to generate operating earnings and cash flow from its mining operations. This data is furnished to
provide additional information and is a non-IFRS measure. Total cash costs presented does not have a standardized meaning prescribed by IFRS and may not be comparable to similar
measures presented by other mining companies. It should not be considered in isolation as a substitute for measures of performance prepared in accordance with IFRS and is not necessarily
indicative of operating costs presented under IFRS. A reconciliation will be provided in the MD&A accompanying the quarterly financial statements.

(2) PEA – ADDITIONAL CAUTIONARY NOTE
This note regarding the preliminary economic assessment (PEA) is in addition to cautionary language already included within the presentation as required under NI 43-101. The Blackwater
PEA is preliminary in nature and includes Inferred mineral resources that are considered too speculative geologically to have the economic considerations applied to them that would enable
them to be categorized as mineral reserves, and there is no certainty that the PEA based on these mineral resources will be realized. Mineral resources that are not mineral reserves do not
have demonstrated economic viability.


                                                                                                                                                TD Securities Mining Conference | January 29-30, 2013   3   3
The evolution of New Gold


                                                                          Successfully commissioning New
                                                                                        Afton
                                         Further strengthening team

   History of accretive growth                                             Developing world-class assets

                                             Growing resources
                                                                             Doubling gold production
Track record of delivering on plans
                                                                                    organically
                                      Lowering costs, expanding margins
                                          and increasing cash flow
                                                                             Increasing net asset value


                                                                                                Blackwater – Summer 2012


                                                                              TD Securities Mining Conference | January 29-30, 2013   4   4
History of accretive growth

                                                  NGD               Gold Price               S&P/TSX Gold Index                    FTSE Gold Mines Index         HUI Index
     500%


     450%                                                                                                        Closing of
                                                                                                                  Richfield
                                                                                                                 acquisition
     400%


     350%
                            Completed $1.2bn
                                business                                                                                                                                                                              +214%
     300%                   combination with
                            Western Goldfields

     250%


     200%
                                                                                                                                                                                                                       +70%

     150%                                                                                                                                                                                                               (1%)


     100%                                                                                                                                                                                                              (12%)


                                                                                                                                                                                                                       (16%)
          50%


          0%
                 1-Jun-09


                                                                                                                                                           2-Apr-12
                                      27-Oct-09


                                                        24-Mar-10


                                                                                                     14-Jan-11


                                                                                                                       11-Jun-11


                                                                                                                                                                                                          23-Jan-13
                                                                                 19-Aug-10


                                                                                                                                                                                   28-Aug-12
                                                                                                                                               6-Nov-11


                                                                                                                                                                                                          28-Jan-13
Source:     1.   Bloomberg. All amounts in USD.
Note:       2.   S&PTSX Gold Index includes 59 gold companies in various stages of development/production.
            3.   FTSE Gold Mines Index includes 26 gold producing companies.
            4.   HUI Index includes 15 of the major global gold producers.
                                                                                                                                                                      TD Securities Mining Conference | January 29-30, 2013   5   5
Project development and operational execution
     Gold production(1) (000s ounces)
             450
             400                                                                                                                                        405-445
             350                                                                                383                      387
             300
             250                                                            302
             200           233
             150
             100
              50
               0
                          2008                           2009               2009      2010      2010      2011          2011                              2012
                         Actual                        Guidance            Actual   Guidance   Actual   Guidance       Actual                           Guidance

     Total cash cost(1)(2) ($/oz)

           $600

           $500           $566

           $400                                                            $465                                         $446
                                                                                               $418                                                    $410-430
           $300

           $200

           $100

               $0         2008                           2009               2009      2010      2010      2011          2011                              2012
                         Actual                        Guidance            Actual   Guidance   Actual   Guidance       Actual                           Guidance


         Successfully brought Cerro San Pedro, Mesquite and New Afton into production on, or ahead of, schedule

Notes:     1. Refer to Cautionary Statement and note on Total cash cost.
           2. 2009 and 2008 costs shown based on Canadian GAAP.


                                                                                                                   TD Securities Mining Conference | January 29-30, 2013   6   6
Management and Board of Directors

EXECUTIVE MANAGEMENT TEAM              BOARD OF DIRECTORS

Randall Oliphant, Executive Chairman   David Emerson, Former Canadian Cabinet Minister


Robert Gallagher, President & CEO      James Estey, Former Chairman UBS Securities Canada


Brian Penny, Executive VP and CFO      Robert Gallagher, President & CEO


Ernie Mast, VP Operations              Vahan Kololian, Founder Terra Nova Partners


                                       Martyn Konig, Former Executive Chairman European Goldfields


                                       Pierre Lassonde, Chairman Franco-Nevada


                                       Randall Oliphant, Executive Chairman


                                       Raymond Threlkeld, CEO Rainy River Resources


                                                                    TD Securities Mining Conference | January 29-30, 2013   7   7
Growing resource base in solid jurisdictions

     Measured & Indicated Gold Resources per 1,000 shares

    50


    40

                                                                                                                   Blackwater

    30
                                                                                                                        New Afton

                                                                                                                                                                                                        Cerro San
    20                                                                                                                                                                                                   Pedro
                                                                                                                                     Mesquite


    10


     -
                        (1)
                 2009                   2010                   2011                   Today
                                                                                                                                                              El Morro(3)

            Track record of increasing M&I gold                                                                                                                                                              Operating assets

              resources on a ‘per share’ basis                                                                    Peak Mines
                                                                                                                                                                                                             Development projects


Notes:    1. Excludes resources from Amapari which was sold in April 2010.
          2. Refer to Appendix 6 for detailed disclosure on Reserve and Resource calculations. Measured and Indicated Resources inclusive of Reserves, and Capoose Indicated Resources of 384koz.
          3. New Gold holds a fully carried 30% interest in the El Morro project.


                                                                                                                                                                 TD Securities Mining Conference | January 29-30, 2013   8      8
Cost trends: New Gold versus industry(1)(2)
                                   $800                                                                                                                                                  (1)
                                                                                                                                                                                $736


                                                                                                                                           $643
  Total Cash Costs (US$/oz)(2)


                                   $600                            $566                                                            $557

                                                                                                          $478

                                                                    $464                                  $465
                                   $400                                                                                                    $446
                                                                                                                                   $418                                   $410-$430


                                   $200
                                                                    2008                                   2009                    2010    2011                               2012E


                                                                               New Gold provides leverage to gold price

                                    Margin                                                                                 +241%
                                   (US$/oz)
                                                                   $297                                                                   $1,014
                                  Gold price                                                                               +69%
                                   (US$/oz)                        $863                                                                   $1,460
Notes:                             1. Industry data per GFMS reports calculated net of by-product credits as at Q3’2012.
                                   2. Refer to Cautionary Statement and note on Total cash cost.


                                                                                                                                             TD Securities Mining Conference | January 29-30, 2013   9   9
New Afton - Successfully commissioned

   Highlights                                                                                                                         Reserves(1)
   •      Located 10 kilometres from Kamloops, British
          Columbia                                                                                                           Gold                                  Copper
   •      Dedicated labour force

   •      Commercial and full production achieved ahead                                                                     1 Moz                                    1 Blbs
          of schedule

   •      Potential to double New Gold’s cash flow at
          today’s prices

                                                                                                                                 Production and Costs

                                                                                                                       LOM Average Annual                 LOM Cash Costs(2)
                                                                                                                          Production
                                                                                                                                                           ($1,750)/oz                  by-product
                                                                                                                              Gold
                                                                                                                             85Koz
                                                                                                                                                             $525/oz
                                                                                                                                                                                      co-product(3)
                                                                                                                            Copper                           $1.15/lb
                                                                                                                            75Mlbs
   Extracting ore from underground

Notes:     1. Refer to website for detailed disclosure on Reserve and Resource calculations.
           2. Refer to Cautionary Statement and note on Total cash cost.
           3. Co-product cash cost calculated based on relative percentage of gold and copper revenue, respectively.


                                                                                                                                            TD Securities Mining Conference | January 29-30, 2013   10 10
New Afton – Looking to unlock additional value

                                                Value Enhancement Opportunities


                                                      C-Zone exploration


           Mill building
                                               Mill optimization beyond 11,000 tpd


                                           Regional exploration – 111km2 land package


Conveyor                   Ore stockpile


                                                             TD Securities Mining Conference | January 29-30, 2013   11 11
El Morro (30%) – A world class project

                             El Morro (30%)
                                                                                                                                           Gold Reserve(1)
                                                                                                                                                     2.5 Moz
                                                                                                                                       Copper Reserve(1)
                                                                                                                                                     1.9 Blbs

                                                                                                             •      On June 27, 2012 Ontario Superior Court of Justice
                                                                                                                    validated New Gold/Goldcorp partnership at El
                                                                                                                    Morro
    Location                                                           Chile                                 •      Capital fully-funded by 70% partner Goldcorp
    Mine type                                                          Open Pit                              •      1.2 Moz inferred gold resource at higher gold and
    Reserves1 – Gold/Copper (Moz/Mlbs)                                 2.5/1,868                                    copper grades in deeper portion of La Fortuna
                                                                                                                    deposit
    Resources1 – Gold/Copper (Moz/Mlbs)                                3.0/2,193
                                                                                                             •      Current Resource entirely within La Fortuna deposit
    Estimate mine life                                                 17 years
                                                                                                             •      Neighbouring El Morro deposit underexplored
    LOM production/yr (Au koz/Cu                     Mlbs)2            90/85
                                                                                                             •      Addressing recent temporary suspension of
    LOM cash cost/oz co-product                    (Au/Cu)3            $550/$1.45                                   environmental permit

Notes:     1. Refer to Appendix 6 for detailed disclosure on Reserve and Resource calculations. Measured and Indicated Resources inclusive of Reserves. El Morro Reserves and Resources shown on attributable 30% basis.
           2. Refer to Cautionary Statements.
           3. Refer to Cautionary Statements and note on Total cash cost. Life of mine co-product costs based $1,200/oz gold and $2.75/lb copper.


                                                                                                                                                                TD Securities Mining Conference | January 29-30, 2013   12 12
Blackwater – A robust project

                                       Blackwater
                                                                                                                              Preliminary Economic Assessment


                                                                                                                    Average Annual Gold Production(3)
                                                                                                                                              507,000 ounces


                                                                                                                              Average Total Cash Costs(3)
                                                                                                                                               $536 per ounce

                                                                                                              •      Consolidated significant land position – 1,000km2

                                                                                                              •      Year-round accessibility for drilling/development
    Location                                                                Canada
                                                                                                              •      Central British Columbia near infrastructure
    Proposed mine type                                                      Open Pit                          •      Ability to fund continued exploration/development
    M&I   Resources1          – Gold/Silver (Moz)                           7.5/36.9                                 internally
    Inferred Resources1 – Gold/Silver (Moz)                                 2.7/28.3                                      –      Development capital $1.8 billion including 24%,
                                                                                                                                 or $346 million contingency
    Targeted production2                                                    2017
                                                                                                              •      Tax synergies with New Afton
Notes:     1. Refer to Appendix 6 for detailed disclosure on Reserve and Resource calculations.
           2. Blackwater start date based on indicative timeline which is dependent on continued exploration success, environmental approvals and the determination that the deposit is economically viable.
           3. Averages based on first 15 years of production. Refer to Cautionary Statement and note on Total cash costs and PEA additional cautionary note.


                                                                                                                                                                     TD Securities Mining Conference | January 29-30, 2013   13 13
Preliminary Economic Assessment (“PEA”) in review (1)

                                                                                                                            Spot Case
                                                                                      Base Case
                                                                                                                        September 20, 2012

                        Gold Price (US$/oz)                                            $1,275                  $1,600        $1,775                      $1,800

                        Silver Price (US$/oz)                                          $22.50                  $30.00        $34.50                      $35.00

                        US$/CDN$ Foreign Exchange                                        0.94                   0.97          1.00                         1.00

                        5% NPV ($ billions) (2015)
                            Pre-tax NPV                                                   1.7                   3.3            4.2                          4.3
                            After-tax NPV                                                 1.1                   2.2            2.8                          2.9
                        IRR (%)
                            Pre-tax IRR                                                  16.4                   25.9          30.4                         31.1
                            After-tax IRR                                                14.0                   22.0          25.8                         26.4
                        Payback period (years)
                            Pre-tax payback period                                        4.7                   3.0            2.6                          2.5
                            After-tax payback Period                                      4.8                   3.1            2.7                          2.6


        Highlights
        • Initial gold production targeted for 2017
        • First five years – average annual gold production of 569,000 ounces at total cash costs(1) per ounce sold,
           net of by product sales, of $467 per ounce

          Blackwater expected to generate solid economic returns in current capital cost environment, even when
                             using a long-term gold price assumption of US$1,275 per ounce

Note:      1. Refer to Cautionary Statement and note on Total cash costs and PEA additional cautionary note.


                                                                                                                                       TD Securities Mining Conference | January 29-30, 2013   14 14
Blackwater – Area map


                                            ~112km to
                                            Vanderhoof

       Capoose
       Resource
                               Blackwater                    ~160km to
                                 Project                   Prince George


50km


                       Current
                    resource grid


                                       80km


                                                         TD Securities Mining Conference | January 29-30, 2013   15 15
Blackwater – Indicative timeline

   •      Remains unchanged from mid-2011 targeted timeline

                                                                                        2012                    2013                   2014                  2015                     2016                  2017
            Development activity                                                   H1          H2          H1          H2         H1          H2        H1          H2         H1            H2        H1          H2
            First Nations & Public Consultation

            Drilling

            Preliminary Economic Assessment

            Base Line Environmental Studies

            Project Description/Terms of Reference

            Environmental Assessment Reports

            Provincial Approval

            Federal Approval

            Feasibility Study

            Engineering Procurement

            Construction

            Production Target


                                                                                               Reflects critical path in timeline


Notes:     1. Indicative timeline is dependent on permit approvals. There is no assurance this timeline will be achieved nor that the deposit will ever reach the production stage.


                                                                                                                                                                         TD Securities Mining Conference | January 29-30, 2013   16 16
A future of growth

•    El Morro and Blackwater expected to double New Gold’s gold production by 2017 at low cost

                                           1,000


                                            800
       Gold production (thousand ounces)


                                            600                        2013 Guidance -
                                                                       February 5, 2013
                                                                          ~450 - 500
                                                           405 - 445
                                            400     387


                                            200


                                                   2011A    2012E          2013E                            2017E


                                                                                          TD Securities Mining Conference | January 29-30, 2013   17 17
Net asset value per share appreciation
                 Net Asset Value(1)                                                                $15.00                                                                                                           High
                                                                                                                                         Share price                                                                ~1.5x
          6/1/09                             Today                                                                                       NAVPS
                                                                                                                                                                                                 Closing of
                                                                                                   $13.00                                P/NAV                                                   Richfield                                                             Current
                                                                                                                                                                                                 acquisition                                                            ~0.9x
    Mesquite, Cerro San Pedro, Peak

                                                                                                   $11.00                                                                        High
          ~ $875                            $1,775                                                                     Completed $1.2bn                                          ~1.5x


                                                                         US$ NAV and Share price
                                                                                                                       business
                                                                                                                       combination with
                                                                                                                       Western Goldfields
                       New Afton                                                                    $9.00


                                                                                                                                                             High
          ~ $120                            $1,491                                                                                                           ~1.5x
                                                                                                    $7.00                                                                                                                                         Low
                                                                                                                                                                                                                                                  ~0.7x

                       El Morro(2)
                                                                                                                           High
                                                                                                    $5.00                  ~1.5x

          ~ $40                               $694                                                                                                                                                     349% increase in NAVPS

                                                                                                    $3.00
                    Blackwater(3)                                                                                                                                                                   214% increase in share price


           $--                              $1,451                                                  $1.00
                                                                                                            1-Jun-09


                                                                                                                                                                                                                                           2-Apr-12


                                                                                                                                                                                                                                                                          23-Jan-13
                                                                                                                                                 24-Mar-10


                                                                                                                                                                                     14-Jan-11


                                                                                                                                                                                                        11-Jun-11
                                                                                                                                                                     19-Aug-10


                                                                                                                                                                                                                                                          28-Aug-12
                                                                                                                             27-Oct-09


                                                                                                                                                                                                                            6-Nov-11


                                                                                                                                                                                                                                                                          28-Jan-13
Source:    Broker Reports, Company Estimates and Announcements, Bloomberg.
Notes:     1. Street consensus NAV.
           2. Current street consensus NAV for El Morro; Includes $50mm cash payment received from Goldcorp as part of transaction consideration.
           3. New Gold purchased Richfield for C$480 million and Silver Quest for C$110 million. The deals closed on June 1, 2011 and December 23, 2011, respectively.

                                                                                                                                                                                                               TD Securities Mining Conference | January 29-30, 2013    18 18
The New Gold investment thesis

         EXPERIENCED BOARD AND MANAGEMENT


 FULLY FUNDED COMPANY WITH STRONG BALANCE SHEET


DIVERSIFIED ASSET BASE IN MINING FRIENDLY JURISDICTIONS


  ORGANIC GROWTH OPPORTUNITIES/METAL OPTIONALITY


        PRODUCTION GROWTH/MARGIN EXPANSION


         INCREASING UNDERLYING ASSET VALUE


                 MULTIPLE CATALYSTS


         COMPELLING INVESTMENT PROPOSITION


                                                   TD Securities Mining Conference | January 29-30, 2013   19 19
Appendix


           Appendices

                                            Page

           1. Financial information           21

           2. Operating performance           27

           3. New Afton                       30

           4. El Morro                        35

           5. Blackwater                      38

           6. Reserves and resource notes     58

           7. Commodity price/foreign         63
              exchange assumptions


                                                   TD Securities Mining Conference | January 29-30, 2013   20 20
Appendix 1
         Summary of debt

                                                         Undrawn Credit         Senior Notes            Senior Notes                El Morro
                                                         Facility               (April 2012)            (November 2012)             Funding Loan

                      Face Value                         $150 million(1)        $300 million            $500 million                $56 million
                      Maturity                           3 years with annual    April 15, 2020          November 15, 2022           n/a
                                                         extensions permitted
                      Interest Rate                      See ‘Key features’     7.00%                   6.25%                       4.58%
                      Payable                            Revolving credit       Semi-annually           Semi-annually               Upon start of
                                                                                                                                    production
                      Conversion price                   n/a                    n/a                     n/a                         n/a
                      Current trading                    n/a                    ~106                    ~102                        n/a
                      value
                      Key features                       Normal financial       • Senior unsecured      • Senior unsecured          New Gold to
                                                         covenants              • Redeemable after      • Redeemable after          repay Goldcorp
                                                                                  April 15, 2016 at       November 15, 2017         out of 80% of its
                                                         Interest Rate            103.5% down to          at par plus half          30% share of
                                                         • 3% over LIBOR          100% of face after      coupon, declining         cash flow once El
                                                            based on ratios       2018                    ratably to par            Morro starts
                                                         • Standby fee of       • Unlimited dividends   • Unlimited dividends       production
                                                            0.75%                 if leverage ratio       if leverage ratio
                                                                                  below 2:1               below 2:1


Notes:     1. $50 million currently allocated for Letters of Credit.


                                                                                                                          TD Securities Mining Conference | January 29-30, 2013   21 21
Appendix 1
           Trend of expanding margins continues


           $1,800
                                                                                               $1,575                         $1,560
           $1,600                                                                     $1,460            $1,486
                                                                                               $1,032                          $1,117
           $1,400                                                                     $1,014            $1,014
                                                                                                                                                         Realized gold price
                                                                             $1,194                                                                      (US$/oz)

           $1,200
                                                      $987                    $766                                                                       Margin
                                                                                                                                                         (US$/oz)
           $1,000             $863
  US$/oz


                                                       $522
                                                                                                                                                         Cash Cost(1)
            $800              $297                                                                                                                       (US$/oz)


            $600
                              $566                                                              $543
            $400                                       $465                            $446              $472                    $443
                                                                              $428

            $200

              $0
                             2008A                    2009A                  2010A    2011A    Q1'12     Q2'12                  Q3'12
Note:        1. Refer to Cautionary Statement and note on Total cash cost.


                                                                                                                TD Securities Mining Conference | January 29-30, 2013   22 22
Appendix 1
  2012 third quarter financial highlights

           Earnings from Mine Operations                          Adjusted Net Earnings per Share
                     ($ millions)                                          ($ per share)

$100                                                    $0.15
         $77          $76         $78         $76                                                                            $0.11
 $75                                                                        $0.10                  $0.10
                                                        $0.10   $0.09

 $50
                                                        $0.05
 $25

  -                                                        -
        Q3'12        Q2'12       Q1'12       Q3'11              Q3'12       Q2'12                  Q1'12                     Q3'11


Cash Generated from Operations before Working Capital           Net Cash Generated from Operations
                     ($ millions)                                          ($ millions)


$100     $91                                            $100
                      $80         $82         $80
                                                                                                                              $71
 $75                                                     $75
                                                                 $47         $46
 $50                                                     $50                                        $37

 $25                                                     $25

  -                                                        -
        Q3'12        Q2'12       Q1'12       Q3'11              Q3'12       Q2'12                  Q1'12                     Q3'11


                                                                               TD Securities Mining Conference | January 29-30, 2013   23 23
Appendix 1
        2012 third quarter operating results
                                                                                   2012 Third Quarter                                  2012 Nine Months
                                                                                                          Earning from                                                 Earning from
                                                                            Gold sales    Cash cost(1)                       Gold sales            Cash cost(1)
                                                                                                         Mine Operations                                              Mine Operations
                                                                          (000s ounces)     ($/oz)                         (000s ounces)             ($/oz)
                                                                                                             ($mm)                                                        ($mm)


                             Mesquite                                         32           $722              $13              113                   $664                     $58


                   Cerro San Pedro                                            34           $218              $41              103                   $205                    $123


                          Peak Mines                                          22           $796              $15               64                   $772                     $42


                            New Afton                                          7          ($955)               $8                7                 ($955)                      $8


                                                                              95           $443              $77              286                   $486                    $231

Note:     1. Refer to Cautionary Statement and note on Total cash cost.


                                                                                                                              TD Securities Mining Conference | January 29-30, 2013   24 24
Appendix 1
         Track record of per share growth outperforming gold

                           Average gold price increased by 62% from 2009 through 2011

                           Adjusted earnings per share                                                                Net cash generated from operations per share

                                                                             $0.44
                                  267%                                                                                                 104%
                                                                                                                                                                                   $0.53
                                                                                                                                                  $0.48
                                                $0.30

                                                                                                                            $0.26
                    $0.12


                    2009                         2010                        2011                                           2009                   2010                            2011

                          Net asset value per share(1)(2)                                                         Measured & Indicated gold resource per 1,000 shares(3)

                                                                            $11.02                                                         25%
                                   348%                                                                                                                                     40.8

                                                                                                                                    32.7
                                                $6.68


                    $2.46


                    6/1/09                     12/31/10                    12/31/11                                            12/31/10                                  12/31/11

Notes:     1. Net asset value as at June 1, 2009 based on New Gold and Western Goldfields business combination.
           2. Based on average of consensus net asset value per share ascribed by analysts covering New Gold.
           3. Measured and Indicated gold resource shown inclusive of reserves.


                                                                                                                                                 TD Securities Mining Conference | January 29-30, 2013   25 25
Appendix 1
         2012 guidance


                   Gold production(1)                                      Total cash cost(1)
                             405 - 445Koz                                  $410 - $430/oz

            2012 cash cost estimate assumes:                                                              2012 Guidance
            •      $30.00 per ounce silver
                                                                                            Gold production            Total cash cost(1)
            •      $3.50 per pound copper                                                        (ounces)                        ($/oz)


            •      Parity Australian dollar                                 Mesquite        140,000 - 150,000               $710 - $730

            •      Parity Canadian dollar
                                                                            Cerro San Pedro 140,000 - 150,000               $250 - $270
            Total company cash cost subject to following sensitivities:
                                                                            Peak Mines       90,000 - 100,000               $640 - $660
            •      +/- $1.00 per ounce silver ~ +/- $5 per ounce
            •      +/- $0.25 per pound copper ~ +/- $25 per ounce           New Afton        35,000 - 45,000           ($1,200) - ($1,300)

            •      +/- $0.05 AUD FX ~ +/- $10 per ounce
                                                                            Total           405,000 - 445,000               $410 - $430
            •      +/- $0.05 CDN FX ~ +/- $5 per ounce
Notes:     1. Refer to Cautionary Statement and note on Total cash cost.


                                                                                                TD Securities Mining Conference | January 29-30, 2013   26 26
Appendix 2
         Mesquite

                                                                                                                         2011 Actual & 2012 Guidance
                     Gold production (ounces)                                                                                              2011A                              2012E
                               140,000 - 150,000                                                         Tonnes processed
                                                                                                                                            11,733                    12,500 – 13,500
                                                                                                         (000 tonnes)
                                                                                                         Tonnes mined
                                                                                                                                            45,973                    45,000 – 47,000
                                                                                                         (000 tonnes)
                  Total cash cost ($ per ounce)
                                                                                                         Grade - gold (g/t)                   0.57                        0.50 – 0.55
                                     $710 - $730
                                                                                                         Capital
                                                                                                                                                19                               ~14
                                                                                                         ($ million)


  2011A versus 2012E                                                                                     Key assumptions and sensitivities
  • Lower strip ratio to result in higher ore tonnes                                                     • Diesel comprises ~20% of Mesquite’s total costs
    processed                                                                                            • Rack diesel price most correlated to Brent oil price
  • Gold grade is expected to decline from 2011                                                                   − Brent oil price increased by 13% since
    levels                                                                                                          beginning of 2011
  • Increase in costs primarily driven by lower                                                          • Every 10% change in diesel price has ~$15 per
    gold production                                                                                        ounce impact on costs


Notes:     1. Mesquite life-of-mine recovery continues to track at ~75% for oxide; ~35% for sulphides.


                                                                                                                                     TD Securities Mining Conference | January 29-30, 2013   27 27
Appendix 2
         Cerro San Pedro

                                                                                                                          2011 Actual & 2012 Guidance
                     Gold production (ounces)
                                                                                                                                            2011A                              2012E
                              140,000 - 150,000
                                                                                                         Tonnes processed
                                                                                                                                             16,763                    14,000 – 15,000
                                                                                                         (000 tonnes)
             Silver production (million ounces)
                                                                                                         Tonnes mined
                                                                                                                                             33,276                    31,000 – 33,000
                                        1.9 - 2.1                                                        (000 tonnes)
                                                                                                         Grade - gold (g/t)                    0.48                        0.55 – 0.60
                  Total cash cost ($ per ounce)                                                          Grade – silver (g/t)                    24                            20 – 25
                                     $250 - $270                                                         Capital
                                                                                                                                                  7                               ~16
                                                                                                         ($ million)


  2011A versus 2012E                                                                                     Key assumptions and sensitivities
  • Expected production of gold and silver consistent                                                    • Silver price - $30 per ounce (2011A - $35.15/oz)
    with 2011                                                                                            • Mexican Peso: U.S. foreign exchange – 13:1
           • Decrease in tonnes processed offset by                                                      • $1.00 per ounce change in silver equals ~$15 per
             grade and recovery movements                                                                  ounce change in Cerro San Pedro cash cost
  • Increase in costs primarily driven by lower silver                                                   • 1.0 change in Mexican Peso equals ~$15 per
    by-product price assumption                                                                            ounce change in Cerro San Pedro cash cost


Notes:     1. Cerro San Pedro life-of-mine recovery continues to track at: Gold – ~60%, Silver – ~30%.


                                                                                                                                      TD Securities Mining Conference | January 29-30, 2013   28 28
Appendix 2
  Peak Mines

                                                                     2011 Actual & 2012 Guidance

           Gold production (ounces)                                                    2011A                              2012E
                                                     Tonnes processed
                90,000 - 100,000                                                          783                          780 – 800
                                                     (000 tonnes)
                                                     Tonnes mined
                                                                                          755                          780 – 800
     Copper production (million pounds)              (000 tonnes)

                     12 - 14                         Grade - gold (g/t)                   3.94                           4.0 – 4.2

                                                     Grade – copper (%)                   0.93                        0.88 – 0.90
         Total cash cost ($ per ounce)               Recovery – gold (%)                    89                            88 – 90
                  $640 - $660                        Recovery – copper (%)                  82                            85 - 87
                                                     Capital
                                                                                            50                               ~60
                                                     ($ million)

2011A versus 2012E                                   Key assumptions and sensitivities
• Increased gold production driven by increases in   • Copper price - $3.50 per pound (2011A - $3.78/lb)
  tonnes processed, gold grades and recoveries       • Australian dollar: U.S. foreign exchange – 1:1
• Similar copper production a result of increased    • $0.25 per pound change in copper equals ~$35 per
  tonnes processed and copper recoveries offset        ounce change in Peak cash cost
  by lower copper grades
                                                     • 0.01 change in Australian dollar equals ~$10 per
                                                       ounce change in Peak cash cost


                                                                                 TD Securities Mining Conference | January 29-30, 2013   29 29
Appendix 3
Block cave mines


                   TD Securities Mining Conference | January 29-30, 2013   30 30
Appendix 3
     New Afton – 2012 production start-up
 •       The combination of over six months of active underground mining and the existence of the ore stockpile led
         to an efficient mill start-up
 •       Mill started on June 28, 2012
 •       Commercial production achieved on July 31, 2012
Tonnes per day

15,000                                                                                      Period of drawdown
                                                                                            of stockpile inventory
                                                    Mill reaches 11,000
12,500                                                       tpd


10,000


 7,500
                                                                                                                         Mining/milling rate
                                                                                                                       reach 11,000 tpd run-
 5,000                                                                                                                       rate level
                                                                  Mill starts in June and reaches
 2,500                                                             6,600 tpd commercial rate in
                                                                                August

     -
           January        March           May             July      September        November                      January                         March
                                                   2012                                                                               2013
                                     Mine tpd                                   Mill feed tpd


                                                                                                TD Securities Mining Conference | January 29-30, 2013   31 31
Appendix 3
Production and sales

                                                       New Afton 2012 Guidance
       Gold production (ounces)
                                      Tonnes processed (000 tonnes)                            1,900 – 2,200
               35,000 - 45,000
                                      Grade - gold (g/t)                                         0.75 – 0.85

                                      Grade - copper (%)                                         0.85 – 0.95
 Copper production (million pounds)
                                      Recovery – gold (%)                                           88 – 90
                   30 - 35
                                      Recover – copper (%)                                          88 – 90


             Gold sales (ounces)      •   Difference between production and sales
                                          a result of pre-commercial production
               20,000 - 30,000            commodity sales being net against capital
                                          costs and timing of certain concentrate
                                          sales
    Copper sales (million pounds)
                   20 - 25


                                                                 TD Securities Mining Conference | January 29-30, 2013   32 32
Appendix 3
         Operating costs

   •      Operating costs ~$25 per tonne in first five months of commercial production(1)

                –     Life-of-mine average ~$18 - $22 per tonne


                                                                                              ~$6.20/t             ~$4.60/t


                                                                                                         ~$9.20/t


                                                                                         Processing            Mining         G&A


                                                                                                                                    2012 co-product cash cost(3)
                    2012 by-product cash                                 cost(2)
                                                                                                                                      $630 - $650 per ounce,
                    ($1,200) - ($1,300) per ounce
                                                                                                                                      $1.35 - $1.45 per pound

   •      Costs expected to be lower in future years as ‘per tonne’ cost reaches steady-state level
           – Life-of-mine average by-product cost ~($1,750)(4)
           – Life-of-mine average co-product costs(4) of ~$525 per ounce gold and ~$1.15 per pound copper
Notes:     1.   Includes treatment and refining charges and assumes parity Canadian/U.S. dollar foreign exchange rate.
           2.   Assumes $3.50 per pound copper price and parity Canadian/U.S. dollar foreign exchange rate.
           3.   Co-product costs calculated on a percentage of revenue basis and assume a gold price of $1,600 per ounce.
           4.   Based on assumption of $1,600 per ounce gold, $3.50 per pound copper and a parity foreign exchange rate.
                                                                                                                                               TD Securities Mining Conference | January 29-30, 2013   33 33
Appendix 3
    New Afton – C Zone exploration
•     3 phase underground core drilling program totaling 40,000 meters commencing Q3 2012
•     Phase 1: ~15,000 meters to delineate eastern limits of C-zone and assess potential to lower block cave
      extraction level for B3 reserve block - estimated completion by end Q1’13
•     Phases 2 & 3: ~25,000 meters to explore extensions to west and at depth - estimated completion Q4’13
                                                   C Zone Resource (2010)
                                          Tonnes       Au         Cu        Gold   Copper
                                           000’s       g/t        %         Koz     Mlbs
                           M&I             3,637       0.78       0.96        92      76
                           Inferred       11,317       0.60       0.75       218     186


                                 Cross
                                                                                                            Long Section
                                Section                                                                      Looking South
                              Looking East


                                                                                       TD Securities Mining Conference | January 29-30, 2013   34 34
Appendix 4
         El Morro (30%) – funding structure(1)


                                                   Total Capital                                     100%
                                                       100%                                      Average annual
                                                   ~ $3.9 billion                                  cash flow


                                         30%                        70%


                               Funded by
                                                                ~ $2.7 billion
                              $1.2 billion                                                 30%                        70%
                           interest at 4.58%


                                                                                     20%             80%
                                                         Carried funding repayment


         •      New Gold’s 30% share of development capital 100% carried
                    – Interest fixed at 4.58%


Notes:       1. Based on 2011 Feasibility Study.


                                                                                                         TD Securities Mining Conference | January 29-30, 2013   35 35
Appendix 4
      Selected porphyry gold/copper deposits/mines(1)
  Gold
  Grade
   (g/t)

  0.80


  0.70


  0.60                                                               $38/t                       $42/t

                                                                                                                                                               El Morro
  0.50                                                                                                                                                            $51/t


  0.40
                                                               $27/t
                                                                                                                $40/t

  0.30

                                                                                         $24/t
                                                                                                                                                   $49/t
  0.20


  0.10
                                                                                                                          $29/t
                                                                                                                                                                                                                         Copper
      --                                                                                                                                                                                                                  Grade
                                 0.10%                        0.20%                        0.30%                         0.40%                       0.50%                          0.60%                           0.70% (%)


                                                           Agua Rica                   Alumbrera                        Cadia-Ridgeway (2)             Cerro Casale
                                                           Chapada                     Cobre Panama                     El Morro                       Mt. Milligan


Source:    Company disclosure.
Notes:     1. Circle sizes are representative of contained metal value of the reserves per tonne of reserve. Contained metal value calculated using Street research consensus long-term commodity pricing.
           2. Includes “Cadia East Underground” and “Ridgeway Underground” reserves as indicated in Newcrest’s February 10, 2012 press release; does not include “Other” Cadia province reserves.


                                                                                                                                                                      TD Securities Mining Conference | January 29-30, 2013   36 36
Appendix 4
         El Morro relative positioning(1)


                                                                       El Morro within Goldcorp portfolio

                                                                                                                                                                                                         (2)
                                                                       Gold Reserves                                                                                      Gold Equivalent
               Asset                                                                                                 Asset
                                                                                 (Moz)                                                                                                 (Moz)


               Penasquito                                                       16.5                                 Penasquito                                                        45.2


               Pueblo Viejo                                                     10.1                                 El Morro                                                          15.4


               Los Filos                                                          7.8                                Pueblo Viejo                                                      11.8


               El Morro                                                           5.8                                Los Filos                                                          8.7


               Cerro Negro                                                        4.5                                Cerro Negro                                                        5.2


Notes:     1. Based on Goldcorp’s December 31, 2011 year-end resource statements.
           2. Gold equivalent calculated based on the following commodity prices: Gold - $1,595/oz; Silver - $28.75/oz; Copper - $3.50/lb; Lead - $0.88/lb; Zinc - $0.86/lb.


                                                                                                                                                                        TD Securities Mining Conference | January 29-30, 2013   37 37
Appendix 5
Blackwater drill program

                                               Cumulative number   Cumulative number
                       Drilling cut-off date
                                                   of holes           of metres


    March 2011
                        December 31, 2010             77                          24,563
  Initial Resource

  September 2011
                           July 31, 2011              148                         49,223
  Resource update

   Year-end 2011
                        November 30, 2011             218                         67,848
  Resource update

    March 2012
                        December 31, 2011             261                         89,460
  Resource update

     April 2012
                           March 5, 2012              328                        115,950
2012 assays received

     July 2012
                           May 14, 2012               449                       149,739
  Resource update


                                                                   TD Securities Mining Conference | January 29-30, 2013   38 38
Appendix 5
    Blackwater – Project overview

•    Start of production in 2017

•    Conventional truck and shovel open pit mine with 60,000 tonnes per day processing plant

•    Life-of-mine strip ratio of 2.36 to 1

•    Low grade stockpiling strategy

•    Simple, conventional flowsheet using whole ore leach process

•    Life-of-mine gold and silver recoveries of 87% and 53%, respectively

•    Conventional waste rock and Tailings Storage Facility

•    Power supply from the hydroelectric power grid, via 133 kilometre transmission line

•    Minimal off-site infrastructure required

       –   Good existing access road; water supply within 15 kilometres

•    Low environmental risk and facility designed for closure


                                                                                   TD Securities Mining Conference | January 29-30, 2013   39 39
Appendix 5
    PEA resource summary
•    The deposit contains an Indicated mineral resource of 267 Mt at 0.88 g/t Au and 4.3 g/t Ag and an Inferred
     mineral resource of 121 Mt at 0.69 g/t Au and 7.3 g/t Ag at a base case lower cut-off of 0.30 gram per tonne
     gold equivalent
•    Mineral estimate is CIM 2010 compliant and prepared under Canadian National Instrument 43-101
       – Based upon geologic block model that incorporated over 147,282 individual assays from 168,709
           metres of diamond drill core in 449 drill holes
       – Average drill hole spacing of approximately 50 metres is sufficient to support mineral resource
           estimation up to the Indicated category
•    Mineral resource includes drill data received through May 14, 2012
                                                     Blackwater Project PEA Mineral Resource Estimate
                                  Indicated Mineral Resource                                               Inferred Mineral Resource
                    AuEq                                                                    AuEq
                    Cut-off       Tonnes           Au        Ag        Au    Ag             Cut-off       Tonnes          Au         Ag        Au    Ag
                     (g/t)          (Mt)          (g/t)     (g/t)     (Moz) (Moz)            (g/t)          (Mt)         (g/t)      (g/t)     (Moz) (Moz)

                       0.25         280.4         0.85       4.2       7.64       37.9        0.25          128.6        0.66        7.0       2.72        28.9

                       0.30         267.1         0.88       4.3       7.52       36.9        0.30          120.5        0.69        7.3       2.66        28.3
                       0.40         230.6         0.96       4.6       7.14       34.1        0.40          98.9         0.77        7.8       2.45        24.8
                   Notes:
                   1. Mineral Resource Estimate has an effective date of July 27, 2012 and was prepared by Ronald G. Simpson, P Geo.
                   2. Mineral Resources that are not Mineral Reserves do not have demonstrated economic viability.
                   3. Mineral Resources are amenable to open pit mining methods as defined by a Lerchs-Grossmann optimized pit simulation.
                   4. The Lerchs-Grossmann optimized pit is based on assumptions that include US$/CDN$ parity foreign exchange rate, 83.6% Au recovery, 44.9% Ag recovery,
                   $1.52/tonne mining cost, $1.90/tonne waste mining cost, $10.52/tonne process and G&A cost. No allowances have been made for mining losses and dilution. The
                   average pit slope angle is assumed to be 40°.
                   5. The base case gold equivalent (AuEq) cut-off (bolded) is greater than the conceptual marginal cut-off of 0.23 g/t.
                   6. AuEq = $24/oz Ag x 44.9% / $1,300/oz x 83.6%.
                   7. Gold analyses are performed by fire assay/AA finish methods and silver analyses are performed by Induction Coupled Plasmaspectrometry (ICP). Silver ICP
                   analyses are not known with the same precision and do not have the same quality control support as gold fire assay analyses.
                   8. Rounding as required by reporting guidelines has been used, and totals may not sum.


                                                                                                                                             TD Securities Mining Conference | January 29-30, 2013   40 40
Appendix 5
  Blackwater PEA costs - Capital

Project Development Capital Costs                        •   Project is located 112 kilometres southwest
Description                           Cost ($ million)       from Vanderhoof and has access to low cost
                                                             hydroelectric power
Direct Costs

Mining & Pre-production Development        $208          •   Development capital estimate of $1.8 billion is
                                                             inclusive of a 24% or $346 million
On Site Infrastructure                     $181
                                                             contingency
Process                                    $539
                                                         •   Development capital estimated based on the
Tailing and Water Reclaim                   $74
                                                             current cost environment
Infrastructure (Power, Water, Road)         $85

Total Direct Costs                        $1,087
                                                               –   A parity foreign exchange rate was
                                                                   assumed and the capital estimate was
Owner's and Indirect Costs
                                                                   held constant in the economic analysis
Owner's Costs                               $54
                                                         •   Sustaining capital of $537 million, reclamation
EPCM                                       $112
                                                             and closure costs of $95 million and $72 million
Other Indirects                            $215              in equipment salvage value
Total Owner's and Indirect Costs           $381

Subtotal                                  $1,468               Total development and sustaining
Contingency (24%)                          $346                  capital estimated at $294 per
Total Project                             $1,814                    recoverable gold ounce


                                                                                 TD Securities Mining Conference | January 29-30, 2013   41 41
Appendix 5
        Blackwater PEA costs - Operating
                                                                                                                                Mining Costs
    Project Operating Costs
                                                                                                                           4% 4%2%                                    Hauling
    Area                                                               Unit Cost (C$/t milled) $ per gold ounce produced
                                                                                                                            4%                                        Auxiliary
    Mining                                                                         $6.21                         $259      6%                                         Blasting
                                                                                                                                                                      G&A
    Processing                                                                     $7.59                         $317      9%                                         Drilling
                                                                                                                                               59%
    General and Administrative                                                     $0.95                         $40       11%                                        Loading
                                                                                                                                                                      General Maint.
    Royalty (0.6%)                                                                 $0.18                          $8                                                  General Mine
    Refining                                                                       $0.23                          $9

    Silver by-product sales at $22.50 per ounce silver                             ($2.16)                       ($90)     Processing Costs
                                                                                                                                     1%                              Reagents
    Total cash costs(1) net of by-product sales                                    $13.01                        $543
                                                                                                                                  6%
                                                                                                                            8%                                       Grinding
    Total Cash Costs        (1)
                                  Schedule
                                                                                                                                                                     Media/liners
                                                                                                                                                                     Electricity
                                                                                                                           17%                   44%
    Production Years                 $ per gold ounce produced                                                                                                       Labour
    Years 1 through 5                                 $467                                                                                                           Maint materials
                                                                                                                                 24%
    Years 1 through 15                                $536                                                                                                           Water Supply

    Years 16 through 17                               $678

    Life-of-mine                                      $543


         Blackwater’s location near infrastructure, low stripping ratio, access to low cost power and silver
        by-product revenue expected to result in the Project having well below industry average cash costs
Note:        1. Refer to Cautionary Statement and note on Total cash costs and PEA additional cautionary note.


                                                                                                                            TD Securities Mining Conference | January 29-30, 2013   42 42
Appendix 5
        Open pit mining cost
                                                         $4.00


                                                         $3.50
                   Mining cost per tonne moved (US$/t)


                                                         $3.00


                                                         $2.50
                                                                                             Cerro San Pedro

                                                         $2.00
                                                                                                                                           Blackwater

                                                         $1.50

                                                                                  Mesquite
                                                         $1.00


                                                         $0.50


                                                               -
                                                                      -                       30                            60                      90                      120                                 150
                                                                                                                                 1,000 tonnes per day

        Hycroft                                          Prosperity       Blackwater     Malartic (start-up)   Cerro San Pedro         Marigold    Rainy River   Morelos                Haile               Malartic (technical report)
        Rosemont                                         Detour (LOM)     Mt. Milligan   Donlin Creek          Copper Mountain         Mesquite    La India      Young Davidson         Pinos Altos         Detour (first ten years)


Note:        1. Company technical reports and investor presentations.
             2. Malartic mining cost shown during start-up phase and life-of-mine estimate from technical report on May 10, 2011.
             3. Detour mining cost shown for first ten years and life-of-mine based on updated mine plan from September 4, 2012 news release.


                                                                                                                                                                           TD Securities Mining Conference | January 29-30, 2013   43 43
Appendix 5
                                        Production and cash costs profile
                                                                                                                                                 Life-of-mine
                                                                                                                                          Gold production – 489koz
                                                                                                                                          Total cash costs - $543/oz

                                                            Years 1 through 5                                                                 Years 1 through 15                                           Years 16 through 17
                                                       Gold production – 569koz                                                           Gold production – 507koz                                     Gold production – 296koz
                                                       Total cash costs - $467/oz                                                         Total cash costs - $536/oz                                   Total cash costs - $678/oz
                                        700                                                                                                                                                                                       $1,000

                                                                                                                      Gold production            Base Case cash costs

                                        600


                                                                                                                                                                                                                                  $750
                                        500
    Gold production (thousand ounces)


                                                                                                                                                                                                                                           Total Cash Costs ($/oz) (1)
                                        400

                                                                                                                                                                                                                                  $500

                                        300


                                        200
                                                                                                                                                                                                                                  $250


                                        100


                                          -                                                                                                                                                                                       -
                                                2017       2018       2019       2020       2021       2022        2023       2024       2025    2026     2027     2028   2029   2030       2031         2032        2033

Note:                                     1. Refer to Cautionary Statement and note on Total cash costs and PEA additional cautionary note.


                                                                                                                                                                                 TD Securities Mining Conference | January 29-30, 2013   44 44
Appendix 5
                      PEA highlights(1)

                 PEA Results                                                                  Base Case                                    Spot Case

                 Gold Price (US$/oz)                                                             $1,275                                     $1,775

                 Silver Price (US$/oz)                                                           $22.50                                     $34.50

                 US$/CDN$ Foreign Exchange                                                        0.94                                       1.00
                 After-tax NPV(5%) ($ billions)                                                   $1.1                                       $2.8
                 After-tax IRR                                                                   14.0%                                      25.8%
                 After-tax payback period (years)                                                  4.8                                        2.7


                                                                                                      Operating cash flow ($ millions)

                                                                                           Base Case            Spot Case
                              $900
                                                                                                                                                            •     Average spot case
                              $750
                                                                                                                                                                  cash flow during first
        Operating cash flow


                                                                                                                                                                  five years of ~$655
                              $600                                                                                                                                million
                              $450
                                                                                                                                                            •     Cumulative spot case
                              $300                                                                                                                                cash flow during first
                                                                                                                                                                  five years of ~$3.3
                              $150                                                                                                                                billion
                                $0
                                                2017                       2018                       2019                          2020             2021
Note:                           1. Refer to Cautionary Statement and note on Total cash costs and PEA additional cautionary note.


                                                                                                                                                            TD Securities Mining Conference | January 29-30, 2013   45 45
Appendix 5
        Perspectives on capital costs

    •    Blackwater development capital                                                                                                       After-tax IRR (%)(1)(2)
         cost of $1.8 billion inclusive of 24%,
         or $346 million, contingency                                                                                                                       Gold price ($/oz)

            –      $227 per recoverable ounce                                                                                                $1,275      $1,600               $1,775                      $1,800

    •    Costed in mid-2012 capital
         environment assuming parity


                                                                                            Development capital ($ billions)
                                                                                                                                   $1.5      18.1%       27.5%                 31.8%                      32.5%
         foreign exchange rate

    •    Capital intensity may be abating                                                                                          $1.6      16.6%       25.4%                 29.6%                      30.2%

    •    Large diversified companies,
         accounting for ~55% of global                                                                                             $1.7      15.2%       23.6%                 27.6%                      28.2%
         capital, delaying certain projects

    •    Oil sands project expansions also                                                                                         $1.8      14.0%       22.0%                 25.8%                      26.4%
         being delayed
                                                                                                                               •    Each $100 million change in development capital equates
                                                                                                                                    to a ~$100 million change in NPV


        New Gold could benefit from announced delays in capital projects of major companies

Note:     1. Refer to Cautionary Statement and note on Total cash costs and PEA additional cautionary note.
          2. IRR calculated to beginning of construction period in 2015.


                                                                                                                                                                  TD Securities Mining Conference | January 29-30, 2013   46 46
Appendix 5
         Total acquisition cost (“TAC”)

    •     Acquisition costs of $602(1) million                                                                             Total Acquisition Cost per Ounce
          based on:
                                                                                                                                                                 Total
             – Richfield - $470 million                                                                                                                         ($mm)
                                                                                                                                                                                       $ Per Ounce (2)

             – Silver Quest - $114 million
                                                                                                       Total Acquisition costs to date                           $602                           $75
             – Geo Minerals - $18 million                                                              Development capital                                     $1,814                          $227
                                                                                                       Life-of-mine sustaining capital                           $537                           $67
    •     Total acquisition cost of $912 per
                                                                                                       Life-of-mine average cash costs ($/oz) (3)                                              $543
          ounce below recent industry
                                                                                                       Total acquisition cost ($/oz)                                                           $912
          comparable transactions
             – Further potential to decrease                                                           Spot gold price ($/oz)                                                                 $1,775
               break-even gold price with
               continued resource expansion                                                            (Discount)/Premium to spot gold                                                         (49%)

                                                                                                       Break-even gold price                                                                   $912


Notes:     1. Per 2011 Annual financial statements.
           2. Per ounce calculations based on 6.2 million ounces from the Indicated category and 1.8 million ounces from the Inferred category.
           3. Refer to Cautionary Statement and note on Total cash costs and PEA additional cautionary note.


                                                                                                                                                  TD Securities Mining Conference | January 29-30, 2013   47 47
Appendix 5
Areas of optimization


             Potential for expansion of the resource to the north and to depth


     Further geotechnical drilling to assess the possibility of steepening pit slopes


             Potential to reduce mining costs through mine plan optimization


                              Optimizing process flowsheet


                                                                   TD Securities Mining Conference | January 29-30, 2013   48 48
Appendix 5
Blackwater Resource Growth – July 2012

                                                                      July 2012
                                                         Indicated                   Inferred
                                                           Mt        Au g/t          Mt          Au g/t
                                                          267          0.88         121          0.69

                                                           7.5 Moz                   2.7 Moz

                                                          Cumulative Drilling
                                                             Holes                    Metres
                                                                449                  147,282


                                         TD Securities Mining Conference | January 29-30, 2013   49 49
Appendix 5
         Blackwater – July 2012 drill results

                    July 18, 2012


Notes:     1. For complete summary of 2012 assay results, refer to New Gold website at www.newgold.com.


                                                                                                          TD Securities Mining Conference | January 29-30, 2013   50 50
Appendix 5
Blackwater Block Model – July 2012


             NW Silver Zone


                                     TD Securities Mining Conference | January 29-30, 2013   51 51
Appendix 5
BW Section 5892,800N – July 2012 Block Model


                                               TD Securities Mining Conference | January 29-30, 2013   52 52
Appendix 5
BW Section 375,500E – July 2012 Block Model


                                                                       Silver Zone


                                              TD Securities Mining Conference | January 29-30, 2013   53 53
Appendix 5
Blackwater regional exploration


                                                                      17


                                  TD Securities Mining Conference | January 29-30, 2013   54 54
Appendix 5
Blackwater PEA mineral resource


                                             NW Silver Zone
             Sxn 5893,500N


                               SW
                             Breccia
                              Pipe


                                       Sxn 375,000E


                                                              TD Securities Mining Conference | January 29-30, 2013   55 55
Appendix 5
Blackwater exploration upside opportunities

Section 5893,500N                 Gold                                           Section 375,000E


               NW ‘Silver Zone’


                                              SW Breccia Pipe


                                              TD Securities Mining Conference | January 29-30, 2013   56 56
Appendix 5
Blackwater exploration upside opportunities (cont’d)

 Section 5893,500N                 Silver                                                  Section 375,000E


                NW ‘Silver Zone’


                                                       SW Breccia Pipe


                                                       TD Securities Mining Conference | January 29-30, 2013   57 57
Appendix 6
Reserves and resource notes

                                   Mineral Reserves statement as at December 31, 2011
                                                   Metal grade                                   Contained metal

                                     Tonnes       Gold          Silver       Copper       Gold       Silver       Copper
                                      000's        g/t           g/t           %          Koz         Koz          Mlbs
             Mesquite
             Proven                    14,548       0.67                 -            -      313              -              -
             Probable                 138,796       0.55                 -            -    2,448              -              -
             Mesquite P&P             153,345       0.56                 -            -    2,762              -              -
             Cerro San Pedro
             Proven                    23,972       0.58          16.99               -     447       13,091                 -
             Probable                  35,267       0.49          15.30               -     559       17,352                 -
             Cerro San Pedro P&P       59,239       0.53          15.98               -    1,006      30,443                 -
             Peak
             Proven                     1,608       6.33            8.4         0.82        327          434              29
             Probable                   1,811       4.80            6.7         0.92        279          390              37
             Peak P&P                   3,419       5.50            7.5         0.87        606          824              66
             New Afton
             Proven                         -          -              -            -          -            -               -
             Probable                  47,900       0.64            2.0         0.90        986        3,080             954
             New Afton P&P             47,900       0.64            2.0         0.90        986        3,080             954
             El Morro                                    100%                                         30%
             Proven                   308,036       0.58                 -      0.57       1,716              -       1,153
             Probable                 212,167       0.38                 -      0.51         787              -         715
             El Morro P&P             520,024       0.50                 -      0.54       2,503              -       1,868


                                                                                                          TD Securities Mining Conference | January 29-30, 2013   58 58
Appendix 6
Reserves and resource notes (cont’d)
                                  Measured and Indicated mineral Resource statement (inclusive of Reserves) as at December 31, 2011
                                                                Metal grade                                                     Contained metal
                                       Tonnes       Gold      Silver       Copper       Zinc       Lead       Gold     Silver         Copper           Zinc          Lead
                                        000's        g/t       g/t           %           %          %         Koz       Koz            Mlbs            Mlbs          Mlbs
     Mesquite
     Measured - oxide                    19,182        0.51            -            -          -          -      316            -               -              -              -
     Indicated - oxide                  269,872        0.39            -            -          -          -    3,407            -               -              -              -
     Mesquite M&I - oxide               289,054        0.40            -            -          -          -    3,723            -               -              -              -

     Measured - non oxide                 4,688        0.91            -            -          -          -      137            -               -              -              -
     Indicated - non oxide               79,851        0.65            -            -          -          -    1,674            -               -              -              -
     Mesquite M&I - non oxide            84,539        0.66            -            -          -          -    1,811            -               -              -              -
     Total Mesquite                     373,594        0.46            -            -          -          -    5,534            -               -              -              -
     Cerro San Pedro
     Measured - open pit oxide           25,722        0.44     15.36               -          -          -     367    12,706                   -              -              -
     Indicated - open pit oxide          55,647        0.31     12.28               -          -          -     546    21,976                   -              -              -
     CSP M&I - open pit oxide            81,369        0.35     13.26               -          -          -     913    34,682                   -              -              -

     Measured - open pit sulphide        13,317        0.54     13.60               -     0.64       0.10        232    5,823                   -          187             29
     Indicated - open pit sulphide       46,697        0.44     10.23               -     0.55       0.08        667   15,355                   -          566             77
     CSP M&I - open pit sulphide         60,014        0.47     10.98               -     0.57       0.08        899   21,178                   -          753            106
     Total CSP M&I - open pit                                                                                  1,812   55,860
     Peak
     Measured                              3,092       4.89        7.3        1.14             -          -     486        726               78                -              -
     Indicated                             3,697       3.89        7.1        1.09             -          -     462        844               89                -              -
     Peak M&I                              6,789       4.30        7.2        1.11             -          -     948      1,570              167                -              -
     New Afton
     Measured                            36,500        0.90        2.7        1.24             -          -    1,058     3,194            1,002                -              -
     Indicated                           33,300        0.64        2.1        0.80             -          -      685     2,276              584                -              -
     New Afton M&I                       69,800        0.78        2.4        1.03             -          -    1,742     5,470            1,586                -              -
     Blackwater
     Blackwater Indicated               267,145        0.88       4.3               -          -          -    7,524   36,932                   -              -              -
     Capoose Indicated                   31,216        0.38      26.5               -          -          -      384   26,594                   -              -              -
     El Morro                                                      100%                                                                  30%
     Measured - open pit                343,088        0.55            -      0.54             -          -    1,836            -         1,233                -              -
     Indicated - open pit               333,312        0.35            -      0.44             -          -    1,117            -           960                -              -
     El Morro M&I - open pit            676,400        0.45            -      0.49             -          -    2,954            -         2,193                -              -


                                                                                                                                    TD Securities Mining Conference | January 29-30, 2013   59 59
Appendix 6
Reserves and resource notes (cont’d)


                                            Inferred Resource statement as at December 31, 2011
                                                    Metal grade                                                      Contained metal

                               Tonnes     Gold     Silver       Copper       Zinc       Lead       Gold     Silver        Copper             Zinc            Lead
                                000's      g/t      g/t           %           %          %         Koz       Koz           Mlbs              Mlbs            Mlbs
Mesquite                         38,633     0.41            -            -          -          -     512             -               -                -                -
Cerro San Pedro
Inferred - open pit oxide        40,355     0.17      8.55               -          -          -     214    11,091                   -              -                  -
Inferred - open pit sulphide     24,736     0.47      7.40               -     0.50       0.07       374     5,882                   -            271                 39
                                                                                                     588    16,972                   -            271                 39

Manto Underground sulphides       6,270     1.83     94.51            -        3.09       1.09       368    19,052                 -              427             151
Peak                              3,147     2.56       4.8         1.54           -          -       259       486               107                -               -
New Afton                        29,200     0.51       1.6         0.61             -          -     483      1,478              390                  -                -
Blackwater
Blackwater                      120,478     0.69       7.3               -          -          -    2,661   28,276                   -                -                -
Capoose                          37,256     0.37      24.6               -          -          -     443    29,518                   -                -                -
                                                      100%                                                                        30%
El Morro
Open pit                        637,495     0.10            -      0.25             -          -      605            -        1,045                   -                -
Underground                     128,280     0.97            -      0.78             -          -    1,205            -          660                   -                -
El Morro Inferred                                                                                   1,810                     1,705


                                                                                                              TD Securities Mining Conference | January 29-30, 2013   60 60
Appendix 6
    Reserves and resource notes (cont’d)
Mineral reserves are contained within measured and indicated mineral resources. Measured and indicated mineral resources that are not mineral reserves do not have demonstrated economic
viability as defined by a technical feasibility study. Inferred mineral resources are not known with the same degree of certainty as measured and indicated resources, do not have demonstrated
economic viability, and are exclusive of mineral reserves. Mineral Reserves have been estimated and reported in accordance with the CIM Standards and National Instrument 43-101, or the
AusIMM JORC equivalent.

1) Mineral Reserves for the company’s mining operations and development projects have been calculated based on the following metal prices and lower cut-off criteria:

                          Mineral Property               Gold (US$/oz)              Silver (US$/oz)            Copper (US$/lb)                     Lower Cut-off

                          Mesquite                           $1,200                         -                          -               0.21 g/t Au – Oxide reserves
                                                                                                                                       0.41 g/t Au – Non-oxide reserves

                          Cerro San Pedro                    $1,200                     $20.00                         -               US$3.49/t NSR

                          Peak Mines                         $1,300                     $25.00                      $2.75              A$130 – 184/t NSR

                          New Afton                          $1,200                     $20.00                      $2.50              US$24/t NSR

                          El Morro                           $1,200                         -                       $2.75              0.20% Cu


                                                                                                                                               TD Securities Mining Conference | January 29-30, 2013   61 61
Appendix 6
    Reserves and resource notes (cont’d)
2) Mineral Resources for the company’s mining operations and development projects have been calculated based on the following metal prices and lower cut-off criteria:

                          Mineral Property                Gold           Silver        Copper           Zinc          Lead                        Lower Cut-off
                                                        (US$/oz)        (US$/oz)       (US$/lb)       (US$/lb)      (US$/lb)

                          Mesquite                       $1,300             -              -              -             -         0.11 g/t Au – Oxide resources
                                                                                                                                  0.22 g/t Au – Non-oxide resources

                          Cerro San Pedro                $1,300          $24.00            -           $1.00          $1.00       0.1g/t AuEq – Oxide resources
                                                                                                                                  0.4g/t AuEq – Open pit Sulphide resources
                                                                                                                                  2.5g/t AuEq – Underground manto resources

                          Peak Mines                     $1,300          $24.00          $2.75         $0.85          $0.65       A$103 - 137/t NSR

                          New Afton                      $1,300          $24.00          $2.75            -             -         0.40% CuEq – All resources

                          El Morro                       $1,350             -            $3.25            -             -         0.15% Cu – Open pit resources
                                                                                                                                  0.20% Cu – Underground resources

                          Blackwater                     $1,300             -              -              -             -         0.30 g/t AuEq – All resources

                          Capoose                        $1,025             -              -              -             -         0.40 g/t AuEq – All resources

Mineral resources have been estimated and reported in accordance with the standards of the Canadian Institute of Mining, Metallurgy and Petroleum and National Instrument 43-101, or the
AusIMM JORC equivalent.

3) Mineral resources are classified as measured, indicated and inferred resources and are reported based on technical and economic parameters consistent with the methods most suitable for
their potential extraction and mineral processing. Where different mining and/or processing methods might be applied to different portions of a mineralized system or metal deposit, the
designators ‘open pit’ and ‘underground’ have been applied to indicate likely mining method. Likewise the designators ‘oxide’, ‘non-oxide’ and ‘sulfide’ have been applied to indicate the type of
mineralization as it applies to appropriate mineral processing method and expected payable metal recoveries. Additional details regarding mineral resource estimation, classification and
reporting parameters for each of New Gold’s mines and projects are provided in the respective NI 43-101 Technical Reports and available on SEDAR.

4) Qualified Person: The preparation of New Gold’s mineral reserve and resource statements has been done by Qualfied Persons as defined under Canadian under National Instrument 43-101
under the oversight and review of Mark Petersen, a Qualified Person under National Instrument 43-101 and employee of New Gold.


                                                                                                                                                  TD Securities Mining Conference | January 29-30, 2013   62 62
Appendix 7
Commodity price/foreign exchange assumptions


             Guidance/consensus:

                                    2012            2013    2014

              Gold price ($/oz)     1,600           1,760   1,600

              Silver price ($/oz)   30.00           34.38   30.00

              Copper price ($/oz)   3.50            3.85    3.50

              USD/AUD               1.00            1.01    0.96

              USD/CAD               1.00            1.00    1.01

              USD/MXN               13.00           12.35   12.50


             Spot:

                                            Spot

              Gold price ($/oz)             1,655

              Silver price ($/oz)           30.85
              Copper price ($/oz)           3.65

              USD/AUD                       1.04

              USD/CAD                       1.00

              USD/MXN                       12.76


                                                                    TD Securities Mining Conference | January 29-30, 2013   63 63
Contact information


                                Investor Relations
                                 Hannes Portmann
                      Vice President, Corporate Development
                                   416-324-6014
                         hannes.portmann@newgold.com


                                                              TD Securities Mining Conference | January 29-30, 2013   64 64

Print version td conference - january 29-30, 2013

  • 1.
    TD Securities MiningConference | Toronto January 29-30, 2013
  • 2.
    Cautionary statement All monetaryamounts in U.S. dollars unless otherwise stated CAUTIONARY NOTE REGARDING FORWARD-LOOKING STATEMENTS Certain information contained in this presentation, including any information relating to New Gold's future financial or operating performance may be deemed "forward looking". All statements in this presentation, other than statements of historical fact, that address events or developments that New Gold expects to occur, are "forward-looking statements. Forward-looking statements are statements that are not historical facts and are generally, but not always, identified by the use of forward-looking terminology such as "plans", "expects", "is expected", "budget", "scheduled", "estimates", "forecasts", "intends", "anticipates", “projects”, “potential”, "believes" or variations of such words and phrases or statements that certain actions, events or results "may", "could", "would", “should”, "might" or "will be taken", "occur" or "be achieved" or the negative connotation. All such forward-looking statements are based on the opinions and estimates of management as of the date such statements are made and are subject to important risk factors and uncertainties, many of which are beyond New Gold's ability to control or predict. Forward-looking statements are necessarily based on estimates and assumptions that are inherently subject to known and unknown risks, uncertainties and other factors that may cause actual results, level of activity, performance or achievements to be materially different from those expressed or implied by such forward-looking statements. Such factors include, without limitation: significant capital requirements; fluctuations in the international currency markets and in the rates of exchange of the currencies of Canada, the United States, Australia, Mexico and Chile; price volatility in the spot and forward markets for commodities; impact of any hedging activities, including margin limits and margin calls; discrepancies between actual and estimated production, between actual and estimated reserves and resources and between actual and estimated metallurgical recoveries; changes in international, national and local government legislation in Canada, the United States, Australia, Mexico and Chile or any other country in which New Gold currently or may in the future carry on business; taxation; controls, regulations and political or economic developments in the countries in which New Gold does or may carry on business; the speculative nature of mineral exploration and development, including the risks of obtaining and maintaining the validity and enforceability of the necessary licenses and permits and complying with the permitting requirements of each jurisdiction that New Gold operates, including, but not limited to obtaining the necessary permits for the Blackwater project, in Mexico where the Cerro San Pedro mine has a history of ongoing legal challenges related to our EIS and Chile where the courts have temporarily suspended the approval of the environmental permit for the El Morro project; the lack of certainty with respect to foreign legal systems, which may not be immune from the influence of political pressure, corruption or other factors that are inconsistent with the rule of law; the uncertainties inherent to current and future legal challenges the company is or may become a party to,; diminishing quantities or grades of reserves; competition; loss of key employees; additional funding requirements; actual results of current exploration or reclamation activities; changes in project parameters as plans continue to be refined; accidents; labour disputes; defective title to mineral claims or property or contests over claims to mineral properties. In addition, there are risks and hazards associated with the business of mineral exploration, development and mining, including environmental hazards, industrial accidents, unusual or unexpected formations, pressures, cave-ins, flooding and gold bullion losses (and the risk of inadequate insurance or inability to obtain insurance to cover these risks) as well as "Risk Factors" included in New Gold's disclosure documents filed on and available at www.sedar.com. Forward-looking statements are not guarantees of future performance, and actual results and future events could materially differ from those anticipated in such statements. All of the forward-looking statements contained in this presentation are qualified by these cautionary statements. New Gold expressly disclaims any intention or obligation to update or revise any forward-looking statements, whether as a result of new information, events or otherwise, except in accordance with applicable securities laws. TD Securities Mining Conference | January 29-30, 2013 2 2
  • 3.
    Cautionary statement (cont’d) CAUTIONARYNOTE TO U.S. READERS CONCERNING ESTIMATES OF MEASURED, INDICATED AND INFERRED RESOURCES Information concerning the properties and operations discussed in this presentation has been prepared in accordance with Canadian standards under applicable Canadian securities laws, and may not be comparable to similar information for United States companies. The terms "Mineral Resource", "Measured Mineral Resource", "Indicated Mineral Resource" and "Inferred Mineral Resource" used in this presentation are Canadian mining terms as defined in accordance with NI 43-101 under guidelines set out in the Canadian Institute of Mining, Metallurgy and Petroleum ("CIM") Standards on Mineral Resources and Mineral Reserves adopted by the CIM Council on December 11, 2005. While the terms "Mineral Resource", "Measured Mineral Resource", "Indicated Mineral Resource" and "Inferred Mineral Resource" are recognized and required by Canadian regulations, they are not defined terms under standards of the United States Securities and Exchange Commission. Under United States standards, mineralization may not be classified as a "reserve" unless the determination has been made that the mineralization could be economically and legally produced or extracted at the time the reserve calculation is made. As such, certain information contained in this presentation concerning descriptions of mineralization and resources under Canadian standards is not comparable to similar information made public by United States companies subject to the reporting and disclosure requirements of the United States Securities and Exchange Commission. An "Inferred Mineral Resource" has a great amount of uncertainty as to its existence and as to its economic and legal feasibility. It cannot be assumed that all or any part of an "Inferred Mineral Resource" will ever be upgraded to a higher category. Under Canadian rules, estimates of Inferred Mineral Resources may not form the basis of feasibility or other economic studies. Readers are cautioned not to assume that all or any part of Measured or Indicated Resources will ever be converted into Mineral Reserves. Readers are also cautioned not to assume that all or any part of an "Inferred Mineral Resource" exists, or is economically or legally mineable. In addition, the definitions of "Proven Mineral Reserves" and "Probable Mineral Reserves" under CIM standards differ in certain respects from the standards of the United States Securities and Exchange Commission. TECHNICAL INFORMATION The scientific and technical information in this presentation has been reviewed by Mark Petersen, a Qualified Person under National Instrument 43-101 and an employee of New Gold. (1) TOTAL CASH COSTS “Total cash costs” per ounce figures are calculated in accordance with a standard developed by The Gold Institute, which was a worldwide association of suppliers of gold and gold products and included leading North American gold producers. The Gold Institute ceased operations in 2002, but the standard is widely accepted as the standard of reporting cash cost of production in North America. Adoption of the standard is voluntary and the cost measures presented may not be comparable to other similarly titled measures of other companies. New Gold reports total cash costs on a sales basis. Total cash costs includes mine site operating costs such as mining, processing, administration, royalties and production taxes, but is exclusive of amortization, reclamation, capital and exploration costs. Total cash costs are reduced by any by-product revenue and are then divided by ounces sold to arrive at the total by-product cash costs of sales. The measure, along with sales, is considered to be a key indicator of a company’s ability to generate operating earnings and cash flow from its mining operations. This data is furnished to provide additional information and is a non-IFRS measure. Total cash costs presented does not have a standardized meaning prescribed by IFRS and may not be comparable to similar measures presented by other mining companies. It should not be considered in isolation as a substitute for measures of performance prepared in accordance with IFRS and is not necessarily indicative of operating costs presented under IFRS. A reconciliation will be provided in the MD&A accompanying the quarterly financial statements. (2) PEA – ADDITIONAL CAUTIONARY NOTE This note regarding the preliminary economic assessment (PEA) is in addition to cautionary language already included within the presentation as required under NI 43-101. The Blackwater PEA is preliminary in nature and includes Inferred mineral resources that are considered too speculative geologically to have the economic considerations applied to them that would enable them to be categorized as mineral reserves, and there is no certainty that the PEA based on these mineral resources will be realized. Mineral resources that are not mineral reserves do not have demonstrated economic viability. TD Securities Mining Conference | January 29-30, 2013 3 3
  • 4.
    The evolution ofNew Gold Successfully commissioning New Afton Further strengthening team History of accretive growth Developing world-class assets Growing resources Doubling gold production Track record of delivering on plans organically Lowering costs, expanding margins and increasing cash flow Increasing net asset value Blackwater – Summer 2012 TD Securities Mining Conference | January 29-30, 2013 4 4
  • 5.
    History of accretivegrowth NGD Gold Price S&P/TSX Gold Index FTSE Gold Mines Index HUI Index 500% 450% Closing of Richfield acquisition 400% 350% Completed $1.2bn business +214% 300% combination with Western Goldfields 250% 200% +70% 150% (1%) 100% (12%) (16%) 50% 0% 1-Jun-09 2-Apr-12 27-Oct-09 24-Mar-10 14-Jan-11 11-Jun-11 23-Jan-13 19-Aug-10 28-Aug-12 6-Nov-11 28-Jan-13 Source: 1. Bloomberg. All amounts in USD. Note: 2. S&PTSX Gold Index includes 59 gold companies in various stages of development/production. 3. FTSE Gold Mines Index includes 26 gold producing companies. 4. HUI Index includes 15 of the major global gold producers. TD Securities Mining Conference | January 29-30, 2013 5 5
  • 6.
    Project development andoperational execution Gold production(1) (000s ounces) 450 400 405-445 350 383 387 300 250 302 200 233 150 100 50 0 2008 2009 2009 2010 2010 2011 2011 2012 Actual Guidance Actual Guidance Actual Guidance Actual Guidance Total cash cost(1)(2) ($/oz) $600 $500 $566 $400 $465 $446 $418 $410-430 $300 $200 $100 $0 2008 2009 2009 2010 2010 2011 2011 2012 Actual Guidance Actual Guidance Actual Guidance Actual Guidance Successfully brought Cerro San Pedro, Mesquite and New Afton into production on, or ahead of, schedule Notes: 1. Refer to Cautionary Statement and note on Total cash cost. 2. 2009 and 2008 costs shown based on Canadian GAAP. TD Securities Mining Conference | January 29-30, 2013 6 6
  • 7.
    Management and Boardof Directors EXECUTIVE MANAGEMENT TEAM BOARD OF DIRECTORS Randall Oliphant, Executive Chairman David Emerson, Former Canadian Cabinet Minister Robert Gallagher, President & CEO James Estey, Former Chairman UBS Securities Canada Brian Penny, Executive VP and CFO Robert Gallagher, President & CEO Ernie Mast, VP Operations Vahan Kololian, Founder Terra Nova Partners Martyn Konig, Former Executive Chairman European Goldfields Pierre Lassonde, Chairman Franco-Nevada Randall Oliphant, Executive Chairman Raymond Threlkeld, CEO Rainy River Resources TD Securities Mining Conference | January 29-30, 2013 7 7
  • 8.
    Growing resource basein solid jurisdictions Measured & Indicated Gold Resources per 1,000 shares 50 40 Blackwater 30 New Afton Cerro San 20 Pedro Mesquite 10 - (1) 2009 2010 2011 Today El Morro(3) Track record of increasing M&I gold Operating assets resources on a ‘per share’ basis Peak Mines Development projects Notes: 1. Excludes resources from Amapari which was sold in April 2010. 2. Refer to Appendix 6 for detailed disclosure on Reserve and Resource calculations. Measured and Indicated Resources inclusive of Reserves, and Capoose Indicated Resources of 384koz. 3. New Gold holds a fully carried 30% interest in the El Morro project. TD Securities Mining Conference | January 29-30, 2013 8 8
  • 9.
    Cost trends: NewGold versus industry(1)(2) $800 (1) $736 $643 Total Cash Costs (US$/oz)(2) $600 $566 $557 $478 $464 $465 $400 $446 $418 $410-$430 $200 2008 2009 2010 2011 2012E New Gold provides leverage to gold price Margin +241% (US$/oz) $297 $1,014 Gold price +69% (US$/oz) $863 $1,460 Notes: 1. Industry data per GFMS reports calculated net of by-product credits as at Q3’2012. 2. Refer to Cautionary Statement and note on Total cash cost. TD Securities Mining Conference | January 29-30, 2013 9 9
  • 10.
    New Afton -Successfully commissioned Highlights Reserves(1) • Located 10 kilometres from Kamloops, British Columbia Gold Copper • Dedicated labour force • Commercial and full production achieved ahead 1 Moz 1 Blbs of schedule • Potential to double New Gold’s cash flow at today’s prices Production and Costs LOM Average Annual LOM Cash Costs(2) Production ($1,750)/oz by-product Gold 85Koz $525/oz co-product(3) Copper $1.15/lb 75Mlbs Extracting ore from underground Notes: 1. Refer to website for detailed disclosure on Reserve and Resource calculations. 2. Refer to Cautionary Statement and note on Total cash cost. 3. Co-product cash cost calculated based on relative percentage of gold and copper revenue, respectively. TD Securities Mining Conference | January 29-30, 2013 10 10
  • 11.
    New Afton –Looking to unlock additional value Value Enhancement Opportunities C-Zone exploration Mill building Mill optimization beyond 11,000 tpd Regional exploration – 111km2 land package Conveyor Ore stockpile TD Securities Mining Conference | January 29-30, 2013 11 11
  • 12.
    El Morro (30%)– A world class project El Morro (30%) Gold Reserve(1) 2.5 Moz Copper Reserve(1) 1.9 Blbs • On June 27, 2012 Ontario Superior Court of Justice validated New Gold/Goldcorp partnership at El Morro Location Chile • Capital fully-funded by 70% partner Goldcorp Mine type Open Pit • 1.2 Moz inferred gold resource at higher gold and Reserves1 – Gold/Copper (Moz/Mlbs) 2.5/1,868 copper grades in deeper portion of La Fortuna deposit Resources1 – Gold/Copper (Moz/Mlbs) 3.0/2,193 • Current Resource entirely within La Fortuna deposit Estimate mine life 17 years • Neighbouring El Morro deposit underexplored LOM production/yr (Au koz/Cu Mlbs)2 90/85 • Addressing recent temporary suspension of LOM cash cost/oz co-product (Au/Cu)3 $550/$1.45 environmental permit Notes: 1. Refer to Appendix 6 for detailed disclosure on Reserve and Resource calculations. Measured and Indicated Resources inclusive of Reserves. El Morro Reserves and Resources shown on attributable 30% basis. 2. Refer to Cautionary Statements. 3. Refer to Cautionary Statements and note on Total cash cost. Life of mine co-product costs based $1,200/oz gold and $2.75/lb copper. TD Securities Mining Conference | January 29-30, 2013 12 12
  • 13.
    Blackwater – Arobust project Blackwater Preliminary Economic Assessment Average Annual Gold Production(3) 507,000 ounces Average Total Cash Costs(3) $536 per ounce • Consolidated significant land position – 1,000km2 • Year-round accessibility for drilling/development Location Canada • Central British Columbia near infrastructure Proposed mine type Open Pit • Ability to fund continued exploration/development M&I Resources1 – Gold/Silver (Moz) 7.5/36.9 internally Inferred Resources1 – Gold/Silver (Moz) 2.7/28.3 – Development capital $1.8 billion including 24%, or $346 million contingency Targeted production2 2017 • Tax synergies with New Afton Notes: 1. Refer to Appendix 6 for detailed disclosure on Reserve and Resource calculations. 2. Blackwater start date based on indicative timeline which is dependent on continued exploration success, environmental approvals and the determination that the deposit is economically viable. 3. Averages based on first 15 years of production. Refer to Cautionary Statement and note on Total cash costs and PEA additional cautionary note. TD Securities Mining Conference | January 29-30, 2013 13 13
  • 14.
    Preliminary Economic Assessment(“PEA”) in review (1) Spot Case Base Case September 20, 2012 Gold Price (US$/oz) $1,275 $1,600 $1,775 $1,800 Silver Price (US$/oz) $22.50 $30.00 $34.50 $35.00 US$/CDN$ Foreign Exchange 0.94 0.97 1.00 1.00 5% NPV ($ billions) (2015) Pre-tax NPV 1.7 3.3 4.2 4.3 After-tax NPV 1.1 2.2 2.8 2.9 IRR (%) Pre-tax IRR 16.4 25.9 30.4 31.1 After-tax IRR 14.0 22.0 25.8 26.4 Payback period (years) Pre-tax payback period 4.7 3.0 2.6 2.5 After-tax payback Period 4.8 3.1 2.7 2.6 Highlights • Initial gold production targeted for 2017 • First five years – average annual gold production of 569,000 ounces at total cash costs(1) per ounce sold, net of by product sales, of $467 per ounce Blackwater expected to generate solid economic returns in current capital cost environment, even when using a long-term gold price assumption of US$1,275 per ounce Note: 1. Refer to Cautionary Statement and note on Total cash costs and PEA additional cautionary note. TD Securities Mining Conference | January 29-30, 2013 14 14
  • 15.
    Blackwater – Areamap ~112km to Vanderhoof Capoose Resource Blackwater ~160km to Project Prince George 50km Current resource grid 80km TD Securities Mining Conference | January 29-30, 2013 15 15
  • 16.
    Blackwater – Indicativetimeline • Remains unchanged from mid-2011 targeted timeline 2012 2013 2014 2015 2016 2017 Development activity H1 H2 H1 H2 H1 H2 H1 H2 H1 H2 H1 H2 First Nations & Public Consultation Drilling Preliminary Economic Assessment Base Line Environmental Studies Project Description/Terms of Reference Environmental Assessment Reports Provincial Approval Federal Approval Feasibility Study Engineering Procurement Construction Production Target Reflects critical path in timeline Notes: 1. Indicative timeline is dependent on permit approvals. There is no assurance this timeline will be achieved nor that the deposit will ever reach the production stage. TD Securities Mining Conference | January 29-30, 2013 16 16
  • 17.
    A future ofgrowth • El Morro and Blackwater expected to double New Gold’s gold production by 2017 at low cost 1,000 800 Gold production (thousand ounces) 600 2013 Guidance - February 5, 2013 ~450 - 500 405 - 445 400 387 200 2011A 2012E 2013E 2017E TD Securities Mining Conference | January 29-30, 2013 17 17
  • 18.
    Net asset valueper share appreciation Net Asset Value(1) $15.00 High Share price ~1.5x 6/1/09 Today NAVPS Closing of $13.00 P/NAV Richfield Current acquisition ~0.9x Mesquite, Cerro San Pedro, Peak $11.00 High ~ $875 $1,775 Completed $1.2bn ~1.5x US$ NAV and Share price business combination with Western Goldfields New Afton $9.00 High ~ $120 $1,491 ~1.5x $7.00 Low ~0.7x El Morro(2) High $5.00 ~1.5x ~ $40 $694 349% increase in NAVPS $3.00 Blackwater(3) 214% increase in share price $-- $1,451 $1.00 1-Jun-09 2-Apr-12 23-Jan-13 24-Mar-10 14-Jan-11 11-Jun-11 19-Aug-10 28-Aug-12 27-Oct-09 6-Nov-11 28-Jan-13 Source: Broker Reports, Company Estimates and Announcements, Bloomberg. Notes: 1. Street consensus NAV. 2. Current street consensus NAV for El Morro; Includes $50mm cash payment received from Goldcorp as part of transaction consideration. 3. New Gold purchased Richfield for C$480 million and Silver Quest for C$110 million. The deals closed on June 1, 2011 and December 23, 2011, respectively. TD Securities Mining Conference | January 29-30, 2013 18 18
  • 19.
    The New Goldinvestment thesis EXPERIENCED BOARD AND MANAGEMENT FULLY FUNDED COMPANY WITH STRONG BALANCE SHEET DIVERSIFIED ASSET BASE IN MINING FRIENDLY JURISDICTIONS ORGANIC GROWTH OPPORTUNITIES/METAL OPTIONALITY PRODUCTION GROWTH/MARGIN EXPANSION INCREASING UNDERLYING ASSET VALUE MULTIPLE CATALYSTS COMPELLING INVESTMENT PROPOSITION TD Securities Mining Conference | January 29-30, 2013 19 19
  • 20.
    Appendix Appendices Page 1. Financial information 21 2. Operating performance 27 3. New Afton 30 4. El Morro 35 5. Blackwater 38 6. Reserves and resource notes 58 7. Commodity price/foreign 63 exchange assumptions TD Securities Mining Conference | January 29-30, 2013 20 20
  • 21.
    Appendix 1 Summary of debt Undrawn Credit Senior Notes Senior Notes El Morro Facility (April 2012) (November 2012) Funding Loan Face Value $150 million(1) $300 million $500 million $56 million Maturity 3 years with annual April 15, 2020 November 15, 2022 n/a extensions permitted Interest Rate See ‘Key features’ 7.00% 6.25% 4.58% Payable Revolving credit Semi-annually Semi-annually Upon start of production Conversion price n/a n/a n/a n/a Current trading n/a ~106 ~102 n/a value Key features Normal financial • Senior unsecured • Senior unsecured New Gold to covenants • Redeemable after • Redeemable after repay Goldcorp April 15, 2016 at November 15, 2017 out of 80% of its Interest Rate 103.5% down to at par plus half 30% share of • 3% over LIBOR 100% of face after coupon, declining cash flow once El based on ratios 2018 ratably to par Morro starts • Standby fee of • Unlimited dividends • Unlimited dividends production 0.75% if leverage ratio if leverage ratio below 2:1 below 2:1 Notes: 1. $50 million currently allocated for Letters of Credit. TD Securities Mining Conference | January 29-30, 2013 21 21
  • 22.
    Appendix 1 Trend of expanding margins continues $1,800 $1,575 $1,560 $1,600 $1,460 $1,486 $1,032 $1,117 $1,400 $1,014 $1,014 Realized gold price $1,194 (US$/oz) $1,200 $987 $766 Margin (US$/oz) $1,000 $863 US$/oz $522 Cash Cost(1) $800 $297 (US$/oz) $600 $566 $543 $400 $465 $446 $472 $443 $428 $200 $0 2008A 2009A 2010A 2011A Q1'12 Q2'12 Q3'12 Note: 1. Refer to Cautionary Statement and note on Total cash cost. TD Securities Mining Conference | January 29-30, 2013 22 22
  • 23.
    Appendix 1 2012 third quarter financial highlights Earnings from Mine Operations Adjusted Net Earnings per Share ($ millions) ($ per share) $100 $0.15 $77 $76 $78 $76 $0.11 $75 $0.10 $0.10 $0.10 $0.09 $50 $0.05 $25 - - Q3'12 Q2'12 Q1'12 Q3'11 Q3'12 Q2'12 Q1'12 Q3'11 Cash Generated from Operations before Working Capital Net Cash Generated from Operations ($ millions) ($ millions) $100 $91 $100 $80 $82 $80 $71 $75 $75 $47 $46 $50 $50 $37 $25 $25 - - Q3'12 Q2'12 Q1'12 Q3'11 Q3'12 Q2'12 Q1'12 Q3'11 TD Securities Mining Conference | January 29-30, 2013 23 23
  • 24.
    Appendix 1 2012 third quarter operating results 2012 Third Quarter 2012 Nine Months Earning from Earning from Gold sales Cash cost(1) Gold sales Cash cost(1) Mine Operations Mine Operations (000s ounces) ($/oz) (000s ounces) ($/oz) ($mm) ($mm) Mesquite 32 $722 $13 113 $664 $58 Cerro San Pedro 34 $218 $41 103 $205 $123 Peak Mines 22 $796 $15 64 $772 $42 New Afton 7 ($955) $8 7 ($955) $8 95 $443 $77 286 $486 $231 Note: 1. Refer to Cautionary Statement and note on Total cash cost. TD Securities Mining Conference | January 29-30, 2013 24 24
  • 25.
    Appendix 1 Track record of per share growth outperforming gold Average gold price increased by 62% from 2009 through 2011 Adjusted earnings per share Net cash generated from operations per share $0.44 267% 104% $0.53 $0.48 $0.30 $0.26 $0.12 2009 2010 2011 2009 2010 2011 Net asset value per share(1)(2) Measured & Indicated gold resource per 1,000 shares(3) $11.02 25% 348% 40.8 32.7 $6.68 $2.46 6/1/09 12/31/10 12/31/11 12/31/10 12/31/11 Notes: 1. Net asset value as at June 1, 2009 based on New Gold and Western Goldfields business combination. 2. Based on average of consensus net asset value per share ascribed by analysts covering New Gold. 3. Measured and Indicated gold resource shown inclusive of reserves. TD Securities Mining Conference | January 29-30, 2013 25 25
  • 26.
    Appendix 1 2012 guidance Gold production(1) Total cash cost(1) 405 - 445Koz $410 - $430/oz 2012 cash cost estimate assumes: 2012 Guidance • $30.00 per ounce silver Gold production Total cash cost(1) • $3.50 per pound copper (ounces) ($/oz) • Parity Australian dollar Mesquite 140,000 - 150,000 $710 - $730 • Parity Canadian dollar Cerro San Pedro 140,000 - 150,000 $250 - $270 Total company cash cost subject to following sensitivities: Peak Mines 90,000 - 100,000 $640 - $660 • +/- $1.00 per ounce silver ~ +/- $5 per ounce • +/- $0.25 per pound copper ~ +/- $25 per ounce New Afton 35,000 - 45,000 ($1,200) - ($1,300) • +/- $0.05 AUD FX ~ +/- $10 per ounce Total 405,000 - 445,000 $410 - $430 • +/- $0.05 CDN FX ~ +/- $5 per ounce Notes: 1. Refer to Cautionary Statement and note on Total cash cost. TD Securities Mining Conference | January 29-30, 2013 26 26
  • 27.
    Appendix 2 Mesquite 2011 Actual & 2012 Guidance Gold production (ounces) 2011A 2012E 140,000 - 150,000 Tonnes processed 11,733 12,500 – 13,500 (000 tonnes) Tonnes mined 45,973 45,000 – 47,000 (000 tonnes) Total cash cost ($ per ounce) Grade - gold (g/t) 0.57 0.50 – 0.55 $710 - $730 Capital 19 ~14 ($ million) 2011A versus 2012E Key assumptions and sensitivities • Lower strip ratio to result in higher ore tonnes • Diesel comprises ~20% of Mesquite’s total costs processed • Rack diesel price most correlated to Brent oil price • Gold grade is expected to decline from 2011 − Brent oil price increased by 13% since levels beginning of 2011 • Increase in costs primarily driven by lower • Every 10% change in diesel price has ~$15 per gold production ounce impact on costs Notes: 1. Mesquite life-of-mine recovery continues to track at ~75% for oxide; ~35% for sulphides. TD Securities Mining Conference | January 29-30, 2013 27 27
  • 28.
    Appendix 2 Cerro San Pedro 2011 Actual & 2012 Guidance Gold production (ounces) 2011A 2012E 140,000 - 150,000 Tonnes processed 16,763 14,000 – 15,000 (000 tonnes) Silver production (million ounces) Tonnes mined 33,276 31,000 – 33,000 1.9 - 2.1 (000 tonnes) Grade - gold (g/t) 0.48 0.55 – 0.60 Total cash cost ($ per ounce) Grade – silver (g/t) 24 20 – 25 $250 - $270 Capital 7 ~16 ($ million) 2011A versus 2012E Key assumptions and sensitivities • Expected production of gold and silver consistent • Silver price - $30 per ounce (2011A - $35.15/oz) with 2011 • Mexican Peso: U.S. foreign exchange – 13:1 • Decrease in tonnes processed offset by • $1.00 per ounce change in silver equals ~$15 per grade and recovery movements ounce change in Cerro San Pedro cash cost • Increase in costs primarily driven by lower silver • 1.0 change in Mexican Peso equals ~$15 per by-product price assumption ounce change in Cerro San Pedro cash cost Notes: 1. Cerro San Pedro life-of-mine recovery continues to track at: Gold – ~60%, Silver – ~30%. TD Securities Mining Conference | January 29-30, 2013 28 28
  • 29.
    Appendix 2 Peak Mines 2011 Actual & 2012 Guidance Gold production (ounces) 2011A 2012E Tonnes processed 90,000 - 100,000 783 780 – 800 (000 tonnes) Tonnes mined 755 780 – 800 Copper production (million pounds) (000 tonnes) 12 - 14 Grade - gold (g/t) 3.94 4.0 – 4.2 Grade – copper (%) 0.93 0.88 – 0.90 Total cash cost ($ per ounce) Recovery – gold (%) 89 88 – 90 $640 - $660 Recovery – copper (%) 82 85 - 87 Capital 50 ~60 ($ million) 2011A versus 2012E Key assumptions and sensitivities • Increased gold production driven by increases in • Copper price - $3.50 per pound (2011A - $3.78/lb) tonnes processed, gold grades and recoveries • Australian dollar: U.S. foreign exchange – 1:1 • Similar copper production a result of increased • $0.25 per pound change in copper equals ~$35 per tonnes processed and copper recoveries offset ounce change in Peak cash cost by lower copper grades • 0.01 change in Australian dollar equals ~$10 per ounce change in Peak cash cost TD Securities Mining Conference | January 29-30, 2013 29 29
  • 30.
    Appendix 3 Block cavemines TD Securities Mining Conference | January 29-30, 2013 30 30
  • 31.
    Appendix 3 New Afton – 2012 production start-up • The combination of over six months of active underground mining and the existence of the ore stockpile led to an efficient mill start-up • Mill started on June 28, 2012 • Commercial production achieved on July 31, 2012 Tonnes per day 15,000 Period of drawdown of stockpile inventory Mill reaches 11,000 12,500 tpd 10,000 7,500 Mining/milling rate reach 11,000 tpd run- 5,000 rate level Mill starts in June and reaches 2,500 6,600 tpd commercial rate in August - January March May July September November January March 2012 2013 Mine tpd Mill feed tpd TD Securities Mining Conference | January 29-30, 2013 31 31
  • 32.
    Appendix 3 Production andsales New Afton 2012 Guidance Gold production (ounces) Tonnes processed (000 tonnes) 1,900 – 2,200 35,000 - 45,000 Grade - gold (g/t) 0.75 – 0.85 Grade - copper (%) 0.85 – 0.95 Copper production (million pounds) Recovery – gold (%) 88 – 90 30 - 35 Recover – copper (%) 88 – 90 Gold sales (ounces) • Difference between production and sales a result of pre-commercial production 20,000 - 30,000 commodity sales being net against capital costs and timing of certain concentrate sales Copper sales (million pounds) 20 - 25 TD Securities Mining Conference | January 29-30, 2013 32 32
  • 33.
    Appendix 3 Operating costs • Operating costs ~$25 per tonne in first five months of commercial production(1) – Life-of-mine average ~$18 - $22 per tonne ~$6.20/t ~$4.60/t ~$9.20/t Processing Mining G&A 2012 co-product cash cost(3) 2012 by-product cash cost(2) $630 - $650 per ounce, ($1,200) - ($1,300) per ounce $1.35 - $1.45 per pound • Costs expected to be lower in future years as ‘per tonne’ cost reaches steady-state level – Life-of-mine average by-product cost ~($1,750)(4) – Life-of-mine average co-product costs(4) of ~$525 per ounce gold and ~$1.15 per pound copper Notes: 1. Includes treatment and refining charges and assumes parity Canadian/U.S. dollar foreign exchange rate. 2. Assumes $3.50 per pound copper price and parity Canadian/U.S. dollar foreign exchange rate. 3. Co-product costs calculated on a percentage of revenue basis and assume a gold price of $1,600 per ounce. 4. Based on assumption of $1,600 per ounce gold, $3.50 per pound copper and a parity foreign exchange rate. TD Securities Mining Conference | January 29-30, 2013 33 33
  • 34.
    Appendix 3 New Afton – C Zone exploration • 3 phase underground core drilling program totaling 40,000 meters commencing Q3 2012 • Phase 1: ~15,000 meters to delineate eastern limits of C-zone and assess potential to lower block cave extraction level for B3 reserve block - estimated completion by end Q1’13 • Phases 2 & 3: ~25,000 meters to explore extensions to west and at depth - estimated completion Q4’13 C Zone Resource (2010) Tonnes Au Cu Gold Copper 000’s g/t % Koz Mlbs M&I 3,637 0.78 0.96 92 76 Inferred 11,317 0.60 0.75 218 186 Cross Long Section Section Looking South Looking East TD Securities Mining Conference | January 29-30, 2013 34 34
  • 35.
    Appendix 4 El Morro (30%) – funding structure(1) Total Capital 100% 100% Average annual ~ $3.9 billion cash flow 30% 70% Funded by ~ $2.7 billion $1.2 billion 30% 70% interest at 4.58% 20% 80% Carried funding repayment • New Gold’s 30% share of development capital 100% carried – Interest fixed at 4.58% Notes: 1. Based on 2011 Feasibility Study. TD Securities Mining Conference | January 29-30, 2013 35 35
  • 36.
    Appendix 4 Selected porphyry gold/copper deposits/mines(1) Gold Grade (g/t) 0.80 0.70 0.60 $38/t $42/t El Morro 0.50 $51/t 0.40 $27/t $40/t 0.30 $24/t $49/t 0.20 0.10 $29/t Copper -- Grade 0.10% 0.20% 0.30% 0.40% 0.50% 0.60% 0.70% (%) Agua Rica Alumbrera Cadia-Ridgeway (2) Cerro Casale Chapada Cobre Panama El Morro Mt. Milligan Source: Company disclosure. Notes: 1. Circle sizes are representative of contained metal value of the reserves per tonne of reserve. Contained metal value calculated using Street research consensus long-term commodity pricing. 2. Includes “Cadia East Underground” and “Ridgeway Underground” reserves as indicated in Newcrest’s February 10, 2012 press release; does not include “Other” Cadia province reserves. TD Securities Mining Conference | January 29-30, 2013 36 36
  • 37.
    Appendix 4 El Morro relative positioning(1) El Morro within Goldcorp portfolio (2) Gold Reserves Gold Equivalent Asset Asset (Moz) (Moz) Penasquito 16.5 Penasquito 45.2 Pueblo Viejo 10.1 El Morro 15.4 Los Filos 7.8 Pueblo Viejo 11.8 El Morro 5.8 Los Filos 8.7 Cerro Negro 4.5 Cerro Negro 5.2 Notes: 1. Based on Goldcorp’s December 31, 2011 year-end resource statements. 2. Gold equivalent calculated based on the following commodity prices: Gold - $1,595/oz; Silver - $28.75/oz; Copper - $3.50/lb; Lead - $0.88/lb; Zinc - $0.86/lb. TD Securities Mining Conference | January 29-30, 2013 37 37
  • 38.
    Appendix 5 Blackwater drillprogram Cumulative number Cumulative number Drilling cut-off date of holes of metres March 2011 December 31, 2010 77 24,563 Initial Resource September 2011 July 31, 2011 148 49,223 Resource update Year-end 2011 November 30, 2011 218 67,848 Resource update March 2012 December 31, 2011 261 89,460 Resource update April 2012 March 5, 2012 328 115,950 2012 assays received July 2012 May 14, 2012 449 149,739 Resource update TD Securities Mining Conference | January 29-30, 2013 38 38
  • 39.
    Appendix 5 Blackwater – Project overview • Start of production in 2017 • Conventional truck and shovel open pit mine with 60,000 tonnes per day processing plant • Life-of-mine strip ratio of 2.36 to 1 • Low grade stockpiling strategy • Simple, conventional flowsheet using whole ore leach process • Life-of-mine gold and silver recoveries of 87% and 53%, respectively • Conventional waste rock and Tailings Storage Facility • Power supply from the hydroelectric power grid, via 133 kilometre transmission line • Minimal off-site infrastructure required – Good existing access road; water supply within 15 kilometres • Low environmental risk and facility designed for closure TD Securities Mining Conference | January 29-30, 2013 39 39
  • 40.
    Appendix 5 PEA resource summary • The deposit contains an Indicated mineral resource of 267 Mt at 0.88 g/t Au and 4.3 g/t Ag and an Inferred mineral resource of 121 Mt at 0.69 g/t Au and 7.3 g/t Ag at a base case lower cut-off of 0.30 gram per tonne gold equivalent • Mineral estimate is CIM 2010 compliant and prepared under Canadian National Instrument 43-101 – Based upon geologic block model that incorporated over 147,282 individual assays from 168,709 metres of diamond drill core in 449 drill holes – Average drill hole spacing of approximately 50 metres is sufficient to support mineral resource estimation up to the Indicated category • Mineral resource includes drill data received through May 14, 2012 Blackwater Project PEA Mineral Resource Estimate Indicated Mineral Resource Inferred Mineral Resource AuEq AuEq Cut-off Tonnes Au Ag Au Ag Cut-off Tonnes Au Ag Au Ag (g/t) (Mt) (g/t) (g/t) (Moz) (Moz) (g/t) (Mt) (g/t) (g/t) (Moz) (Moz) 0.25 280.4 0.85 4.2 7.64 37.9 0.25 128.6 0.66 7.0 2.72 28.9 0.30 267.1 0.88 4.3 7.52 36.9 0.30 120.5 0.69 7.3 2.66 28.3 0.40 230.6 0.96 4.6 7.14 34.1 0.40 98.9 0.77 7.8 2.45 24.8 Notes: 1. Mineral Resource Estimate has an effective date of July 27, 2012 and was prepared by Ronald G. Simpson, P Geo. 2. Mineral Resources that are not Mineral Reserves do not have demonstrated economic viability. 3. Mineral Resources are amenable to open pit mining methods as defined by a Lerchs-Grossmann optimized pit simulation. 4. The Lerchs-Grossmann optimized pit is based on assumptions that include US$/CDN$ parity foreign exchange rate, 83.6% Au recovery, 44.9% Ag recovery, $1.52/tonne mining cost, $1.90/tonne waste mining cost, $10.52/tonne process and G&A cost. No allowances have been made for mining losses and dilution. The average pit slope angle is assumed to be 40°. 5. The base case gold equivalent (AuEq) cut-off (bolded) is greater than the conceptual marginal cut-off of 0.23 g/t. 6. AuEq = $24/oz Ag x 44.9% / $1,300/oz x 83.6%. 7. Gold analyses are performed by fire assay/AA finish methods and silver analyses are performed by Induction Coupled Plasmaspectrometry (ICP). Silver ICP analyses are not known with the same precision and do not have the same quality control support as gold fire assay analyses. 8. Rounding as required by reporting guidelines has been used, and totals may not sum. TD Securities Mining Conference | January 29-30, 2013 40 40
  • 41.
    Appendix 5 Blackwater PEA costs - Capital Project Development Capital Costs • Project is located 112 kilometres southwest Description Cost ($ million) from Vanderhoof and has access to low cost hydroelectric power Direct Costs Mining & Pre-production Development $208 • Development capital estimate of $1.8 billion is inclusive of a 24% or $346 million On Site Infrastructure $181 contingency Process $539 • Development capital estimated based on the Tailing and Water Reclaim $74 current cost environment Infrastructure (Power, Water, Road) $85 Total Direct Costs $1,087 – A parity foreign exchange rate was assumed and the capital estimate was Owner's and Indirect Costs held constant in the economic analysis Owner's Costs $54 • Sustaining capital of $537 million, reclamation EPCM $112 and closure costs of $95 million and $72 million Other Indirects $215 in equipment salvage value Total Owner's and Indirect Costs $381 Subtotal $1,468 Total development and sustaining Contingency (24%) $346 capital estimated at $294 per Total Project $1,814 recoverable gold ounce TD Securities Mining Conference | January 29-30, 2013 41 41
  • 42.
    Appendix 5 Blackwater PEA costs - Operating Mining Costs Project Operating Costs 4% 4%2% Hauling Area Unit Cost (C$/t milled) $ per gold ounce produced 4% Auxiliary Mining $6.21 $259 6% Blasting G&A Processing $7.59 $317 9% Drilling 59% General and Administrative $0.95 $40 11% Loading General Maint. Royalty (0.6%) $0.18 $8 General Mine Refining $0.23 $9 Silver by-product sales at $22.50 per ounce silver ($2.16) ($90) Processing Costs 1% Reagents Total cash costs(1) net of by-product sales $13.01 $543 6% 8% Grinding Total Cash Costs (1) Schedule Media/liners Electricity 17% 44% Production Years $ per gold ounce produced Labour Years 1 through 5 $467 Maint materials 24% Years 1 through 15 $536 Water Supply Years 16 through 17 $678 Life-of-mine $543 Blackwater’s location near infrastructure, low stripping ratio, access to low cost power and silver by-product revenue expected to result in the Project having well below industry average cash costs Note: 1. Refer to Cautionary Statement and note on Total cash costs and PEA additional cautionary note. TD Securities Mining Conference | January 29-30, 2013 42 42
  • 43.
    Appendix 5 Open pit mining cost $4.00 $3.50 Mining cost per tonne moved (US$/t) $3.00 $2.50 Cerro San Pedro $2.00 Blackwater $1.50 Mesquite $1.00 $0.50 - - 30 60 90 120 150 1,000 tonnes per day Hycroft Prosperity Blackwater Malartic (start-up) Cerro San Pedro Marigold Rainy River Morelos Haile Malartic (technical report) Rosemont Detour (LOM) Mt. Milligan Donlin Creek Copper Mountain Mesquite La India Young Davidson Pinos Altos Detour (first ten years) Note: 1. Company technical reports and investor presentations. 2. Malartic mining cost shown during start-up phase and life-of-mine estimate from technical report on May 10, 2011. 3. Detour mining cost shown for first ten years and life-of-mine based on updated mine plan from September 4, 2012 news release. TD Securities Mining Conference | January 29-30, 2013 43 43
  • 44.
    Appendix 5 Production and cash costs profile Life-of-mine Gold production – 489koz Total cash costs - $543/oz Years 1 through 5 Years 1 through 15 Years 16 through 17 Gold production – 569koz Gold production – 507koz Gold production – 296koz Total cash costs - $467/oz Total cash costs - $536/oz Total cash costs - $678/oz 700 $1,000 Gold production Base Case cash costs 600 $750 500 Gold production (thousand ounces) Total Cash Costs ($/oz) (1) 400 $500 300 200 $250 100 - - 2017 2018 2019 2020 2021 2022 2023 2024 2025 2026 2027 2028 2029 2030 2031 2032 2033 Note: 1. Refer to Cautionary Statement and note on Total cash costs and PEA additional cautionary note. TD Securities Mining Conference | January 29-30, 2013 44 44
  • 45.
    Appendix 5 PEA highlights(1) PEA Results Base Case Spot Case Gold Price (US$/oz) $1,275 $1,775 Silver Price (US$/oz) $22.50 $34.50 US$/CDN$ Foreign Exchange 0.94 1.00 After-tax NPV(5%) ($ billions) $1.1 $2.8 After-tax IRR 14.0% 25.8% After-tax payback period (years) 4.8 2.7 Operating cash flow ($ millions) Base Case Spot Case $900 • Average spot case $750 cash flow during first Operating cash flow five years of ~$655 $600 million $450 • Cumulative spot case $300 cash flow during first five years of ~$3.3 $150 billion $0 2017 2018 2019 2020 2021 Note: 1. Refer to Cautionary Statement and note on Total cash costs and PEA additional cautionary note. TD Securities Mining Conference | January 29-30, 2013 45 45
  • 46.
    Appendix 5 Perspectives on capital costs • Blackwater development capital After-tax IRR (%)(1)(2) cost of $1.8 billion inclusive of 24%, or $346 million, contingency Gold price ($/oz) – $227 per recoverable ounce $1,275 $1,600 $1,775 $1,800 • Costed in mid-2012 capital environment assuming parity Development capital ($ billions) $1.5 18.1% 27.5% 31.8% 32.5% foreign exchange rate • Capital intensity may be abating $1.6 16.6% 25.4% 29.6% 30.2% • Large diversified companies, accounting for ~55% of global $1.7 15.2% 23.6% 27.6% 28.2% capital, delaying certain projects • Oil sands project expansions also $1.8 14.0% 22.0% 25.8% 26.4% being delayed • Each $100 million change in development capital equates to a ~$100 million change in NPV New Gold could benefit from announced delays in capital projects of major companies Note: 1. Refer to Cautionary Statement and note on Total cash costs and PEA additional cautionary note. 2. IRR calculated to beginning of construction period in 2015. TD Securities Mining Conference | January 29-30, 2013 46 46
  • 47.
    Appendix 5 Total acquisition cost (“TAC”) • Acquisition costs of $602(1) million Total Acquisition Cost per Ounce based on: Total – Richfield - $470 million ($mm) $ Per Ounce (2) – Silver Quest - $114 million Total Acquisition costs to date $602 $75 – Geo Minerals - $18 million Development capital $1,814 $227 Life-of-mine sustaining capital $537 $67 • Total acquisition cost of $912 per Life-of-mine average cash costs ($/oz) (3) $543 ounce below recent industry Total acquisition cost ($/oz) $912 comparable transactions – Further potential to decrease Spot gold price ($/oz) $1,775 break-even gold price with continued resource expansion (Discount)/Premium to spot gold (49%) Break-even gold price $912 Notes: 1. Per 2011 Annual financial statements. 2. Per ounce calculations based on 6.2 million ounces from the Indicated category and 1.8 million ounces from the Inferred category. 3. Refer to Cautionary Statement and note on Total cash costs and PEA additional cautionary note. TD Securities Mining Conference | January 29-30, 2013 47 47
  • 48.
    Appendix 5 Areas ofoptimization Potential for expansion of the resource to the north and to depth Further geotechnical drilling to assess the possibility of steepening pit slopes Potential to reduce mining costs through mine plan optimization Optimizing process flowsheet TD Securities Mining Conference | January 29-30, 2013 48 48
  • 49.
    Appendix 5 Blackwater ResourceGrowth – July 2012 July 2012 Indicated Inferred Mt Au g/t Mt Au g/t 267 0.88 121 0.69 7.5 Moz 2.7 Moz Cumulative Drilling Holes Metres 449 147,282 TD Securities Mining Conference | January 29-30, 2013 49 49
  • 50.
    Appendix 5 Blackwater – July 2012 drill results July 18, 2012 Notes: 1. For complete summary of 2012 assay results, refer to New Gold website at www.newgold.com. TD Securities Mining Conference | January 29-30, 2013 50 50
  • 51.
    Appendix 5 Blackwater BlockModel – July 2012 NW Silver Zone TD Securities Mining Conference | January 29-30, 2013 51 51
  • 52.
    Appendix 5 BW Section5892,800N – July 2012 Block Model TD Securities Mining Conference | January 29-30, 2013 52 52
  • 53.
    Appendix 5 BW Section375,500E – July 2012 Block Model Silver Zone TD Securities Mining Conference | January 29-30, 2013 53 53
  • 54.
    Appendix 5 Blackwater regionalexploration 17 TD Securities Mining Conference | January 29-30, 2013 54 54
  • 55.
    Appendix 5 Blackwater PEAmineral resource NW Silver Zone Sxn 5893,500N SW Breccia Pipe Sxn 375,000E TD Securities Mining Conference | January 29-30, 2013 55 55
  • 56.
    Appendix 5 Blackwater explorationupside opportunities Section 5893,500N Gold Section 375,000E NW ‘Silver Zone’ SW Breccia Pipe TD Securities Mining Conference | January 29-30, 2013 56 56
  • 57.
    Appendix 5 Blackwater explorationupside opportunities (cont’d) Section 5893,500N Silver Section 375,000E NW ‘Silver Zone’ SW Breccia Pipe TD Securities Mining Conference | January 29-30, 2013 57 57
  • 58.
    Appendix 6 Reserves andresource notes Mineral Reserves statement as at December 31, 2011 Metal grade Contained metal Tonnes Gold Silver Copper Gold Silver Copper 000's g/t g/t % Koz Koz Mlbs Mesquite Proven 14,548 0.67 - - 313 - - Probable 138,796 0.55 - - 2,448 - - Mesquite P&P 153,345 0.56 - - 2,762 - - Cerro San Pedro Proven 23,972 0.58 16.99 - 447 13,091 - Probable 35,267 0.49 15.30 - 559 17,352 - Cerro San Pedro P&P 59,239 0.53 15.98 - 1,006 30,443 - Peak Proven 1,608 6.33 8.4 0.82 327 434 29 Probable 1,811 4.80 6.7 0.92 279 390 37 Peak P&P 3,419 5.50 7.5 0.87 606 824 66 New Afton Proven - - - - - - - Probable 47,900 0.64 2.0 0.90 986 3,080 954 New Afton P&P 47,900 0.64 2.0 0.90 986 3,080 954 El Morro 100% 30% Proven 308,036 0.58 - 0.57 1,716 - 1,153 Probable 212,167 0.38 - 0.51 787 - 715 El Morro P&P 520,024 0.50 - 0.54 2,503 - 1,868 TD Securities Mining Conference | January 29-30, 2013 58 58
  • 59.
    Appendix 6 Reserves andresource notes (cont’d) Measured and Indicated mineral Resource statement (inclusive of Reserves) as at December 31, 2011 Metal grade Contained metal Tonnes Gold Silver Copper Zinc Lead Gold Silver Copper Zinc Lead 000's g/t g/t % % % Koz Koz Mlbs Mlbs Mlbs Mesquite Measured - oxide 19,182 0.51 - - - - 316 - - - - Indicated - oxide 269,872 0.39 - - - - 3,407 - - - - Mesquite M&I - oxide 289,054 0.40 - - - - 3,723 - - - - Measured - non oxide 4,688 0.91 - - - - 137 - - - - Indicated - non oxide 79,851 0.65 - - - - 1,674 - - - - Mesquite M&I - non oxide 84,539 0.66 - - - - 1,811 - - - - Total Mesquite 373,594 0.46 - - - - 5,534 - - - - Cerro San Pedro Measured - open pit oxide 25,722 0.44 15.36 - - - 367 12,706 - - - Indicated - open pit oxide 55,647 0.31 12.28 - - - 546 21,976 - - - CSP M&I - open pit oxide 81,369 0.35 13.26 - - - 913 34,682 - - - Measured - open pit sulphide 13,317 0.54 13.60 - 0.64 0.10 232 5,823 - 187 29 Indicated - open pit sulphide 46,697 0.44 10.23 - 0.55 0.08 667 15,355 - 566 77 CSP M&I - open pit sulphide 60,014 0.47 10.98 - 0.57 0.08 899 21,178 - 753 106 Total CSP M&I - open pit 1,812 55,860 Peak Measured 3,092 4.89 7.3 1.14 - - 486 726 78 - - Indicated 3,697 3.89 7.1 1.09 - - 462 844 89 - - Peak M&I 6,789 4.30 7.2 1.11 - - 948 1,570 167 - - New Afton Measured 36,500 0.90 2.7 1.24 - - 1,058 3,194 1,002 - - Indicated 33,300 0.64 2.1 0.80 - - 685 2,276 584 - - New Afton M&I 69,800 0.78 2.4 1.03 - - 1,742 5,470 1,586 - - Blackwater Blackwater Indicated 267,145 0.88 4.3 - - - 7,524 36,932 - - - Capoose Indicated 31,216 0.38 26.5 - - - 384 26,594 - - - El Morro 100% 30% Measured - open pit 343,088 0.55 - 0.54 - - 1,836 - 1,233 - - Indicated - open pit 333,312 0.35 - 0.44 - - 1,117 - 960 - - El Morro M&I - open pit 676,400 0.45 - 0.49 - - 2,954 - 2,193 - - TD Securities Mining Conference | January 29-30, 2013 59 59
  • 60.
    Appendix 6 Reserves andresource notes (cont’d) Inferred Resource statement as at December 31, 2011 Metal grade Contained metal Tonnes Gold Silver Copper Zinc Lead Gold Silver Copper Zinc Lead 000's g/t g/t % % % Koz Koz Mlbs Mlbs Mlbs Mesquite 38,633 0.41 - - - - 512 - - - - Cerro San Pedro Inferred - open pit oxide 40,355 0.17 8.55 - - - 214 11,091 - - - Inferred - open pit sulphide 24,736 0.47 7.40 - 0.50 0.07 374 5,882 - 271 39 588 16,972 - 271 39 Manto Underground sulphides 6,270 1.83 94.51 - 3.09 1.09 368 19,052 - 427 151 Peak 3,147 2.56 4.8 1.54 - - 259 486 107 - - New Afton 29,200 0.51 1.6 0.61 - - 483 1,478 390 - - Blackwater Blackwater 120,478 0.69 7.3 - - - 2,661 28,276 - - - Capoose 37,256 0.37 24.6 - - - 443 29,518 - - - 100% 30% El Morro Open pit 637,495 0.10 - 0.25 - - 605 - 1,045 - - Underground 128,280 0.97 - 0.78 - - 1,205 - 660 - - El Morro Inferred 1,810 1,705 TD Securities Mining Conference | January 29-30, 2013 60 60
  • 61.
    Appendix 6 Reserves and resource notes (cont’d) Mineral reserves are contained within measured and indicated mineral resources. Measured and indicated mineral resources that are not mineral reserves do not have demonstrated economic viability as defined by a technical feasibility study. Inferred mineral resources are not known with the same degree of certainty as measured and indicated resources, do not have demonstrated economic viability, and are exclusive of mineral reserves. Mineral Reserves have been estimated and reported in accordance with the CIM Standards and National Instrument 43-101, or the AusIMM JORC equivalent. 1) Mineral Reserves for the company’s mining operations and development projects have been calculated based on the following metal prices and lower cut-off criteria: Mineral Property Gold (US$/oz) Silver (US$/oz) Copper (US$/lb) Lower Cut-off Mesquite $1,200 - - 0.21 g/t Au – Oxide reserves 0.41 g/t Au – Non-oxide reserves Cerro San Pedro $1,200 $20.00 - US$3.49/t NSR Peak Mines $1,300 $25.00 $2.75 A$130 – 184/t NSR New Afton $1,200 $20.00 $2.50 US$24/t NSR El Morro $1,200 - $2.75 0.20% Cu TD Securities Mining Conference | January 29-30, 2013 61 61
  • 62.
    Appendix 6 Reserves and resource notes (cont’d) 2) Mineral Resources for the company’s mining operations and development projects have been calculated based on the following metal prices and lower cut-off criteria: Mineral Property Gold Silver Copper Zinc Lead Lower Cut-off (US$/oz) (US$/oz) (US$/lb) (US$/lb) (US$/lb) Mesquite $1,300 - - - - 0.11 g/t Au – Oxide resources 0.22 g/t Au – Non-oxide resources Cerro San Pedro $1,300 $24.00 - $1.00 $1.00 0.1g/t AuEq – Oxide resources 0.4g/t AuEq – Open pit Sulphide resources 2.5g/t AuEq – Underground manto resources Peak Mines $1,300 $24.00 $2.75 $0.85 $0.65 A$103 - 137/t NSR New Afton $1,300 $24.00 $2.75 - - 0.40% CuEq – All resources El Morro $1,350 - $3.25 - - 0.15% Cu – Open pit resources 0.20% Cu – Underground resources Blackwater $1,300 - - - - 0.30 g/t AuEq – All resources Capoose $1,025 - - - - 0.40 g/t AuEq – All resources Mineral resources have been estimated and reported in accordance with the standards of the Canadian Institute of Mining, Metallurgy and Petroleum and National Instrument 43-101, or the AusIMM JORC equivalent. 3) Mineral resources are classified as measured, indicated and inferred resources and are reported based on technical and economic parameters consistent with the methods most suitable for their potential extraction and mineral processing. Where different mining and/or processing methods might be applied to different portions of a mineralized system or metal deposit, the designators ‘open pit’ and ‘underground’ have been applied to indicate likely mining method. Likewise the designators ‘oxide’, ‘non-oxide’ and ‘sulfide’ have been applied to indicate the type of mineralization as it applies to appropriate mineral processing method and expected payable metal recoveries. Additional details regarding mineral resource estimation, classification and reporting parameters for each of New Gold’s mines and projects are provided in the respective NI 43-101 Technical Reports and available on SEDAR. 4) Qualified Person: The preparation of New Gold’s mineral reserve and resource statements has been done by Qualfied Persons as defined under Canadian under National Instrument 43-101 under the oversight and review of Mark Petersen, a Qualified Person under National Instrument 43-101 and employee of New Gold. TD Securities Mining Conference | January 29-30, 2013 62 62
  • 63.
    Appendix 7 Commodity price/foreignexchange assumptions Guidance/consensus: 2012 2013 2014 Gold price ($/oz) 1,600 1,760 1,600 Silver price ($/oz) 30.00 34.38 30.00 Copper price ($/oz) 3.50 3.85 3.50 USD/AUD 1.00 1.01 0.96 USD/CAD 1.00 1.00 1.01 USD/MXN 13.00 12.35 12.50 Spot: Spot Gold price ($/oz) 1,655 Silver price ($/oz) 30.85 Copper price ($/oz) 3.65 USD/AUD 1.04 USD/CAD 1.00 USD/MXN 12.76 TD Securities Mining Conference | January 29-30, 2013 63 63
  • 64.
    Contact information Investor Relations Hannes Portmann Vice President, Corporate Development 416-324-6014 hannes.portmann@newgold.com TD Securities Mining Conference | January 29-30, 2013 64 64