New Gold provides its 2018 corporate presentation, which includes the following key points:
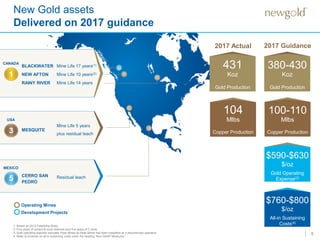
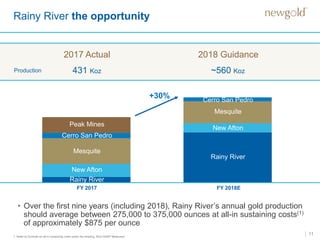
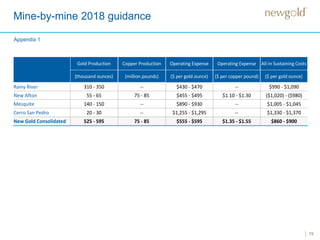
- Guidance for 2018 production of 525-595koz gold and 75-85mlb copper, a 30% increase over 2017.
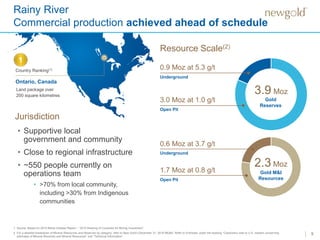
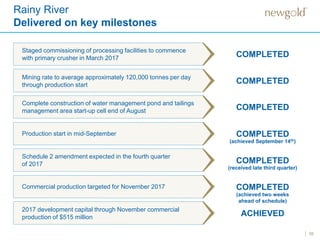
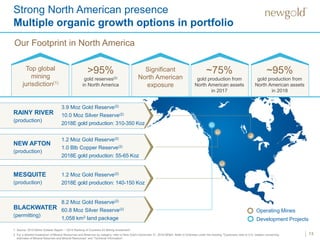
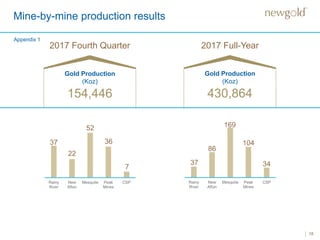
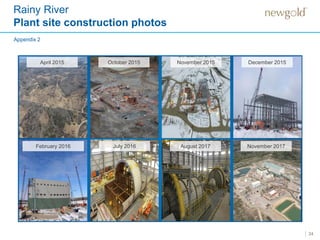
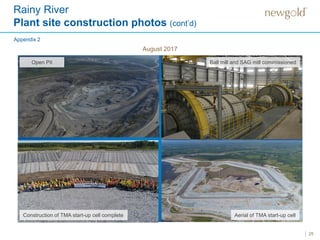
- Rainy River mine achieved commercial production ahead of schedule in November 2017 and is expected to produce 310-350koz gold in 2018.
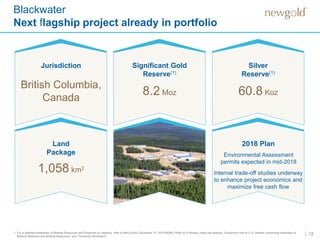
- Blackwater remains the next flagship project in permitting with EA approval expected in mid-2018.
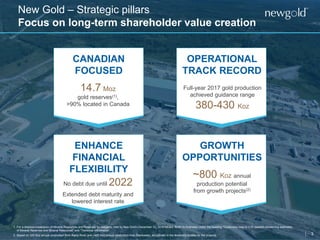
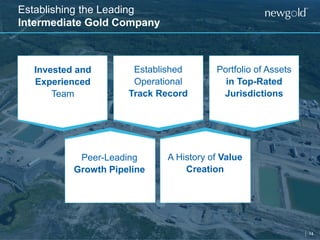
- The company has established an operational track record and focuses on long-term shareholder value through its portfolio of assets in top-rated jurisdictions in Canada and growth opportunities like Rainy River and Blackwater.