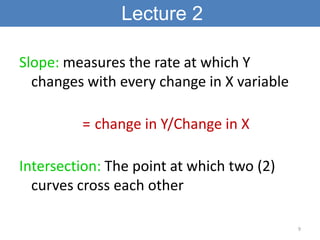
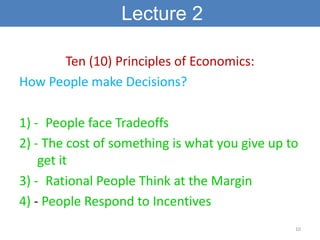
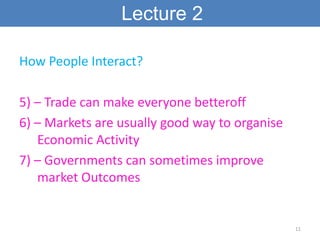
Lecture 2


           Macroeconomics


                                    abdul-Ghaffar


Institute of Management Sciences, HayatAbad

                                                1
Lecture 2

Theory: Theory is a framework that helps you
understand relationships between cause and
effect

Theory is a simplification of an actual relationship

A theory explains the causes of a phenomenon.


                                                  2
Lecture 2

Economic Variables: Quantities that can have more
  than one values e.g; Price, interest rate, income etc

Economic models: Simplified way of expressing how
    some sectors of the economy functions
- Economic models are abstracts (caprture important
    and not ALL details relevant to the phenomenon)
- Economic models rely on assumptions
- It is in the form of logic, graphs or mathematics

                                                          3
Lecture 2

- A good economic model is like a schematic
   diagram. It accurately sets the relationship or
   cause and effect among variables
- An economic model is a tool that helps you
   understand the consequences of a theory
- A good model not only explains phenomena
   better but, also, has the ability to predict
   changes in the economic variables

                                                     4
Lecture 2

Rational Behaviour: Ways of acting for which the
  extra benefit exceeds (greater than) the
  associated extra cost

When your actions are such that the extra benefits
 are exceeding (more than) additional
 expenditures it means you are showing a rational
 behaviour

                                                   5
Lecture 2

Marginal Benefit: The monetary value (rupees or
  dollars or any other currency you are dealing
  in) placed on the satisfaction obtained from
  another unit of an item
Marginal Cost: The sacrifice made to obtain an
  additional unit of an item
A Rational Person continues purchasing
  (marginal cost) an item to the point at which
  there is no additional net gain (marginal
  benefit)
                                              6
Lecture 2


                      Graphs
Origin: On a set of axes, the point designated by
  zero (0) at which variables X and Y both take
  on zero values
Coordinates: A pair pf numbers that sorresponds
  to values for X and Y when plotted on a set of
  axes e.g; (X,Y)

                                                7
Lecture 2

Curve: A straight or curved line drawn to
  connect points plotted on a set of axes
Positive Relationship: Indicates that variable Y
  increases whenever X variable increases. It is
  represented by an upward sloping curve
Negative Relationship: Indicates that Y
  decreases whenever X increases. Downward
  sloping curves

                                                   8
Lecture 2

Slope: measures the rate at which Y
  changes with every change in X variable

         = change in Y/Change in X

Intersection: The point at which two (2)
  curves cross each other

                                            9
Lecture 2

      Ten (10) Principles of Economics:
How People make Decisions?

1) - People face Tradeoffs
2) - The cost of something is what you give up to
    get it
3) - Rational People Think at the Margin
4) - People Respond to Incentives
                                                10
Lecture 2

How People Interact?

5) – Trade can make everyone betteroff
6) – Markets are usually good way to organise
   Economic Activity
7) – Governments can sometimes improve
   market Outcomes


                                                11
Lecture 2

How The Economy as a Whole Works?

8) – A country’s standard of living Depends on
  its ability to produce goods and services
9) – Prices rise when governments print too
  much money
10) – Spcoeity faces a short run tradeoff
  between Inflation and Unemployment

                                                 12
Questions?

        End of Lecture 2

Thank you all (for not sleeping!!!)

                                      13

Principles of macroeconomics

  • 1.
    Lecture 2 Macroeconomics abdul-Ghaffar Institute of Management Sciences, HayatAbad 1
  • 2.
    Lecture 2 Theory: Theoryis a framework that helps you understand relationships between cause and effect Theory is a simplification of an actual relationship A theory explains the causes of a phenomenon. 2
  • 3.
    Lecture 2 Economic Variables:Quantities that can have more than one values e.g; Price, interest rate, income etc Economic models: Simplified way of expressing how some sectors of the economy functions - Economic models are abstracts (caprture important and not ALL details relevant to the phenomenon) - Economic models rely on assumptions - It is in the form of logic, graphs or mathematics 3
  • 4.
    Lecture 2 - Agood economic model is like a schematic diagram. It accurately sets the relationship or cause and effect among variables - An economic model is a tool that helps you understand the consequences of a theory - A good model not only explains phenomena better but, also, has the ability to predict changes in the economic variables 4
  • 5.
    Lecture 2 Rational Behaviour:Ways of acting for which the extra benefit exceeds (greater than) the associated extra cost When your actions are such that the extra benefits are exceeding (more than) additional expenditures it means you are showing a rational behaviour 5
  • 6.
    Lecture 2 Marginal Benefit:The monetary value (rupees or dollars or any other currency you are dealing in) placed on the satisfaction obtained from another unit of an item Marginal Cost: The sacrifice made to obtain an additional unit of an item A Rational Person continues purchasing (marginal cost) an item to the point at which there is no additional net gain (marginal benefit) 6
  • 7.
    Lecture 2 Graphs Origin: On a set of axes, the point designated by zero (0) at which variables X and Y both take on zero values Coordinates: A pair pf numbers that sorresponds to values for X and Y when plotted on a set of axes e.g; (X,Y) 7
  • 8.
    Lecture 2 Curve: Astraight or curved line drawn to connect points plotted on a set of axes Positive Relationship: Indicates that variable Y increases whenever X variable increases. It is represented by an upward sloping curve Negative Relationship: Indicates that Y decreases whenever X increases. Downward sloping curves 8
  • 9.
    Lecture 2 Slope: measuresthe rate at which Y changes with every change in X variable = change in Y/Change in X Intersection: The point at which two (2) curves cross each other 9
  • 10.
    Lecture 2 Ten (10) Principles of Economics: How People make Decisions? 1) - People face Tradeoffs 2) - The cost of something is what you give up to get it 3) - Rational People Think at the Margin 4) - People Respond to Incentives 10
  • 11.
    Lecture 2 How PeopleInteract? 5) – Trade can make everyone betteroff 6) – Markets are usually good way to organise Economic Activity 7) – Governments can sometimes improve market Outcomes 11
  • 12.
    Lecture 2 How TheEconomy as a Whole Works? 8) – A country’s standard of living Depends on its ability to produce goods and services 9) – Prices rise when governments print too much money 10) – Spcoeity faces a short run tradeoff between Inflation and Unemployment 12
  • 13.
    Questions? End of Lecture 2 Thank you all (for not sleeping!!!) 13