This document provides an overview of key economic concepts including:
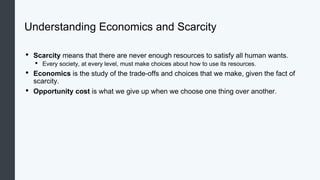
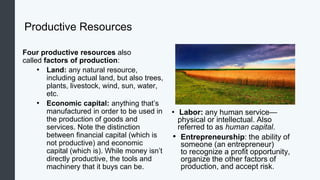
1. Scarcity means resources are limited and choices must be made, while economics studies trade-offs. Productive resources like labor, capital, land and entrepreneurship are inputs for production.
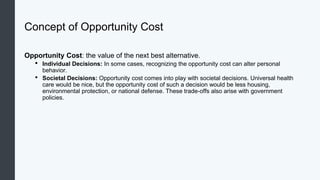
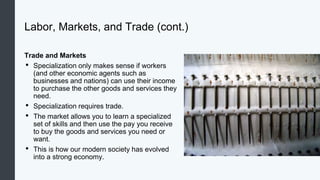
2. Opportunity cost is the value of the next best alternative forgone. It is important for individual, societal and policy decisions. Specialization and trade exist because individuals can use income to purchase goods and services they do not produce.
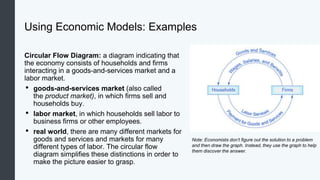
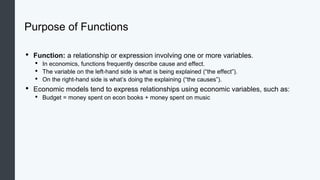
3. Microeconomics focuses on individual agents like households and firms, while macroeconomics examines economy-wide issues like growth, unemployment and inflation. Economic models like the circular flow diagram simplify reality to provide insight. Functions
This document provides an overview of graphing data in economics. It discusses three main types of graphs used - time-series graphs, cross-section graphs, and scatter diagrams. Time-series graphs show a variable over time, cross-section graphs compare variables across groups, and scatter diagrams show the relationship between two variables. The document also discusses key graph elements like axes, trends, slopes, and using graphs to understand relationships between multiple variables.
The document provides an introduction to economics. It discusses [1] how economics deals with scarce resources and unlimited wants, posing problems of what, how, and for whom to produce goods and services, [2] the different types of resources including land, labor, capital, and entrepreneurial talent, and [3] some objectives and pitfalls of economic reasoning including efficiency, equity, and avoiding logical fallacies.
Economists develop theories to explain important economic issues by setting out definitions, assumptions, and testable predictions. They collect data to test theories and provide advice. Theories are represented through models and diagrams, which simplify complex problems. While individual behavior is unpredictable, aggregate outcomes can be predicted statistically. Economists may disagree due to using different benchmarks, timeframes, values, or because multiple perspectives have merit. They present data visually through indexes and graphs to identify relationships between variables.
This document provides an overview of introductory economics concepts. It begins by defining key terms like economics, microeconomics, macroeconomics, and scarcity. It then discusses the basic concepts of supply and demand, explaining the supply-demand curve and factors that can cause shifts in supply and demand. The document also covers price stability, full employment, economic growth, and other basic objectives of economics. It provides examples of inflation and its causes. Overall, the document presents foundational microeconomics concepts.
This document provides an overview of key concepts in managerial economics including:
1. Definitions of economics, microeconomics, macroeconomics, and managerial economics. Managerial economics applies economic theory to business problems.
2. The four factors of production - land, labor, capital, and entrepreneurship. These are combined by businesses to produce goods and services.
3. The circular flow of economic activity between households, firms, government, and foreign sectors. Income and expenditure flow continuously between these groups.
This document provides an overview of key concepts in macroeconomics. It defines macroeconomics as dealing with the study of the national economy in aggregate terms. It outlines the key differences between microeconomics and macroeconomics, noting that microeconomics focuses on individual units while macroeconomics examines broad aggregates. The document also discusses the importance of macroeconomics for policymaking and theoretical debates. It introduces concepts like stocks and flows, real and nominal variables, and business cycles. Finally, it explains macroeconomic models and their uses in analyzing issues and predicting phenomena.
The document discusses key economic concepts related to scarcity, production, and systems. It addresses that human wants are unlimited but resources are scarce, so economies must answer basic questions about what, how, and for whom to produce. Production requires inputs of land, labor, and capital to transform into goods and services. The production possibility frontier model illustrates the tradeoffs between different goods that can be produced based on available resources. Economic systems differ in how they coordinate production and allocation of goods through mechanisms like markets, prices, and central planning.
This document provides an overview of the key concepts in managerial economics. It begins by outlining the topics that will be covered in the course, including microeconomic and macroeconomic foundations, concepts like scarcity and opportunity cost, production possibilities curves, profit maximization theories, and equilibrium. It then defines economics and distinguishes between microeconomics and macroeconomics. Several theories of the firm are introduced, including profit maximization, revenue maximization, growth maximization, and managerial utility maximization. The principles of opportunity cost, margins, and time value of money are also summarized.
This document provides an outline for a course on principles of economics. It covers key concepts like scarcity, opportunity cost, incentives, supply and demand. The course outline discusses microeconomic topics like consumer behavior, costs of production, and market structures. It also addresses macroeconomic goals, fiscal policy, and monetary policy. The document includes lecture notes on the basic economic problem of scarcity, definitions of economics, and the four principles of economic thinking - people face tradeoffs, opportunity cost, rational decision making at the margin, and response to incentives. It also provides examples and exercises to illustrate these concepts.
This document provides an introduction to financial econometrics. It defines econometrics as the application of statistical techniques to economic and financial problems. The key aspects of econometrics discussed include establishing mathematical models of economic theories, collecting and testing data, and using models for forecasting, prediction, and policy purposes. The document also distinguishes between econometrics and financial econometrics, noting that the latter focuses more on financial data and variables like stock and index prices and returns. It outlines some common financial data characteristics and approaches to modeling financial data.
This document provides an overview of microeconomics and key microeconomic concepts. It discusses:
1) The meaning and scope of economics, including the basic economic problems of what, how, and for whom to produce given scarce resources.
2) Microeconomics and its focus on individual decision-making units like consumers and firms.
3) Key microeconomic concepts like scarcity, opportunity cost, production possibility frontiers, the distinctions between cardinal and ordinal utility, and consumer equilibrium under utility maximization.
The circular flow diagram shows the interdependence between households and businesses in an economy. Money flows from businesses to households in exchange for labor, land, capital, and entrepreneurship in factor markets. Households then use this money to buy goods and services from businesses in product markets, completing the circular flow. This simple model illustrates how factor and product markets coordinate economic decisions between households as consumers and producers and businesses as consumers of factors and producers of goods.
Managerial economics involves applying economic theories and tools of analysis to business decision-making. It helps managers make optimal choices around issues like production, pricing, investment, and sales. The key economic concepts used include demand and cost analysis, production and pricing theories, and capital budgeting. Managerial economics draws from both microeconomics, analyzing internal business issues, and macroeconomics, examining the external economic environment. It provides a framework and analytical methods for managers to systematically evaluate alternatives and select decisions that best achieve organizational objectives under resource constraints.
Microeconomics i: Basic concepts in EconomicsUpananda Witta
This document provides an overview of key economic concepts covered in introductory economics including:
- Definitions of economic and non-economic goods and the production process. The four factors of production: land, labor, capital, and entrepreneurship.
- The concept of scarcity and how it leads to trade-offs requiring rational choice between alternative uses of limited resources. Opportunity cost is explored through examples.
- Demand analysis including the difference between demand and effective demand. The law of demand and factors that influence demand like price, income, tastes.
- Supply analysis including the law of supply and factors that influence supply like price, costs of production, and technology.
- Equilibrium concepts where
Macroeconomics studies the overall economy and aggregates like total output, income, employment and prices. It examines how the whole economy behaves, including why economic activity rises and falls. Macroeconomists analyze indicators like GDP, unemployment, inflation, interest rates, stock markets and exchange rates. GDP measures the total value of final goods and services produced domestically in a year. Other key concepts include consumption, investment, and the relationship between gross domestic product, gross national product, net domestic product and national income.
1. INTRODUCTION TO ME_5_6_920230724131405.pptAvhi10
Managerial economics uses economic theory and tools of analysis to address managerial problems. It helps managers make informed decisions by examining opportunity costs, production possibilities, demand and cost analysis. The scope of managerial economics is broad, covering areas like demand forecasting, production analysis, cost analysis, pricing, and resource allocation. By applying economic concepts, it aims to provide optimal solutions to managerial decision-making.
This document provides an overview of key economic concepts related to markets and the circular flow model. It defines terms like capital goods, market, mechanism, interact, interdependent, facilitate, and illustrate. It describes how households, businesses, and government are interrelated through voluntary exchange in product and factor markets. Money facilitates this exchange. The document includes sample circular flow diagrams and questions to test understanding of these concepts.
The document defines key terms from microeconomics and macroeconomics. It includes definitions for microeconomy, depression, economy, macroeconomy, balance point, efficiency, effectiveness, market, market failure, income, fixed costs, variable costs, price, offer, demand, economic models, invisible hand, recession, expansion, growth, competition, and ceteris paribus. The glossary provides concise explanations of these important economic concepts.
This document provides an overview of key concepts in agricultural production economics. It discusses how agricultural economists assume that farm managers aim to maximize profits by making choices about what to produce and how to allocate limited resources among alternative outputs. The document also summarizes microeconomics and macroeconomics, static versus dynamic economic models, and assumptions of pure and perfect competition in agricultural markets.
Basic Concepts of Managerial Economics Class 1.pptDrSaiKumar2
This document provides an overview of concepts in managerial economics. It discusses key contributors to the field such as Kautilya, Adam Smith, Alfred Marshall, and Lionel Robbins. It defines microeconomics and macroeconomics, and explains that managerial economics is a sub-branch of microeconomics focused on business decision-making. The document also outlines the scope and nature of managerial economics, and defines important concepts like opportunity cost and break-even analysis that are useful tools for managers.
Some Basic Definitions of microeconomicsLeighTajon
This document defines key concepts in microeconomics and differentiates it from macroeconomics. It explains that microeconomics examines small economic units like individuals, households and firms, and deals with how they make choices. Macroeconomics looks at aggregates like overall output and unemployment. It also outlines the three basic economic problems of what to produce, how to produce and who gets what is produced. Opportunity cost and positive and normative economic analysis are defined.
This document provides an overview of engineering economics concepts. It defines engineering economics as dealing with methods to minimize costs and maximize benefits for business organizations. The scope of issues covered includes elementary economic analysis, interest formulas, comparing investment alternatives, and more. It also discusses concepts like the cost elements of materials, labor, and overhead. Other sections define interest, explain the time value of money, and discuss bases for comparing investment alternatives like the present worth, future worth, and rate of return methods.
The document defines key economic concepts such as scarcity, opportunity cost, production possibility curve, and types of economies. It then discusses consumer theory including utility and diminishing marginal utility. Specifically:
1) Economics studies how individuals and societies make choices given scarce resources and unlimited wants. Opportunity cost is the next best choice given up when making a decision.
2) A production possibility curve illustrates the tradeoffs between two goods based on available resources. Shifting the curve shows how changes like technology affect what can be produced.
3) Economies differ in how decisions are made - socialist, capitalist, and mixed economies allocate resources in different ways. Consumer theory analyzes how utility and marginal utility influence consumption choices.
This document provides an overview of key economic concepts. It discusses:
- How economics trains analytical and objective thinking using models and assumptions
- Common economic models like the circular flow diagram and production possibilities frontier
- Microeconomics focuses on individual decision-making in markets while macroeconomics examines the whole economy
- Positive analysis descriptively explains the world, while normative analysis prescribes how it should be
- Economists generally agree on methodology but can disagree on assumptions about human behavior
This document defines key macroeconomic terms and concepts. It explains that macroeconomists study indicators like GDP and unemployment rates to understand how the whole economy works. They develop models showing the relationship between factors such as income, output, consumption, unemployment, inflation, savings, investment, and international trade. In contrast, microeconomists focus on individual agents like firms and consumers. Macroeconomic models are used by governments and large corporations to inform economic policy and business strategy. The document also defines concepts like national output, unemployment, inflation, supply and demand curves, and market equilibrium.
The document discusses the marketing mix, specifically the "Product" aspect. It defines a product as anything offered for sale and discusses different types of products. Key points made include:
- There are various ways to classify products including by tangibility, consumer goods vs industrial goods, and different levels of a product.
- The product mix refers to all product lines and items a seller offers. A product line contains closely related products.
- Branding, packaging, labeling, and new product development are also covered. The stages of a product's life cycle and strategic considerations like cannibalization and deletion are summarized.
National income measures the total value of goods and services produced in an economy over a period of time. It is important for economists to measure national income to assess economic growth, changes in living standards, and income inequality. National income can be measured using the expenditure approach, income approach, and value-added approach. The expenditure approach defines GDP as the total final expenditures by consumers, investors, the government, and net exports. The income approach defines GDP as the sum of all incomes received by producing factors. The value-added approach defines GDP as the sum of the value added from all sectors of the economy.
Consumer equilibrium refers to a situation where a consumer spends their income on purchasing goods in a way that maximizes their satisfaction. It occurs at the point where the marginal utility per rupee spent equals the price, so the marginal rate of substitution between goods equals the price ratio. This happens where the budget line that shows all affordable combinations of goods is tangent to the highest possible indifference curve on the indifference map, meaning the consumer cannot increase their satisfaction further without spending more money.
Microeconomics_11_Public Goods and Externalities.pptxGelMiAmor
Public goods and externalities can cause markets to fail to allocate resources efficiently. Goods with positive externalities are underprovided by markets, while goods with negative externalities like pollution are overproduced. Government intervention may be needed to address these market failures. Some options include command-and-control regulation, pollution taxes, and marketable permits. These policies aim to incentivize behaviors that account for social costs and benefits rather than just private costs and benefits.
The labor market consists of different markets for different types of labor based on work, skill level, and location. The demand for labor depends on the marginal product of labor (MPL), which is the additional output from adding one more worker. In perfectly competitive output markets, demand for labor is MPL x price. In imperfectly competitive markets, it is MPL x marginal revenue. The market wage is determined by the intersection of the labor supply and demand curves. Labor unions can act as monopolies in labor markets and negotiate higher wages for members. However, this can reduce employment levels. Discrimination and immigration can also impact wages and employment opportunities in labor markets.
Microeconomics_14_Globalization and Trade.pptxGelMiAmor
Globalization allows countries to specialize and trade based on comparative advantage. While barriers like tariffs aim to protect domestic industries, free trade overall benefits economies through gains from specialization and scale. Some costs of globalization include job losses, but most economists argue the gains outweigh the costs when balanced with appropriate domestic policies. Over the long term, organizations like GATT and WTO have significantly reduced trade barriers worldwide through negotiation rounds between member nations.
- The document discusses chicken production including the types of chickens, their management, egg production and recording.
- It describes the four main types of chickens - egg type, meat type, general purpose type and fancy type. Proper management including feeding, housing and record keeping is important for optimal production.
- Key performance metrics like monthly average egg production per hen, hen-day average and hen-housed average are calculated using data on number of hens, eggs produced and mortality over time.
The document discusses calculations related to animal science including swine, cattle, and poultry production and management as well as feed formulations. It provides examples of calculations for expected farrowing, weaning, and marketing dates for swine. For cattle, it shows calculations for conception rate, calf crop, and weaning weight. For poultry, it demonstrates calculations for average hen numbers, egg production, and mortality. Finally, it presents the Pearson square method for formulating a 15% crude protein feed using available ingredients of different protein levels.
Recombinant DNA technology involves transferring genetic material from one organism to another. It has several basic techniques: manipulating DNA in vitro, transferring the constructed DNA into a host cell where it can be cloned and replicated, and identifying and selecting transformed host cells that have taken up the construct. The document discusses producing transgenic crops through recombinant DNA technology.
Independent Study - College of Wooster Research (2023-2024) FDI, Culture, Glo...AntoniaOwensDetwiler
"Does Foreign Direct Investment Negatively Affect Preservation of Culture in the Global South? Case Studies in Thailand and Cambodia."
Do elements of globalization, such as Foreign Direct Investment (FDI), negatively affect the ability of countries in the Global South to preserve their culture? This research aims to answer this question by employing a cross-sectional comparative case study analysis utilizing methods of difference. Thailand and Cambodia are compared as they are in the same region and have a similar culture. The metric of difference between Thailand and Cambodia is their ability to preserve their culture. This ability is operationalized by their respective attitudes towards FDI; Thailand imposes stringent regulations and limitations on FDI while Cambodia does not hesitate to accept most FDI and imposes fewer limitations. The evidence from this study suggests that FDI from globally influential countries with high gross domestic products (GDPs) (e.g. China, U.S.) challenges the ability of countries with lower GDPs (e.g. Cambodia) to protect their culture. Furthermore, the ability, or lack thereof, of the receiving countries to protect their culture is amplified by the existence and implementation of restrictive FDI policies imposed by their governments.
My study abroad in Bali, Indonesia, inspired this research topic as I noticed how globalization is changing the culture of its people. I learned their language and way of life which helped me understand the beauty and importance of cultural preservation. I believe we could all benefit from learning new perspectives as they could help us ideate solutions to contemporary issues and empathize with others.
2. Elemental Economics - Mineral demand.pdfNeal Brewster
After this second you should be able to: Explain the main determinants of demand for any mineral product, and their relative importance; recognise and explain how demand for any product is likely to change with economic activity; recognise and explain the roles of technology and relative prices in influencing demand; be able to explain the differences between the rates of growth of demand for different products.
Vicinity Jobs’ data includes more than three million 2023 OJPs and thousands of skills. Most skills appear in less than 0.02% of job postings, so most postings rely on a small subset of commonly used terms, like teamwork.
Laura Adkins-Hackett, Economist, LMIC, and Sukriti Trehan, Data Scientist, LMIC, presented their research exploring trends in the skills listed in OJPs to develop a deeper understanding of in-demand skills. This research project uses pointwise mutual information and other methods to extract more information about common skills from the relationships between skills, occupations and regions.
BONKMILLON Unleashes Its Bonkers Potential on Solana.pdfcoingabbar
Introducing BONKMILLON - The Most Bonkers Meme Coin Yet
Let's be real for a second – the world of meme coins can feel like a bit of a circus at times. Every other day, there's a new token promising to take you "to the moon" or offering some groundbreaking utility that'll change the game forever. But how many of them actually deliver on that hype?
1. Elemental Economics - Introduction to mining.pdfNeal Brewster
After this first you should: Understand the nature of mining; have an awareness of the industry’s boundaries, corporate structure and size; appreciation the complex motivations and objectives of the industries’ various participants; know how mineral reserves are defined and estimated, and how they evolve over time.
Falcon stands out as a top-tier P2P Invoice Discounting platform in India, bridging esteemed blue-chip companies and eager investors. Our goal is to transform the investment landscape in India by establishing a comprehensive destination for borrowers and investors with diverse profiles and needs, all while minimizing risk. What sets Falcon apart is the elimination of intermediaries such as commercial banks and depository institutions, allowing investors to enjoy higher yields.
Economic Risk Factor Update: June 2024 [SlideShare]Commonwealth
May’s reports showed signs of continued economic growth, said Sam Millette, director, fixed income, in his latest Economic Risk Factor Update.
For more market updates, subscribe to The Independent Market Observer at https://blog.commonwealth.com/independent-market-observer.
Understanding how timely GST payments influence a lender's decision to approve loans, this topic explores the correlation between GST compliance and creditworthiness. It highlights how consistent GST payments can enhance a business's financial credibility, potentially leading to higher chances of loan approval.
Abhay Bhutada, the Managing Director of Poonawalla Fincorp Limited, is an accomplished leader with over 15 years of experience in commercial and retail lending. A Qualified Chartered Accountant, he has been pivotal in leveraging technology to enhance financial services. Starting his career at Bank of India, he later founded TAB Capital Limited and co-founded Poonawalla Finance Private Limited, emphasizing digital lending. Under his leadership, Poonawalla Fincorp achieved a 'AAA' credit rating, integrating acquisitions and emphasizing corporate governance. Actively involved in industry forums and CSR initiatives, Abhay has been recognized with awards like "Young Entrepreneur of India 2017" and "40 under 40 Most Influential Leader for 2020-21." Personally, he values mindfulness, enjoys gardening, yoga, and sees every day as an opportunity for growth and improvement.
5 Tips for Creating Standard Financial ReportsEasyReports
Well-crafted financial reports serve as vital tools for decision-making and transparency within an organization. By following the undermentioned tips, you can create standardized financial reports that effectively communicate your company's financial health and performance to stakeholders.
2. Understanding Economics and Scarcity
• Scarcity means that there are never enough resources to satisfy all human wants.
• Every society, at every level, must make choices about how to use its resources.
• Economics is the study of the trade-offs and choices that we make, given the fact of
scarcity.
• Opportunity cost is what we give up when we choose one thing over another.
3. Goods and Resources
• Economic Goods: goods or services a consumer must pay to obtain; also called
scarce goods.
• Free Goods: goods or services that a consumer can obtain for free because they
are abundant relative to the demand.
• Productive Resources: the inputs used in the production of goods and services to
make a profit: land, economic capital, labor, and entrepreneurship; also called
“factors of production”
4. Productive Resources
Four productive resources also
called factors of production:
• Land: any natural resource,
including actual land, but also trees,
plants, livestock, wind, sun, water,
etc.
• Economic capital: anything that’s
manufactured in order to be used in
the production of goods and
services. Note the distinction
between financial capital (which is
not productive) and economic
capital (which is). While money isn’t
directly productive, the tools and
machinery that it buys can be.
• Labor: any human service—
physical or intellectual. Also
referred to as human capital.
• Entrepreneurship: the ability of
someone (an entrepreneur)
to recognize a profit opportunity,
organize the other factors of
production, and accept risk.
5. Concept of Opportunity Cost
Opportunity Cost: the value of the next best alternative.
• Individual Decisions: In some cases, recognizing the opportunity cost can alter personal
behavior.
• Societal Decisions: Opportunity cost comes into play with societal decisions. Universal health
care would be nice, but the opportunity cost of such a decision would be less housing,
environmental protection, or national defense. These trade-offs also arise with government
policies.
6. Labor, Markets, and Trade
The Division and Specialization of
Labor
• division of labor: the way in which the
work required to produce a good or service
is divided into tasks performed by different
workers.
• specialization: when workers or firms
focus on particular tasks for which they are
well suited within the overall production
process.
Why the Division of Labor Increases
Production
• economies of scale: when the average
cost of producing each individual unit
declines as total output increases.
7. Labor, Markets, and Trade (cont.)
Trade and Markets
• Specialization only makes sense if workers
(and other economic agents such as
businesses and nations) can use their income
to purchase the other goods and services they
need.
• Specialization requires trade.
• The market allows you to learn a specialized
set of skills and then use the pay you receive
to buy the goods and services you need or
want.
• This is how our modern society has evolved
into a strong economy.
8. Microeconomics and Macroeconomics
Micro vs. Macro
• Macroeconomics: the branch of economics that focuses on broad issues such as
growth, unemployment, inflation, and trade balance.
• Microeconomics: the branch of economics that focuses on actions of particular
agents within the economy, like households, workers, and businesses. We learn
about the theory of consumer behavior and the theory of the firm.
9. Understanding Microeconomics
• What determines how households and
individuals spend their budgets?
• What combination of goods and
services will best fit their needs and
wants, given the budget they have to
spend?
• How do people decide
whether to work, and if so,
whether to work full time or
part time?
• How do people decide how
much to save for the future, or
whether they should borrow to
spend beyond their current
means?
Questions to Ask with Microeconomics
10. Understanding Microeconomics (cont.)
• What determines the products,
and how many of each, a firm will
produce and sell?
• What determines what prices a
firm will charge?
• What determines how a firm will
produce its products?
• What determines how many
workers it will hire?
• How will a firm finance its
business?
• When will a firm decide to
expand, downsize, or even
close?
More Microeconomics Questions
11. Understanding Macroeconomics
Macroeconomics: Macroeconomic policy pursues its goals through monetary
policy and fiscal policy.
• Monetary Policy: policy that involves altering the level of interest rates, the
availability of credit in the economy, and the extent of borrowing
• Fiscal Policy: economic policies that involve government spending and
12. Using Economic Models
Economic Model: a simplified version of reality that allows us to observe, understand,
and make predictions about economic behavior.
Economic Models and Math
• Economic models can be represented using words or using mathematics.
• Algebra and graphs are utilized to explain economic models.
13. Using Economic Models: Examples
Circular Flow Diagram: a diagram indicating that
the economy consists of households and firms
interacting in a goods-and-services market and a
labor market.
• goods-and-services market (also called
the product market), in which firms sell and
households buy.
• labor market, in which households sell labor to
business firms or other employees.
• real world, there are many different markets for
goods and services and markets for many
different types of labor. The circular flow
diagram simplifies these distinctions in order to
make the picture easier to grasp.
Note: Economists don’t figure out the solution to a problem
and then draw the graph. Instead, they use the graph to help
them discover the answer.
14. Purpose of Functions
• Function: a relationship or expression involving one or more variables.
• In economics, functions frequently describe cause and effect.
• The variable on the left-hand side is what is being explained (“the effect”).
• On the right-hand side is what’s doing the explaining (“the causes”).
• Economic models tend to express relationships using economic variables, such as:
• Budget = money spent on econ books + money spent on music
15. Solving Simple Equations
Order of Operations
• When you solve an equation it’s
important to do each operation in the
following order:
• Simplify inside parentheses and brackets.
• Simplify the exponent.
• Multiply and divide from left to right.
• Add and subtract from left to right.
Lines
• In this course the most common equation
you will see is for a line in graphs: y =
b+mx
Understanding Variables
• Variable: a quantity that can assume a range
of values represented by a letter or a symbol.
• For example: y=9+3x
Working with Variables
• When you’re trying to solve an equation with
one or more variables, you need to isolate the
variable.
• What does x equal if y=12?
16. Creating and Interpreting Graphs
• intercept: the point on a graph where a line crosses
the vertical axis or horizontal axis.
• slope: the change in the vertical axis divided by the
change in the horizontal axis.
• variable: a quantity that can assume a range of
values.
• x-axis: the horizontal line on a graph, commonly
represents quantity (q) on graphs in economics.
• y-axis: the vertical line on a graph, commonly
represents price (p) on graphs in economics.
17. Creating and Interpreting Graphs (cont.)
Equation for a Line: y = mx + b
• In any equation for a line, m is the slope and b is the y-intercept.
Interpreting Graphs in Economics
• It is rare for real-world data points to arrange themselves as a perfectly straight line.
• It often turns out that a straight line can offer a reasonable approximation of actual
data.
18. Interpreting Slope
What the Slope Means: the change in the
vertical axis divided by the change in the
horizontal axis.
• positive slope indicates that two variables are
positively related; when one variable
increases, so does the other, and when one
variable decreases, the other also decreases.
19. Interpreting Slope: Negative Slope
What the Slope Means: the change in the
vertical axis divided by the change in the
horizontal axis.
• negative slope indicates that two
variables are negatively related; when
one variable increases, the other
decreases, and when one variable
decreases, the other increases.
20. Interpreting Slope: Slope of Zero
What the Slope Means: the change in
the vertical axis divided by the change in
the horizontal axis.
• Slope of zero indicates that there is a
constant relationship between two
variables: when one variable
changes, the other does not change.
21. Interpreting Slope: Calculating Slope
Calculating Slope
• The slope of a straight line between two points can
be calculated in numerical terms.
• To calculate slope, begin by designating one point
as the “starting point” and the other point as the
“end point” and then calculating the rise over run
between these two points.
22. Interpreting Slope: Calculating Slope (cont.)
Calculating Slope
• Graphs of economic relationships are not always straight lines but often nonlinear
(curved) lines.
• Can interpret nonlinear relationships similarly to the way we interpret linear relationships.
• Their slopes can be positive or negative. We can calculate the slopes similarly also, looking at
the rise over the run of a segment of a curve.
23. Interpreting Slope: Nonlinear Relationships
Nonlinear relationships can be interpreted
similar to linear relationships.
• Their slopes can be positive (as in Figure 5)
or negative.
• We can calculate the slopes similarly also,
looking at the rise over the run of a segment
of a curve.
• A higher positive slope means a steeper
upward tilt to the curve, which you can see at
higher output levels.
• A negative slope that is larger in absolute
value (that is, more negative) means a
steeper downward tilt to the line.
24. Interpreting Slope: Nonlinear Relationships (cont.)
Nonlinear relationships can be interpreted similar to
linear relationships.
• A slope of zero is a horizontal line.
• A vertical line has an infinite slope.
• If a line has a larger intercept, graphically, it would
shift out (or up) from the old origin, parallel to the old
line.
• If a line has a smaller intercept, it would shift in (or
down), parallel to the old line.
25. Types of Graphs: Line
Line Graphs: show a relationship
between two variables: one measured
on the horizontal axis and the other
measured on the vertical axis.
• Sometimes it’s useful to show more
than one set of data on the same
axes.
• The data in the table, below, is
displayed in Figure 1, which shows
the relationship between two
variables: length and median weight
for American baby boys and girls
during the first three years of life.
26. Types of Graphs: Line (cont.)
Line Graphs:
• The line graph measures length in inches on
the horizontal axis and weight in pounds on the
vertical axis. For example, point A on the figure
shows that a boy who is 28 inches long will
have a median weight of about 19 pounds.
• One line on the graph shows the length-weight
relationship for boys, and the other line shows
the relationship for girls.
• This kind of graph is widely used by health-
care providers to check whether a child’s
physical development is roughly on track.
27. Types of Graphs: Pie
Pie Graphs: (sometimes called a pie chart) is used
to show how an overall total is divided into parts. A
circle represents a group as a whole. The slices of
this circular “pie” show the relative sizes of
subgroups.
• These pie graphs show how the U.S. population
was divided among children, working-age adults,
and the elderly in 1970, 2000, and what is
projected for 2030.
• In a pie graph, each slice of the pie represents a
share of the total, or a percentage. For example,
50% would be half of the pie and 20% would be
one-fifth of the pie.
28. Types of Graphs: Pie (cont.)
Pie Graphs:
• The three pie graphs show that the share
of the U.S. population 65 and over is
growing.
• The pie graphs allow you to get a feel for
the relative size of the different age groups
from 1970 to 2000 to 2030, without
requiring you to slog through the specific
numbers and percentages in the table.
• Some common examples of how pie
graphs are used include dividing the
population into groups by age, income
level, ethnicity, religion, occupation;
dividing different firms into categories by
size, industry, number of employees; and
dividing up government spending or taxes
into its main categories.
29. Types of Graphs: Bar
Bar Graphs: uses the height of different bars
to compare quantities.
• Bar graphs can be subdivided in a way
that reveals information similar to that we
can get from pie charts.
• It is sometimes easier for a reader to run
his or her eyes across several bar graphs,
comparing the shaded areas, rather than
trying to compare several pie graphs.
30. Types of Graphs: Bar (cont.)
Bar Graphs: uses the height of different bars to
compare quantities.
• The three bar graphs are based on the
information from the chart about the U.S. age
distribution in 1970, 2000, and 2030.
• Graph (a) shows three bars for each year,
representing the total number of persons in
each age bracket for each year.
• Graph (b) shows just one bar for each year,
but the different age groups are now shaded
inside the bar.
• Graph(c), still based on the same data, the
vertical axis measures percentages rather than
the number of persons.
31. Types of Graphs: Comparison
• Bar graphs are especially useful when
comparing quantities.
• For example, if you are studying the
populations of different countries, bar
graphs can show the relationships
between the population sizes of multiple
countries.
• Not only can it show these relationships,
but it can also show breakdowns of
different groups within the population
• Pie graphs are often better than line
graphs at showing how an overall
group is divided.
• However, if a pie graph has too
many slices, it can become
difficult to interpret.
How do you know which graph to use for your data?
32. Types of Graphs: Comparison (cont.)
• Line graphs are often the most effective
format for illustrating a relationship between
two variables that are both changing.
• For example, time-series graphs can
show patterns as time changes, like the
unemployment rate over time.
• Line graphs are widely used in economics
to present continuous data about prices,
wages, quantities bought and sold, the
size of the economy.
How do you know which graph to use for your data?
33. Quick Review
• What if scarcity? Explain its economic
impact.
• What are productive resources?
• What is opportunity cost and its
importance in decision-making?
• Why do trade and markets exist?
• What is the difference between
macroeconomics and
microeconomics?
• Why are economic models are useful to
economists?
• What are common economic models?
• How are equations and functions used
to describe relationships? What are the
cause and effects?
• What proper order of operations is used
while solving simple equations with
variables?
• How does a graph shows the
relationship between two variables?
• How do you differentiate between a
positive relationship and a negative
relationship?
• How do you interpret economic
information on a graph?
Editor's Notes
Cover Image: "Leather Wallets." Authored by: Julius Drost. Provided by: Unsplash. Located at: https://unsplash.com/photos/GTmLKWZzZuo. Content Type: CC Licensed Content, Shared Previously. License: CC0: No Rights Reserved.
Unless otherwise noted, images and supporting content is authored by: OpenStax College. Located at: https://cnx.org/contents/vEmOH-_p@4.48:3ZlSW1C7@3/Introduction
License: License: CC BY: Attribution. License Terms: Download for free at http://cnx.org/contents/bc498e1f-efe9-43a0-8dea-d3569ad09a82@4.48.
PowerPoint original content is authored by: Lumen Learning. License: CC BY: Attribution
Kansas Summer Wheat and Storm Panorama. Authored by: James Watkins. Located at: https://www.flickr.com/photos/23737778@N00/7115229223/. License: CC BY: Attribution
How Economists Use Theories and Models to Understand Economic Issues. Authored by: OpenStax College. Provided by: Rice University. Located at: https://cnx.org/contents/vEmOH-_p@4.44:btmXIC6v@6/How-Economists-Use-Theories-an. License: CC BY: Attribution. License Terms: Download for free at http://cnx.org/content/col11627/latest