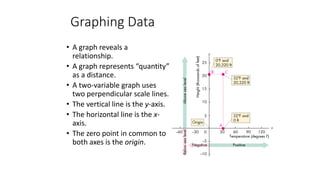
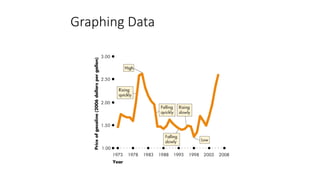
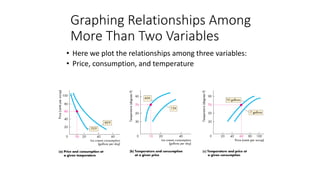
This document provides an overview of graphing data in economics. It discusses three main types of graphs used - time-series graphs, cross-section graphs, and scatter diagrams. Time-series graphs show a variable over time, cross-section graphs compare variables across groups, and scatter diagrams show the relationship between two variables. The document also discusses key graph elements like axes, trends, slopes, and using graphs to understand relationships between multiple variables.
1. Graphing Data
• A graph reveals a
relationship.
• A graph represents “quantity”
as a distance.
• A two-variable graph uses
two perpendicular scale lines.
• The vertical line is the y-axis.
• The horizontal line is the x-
axis.
• The zero point in common to
both axes is the origin.
2. • Economists use three types of graph to reveal relationships
between variables. They are
Time-series graphs
Cross-section graphs
Scatter diagrams
Graphing Data
3. • Time-Series Graphs
• A time-series graph measures time (for example, months
or years) along the x-axis and the variable or variables in
which we are interested along the y-axis.
• The time-series graph on the next slide shows the price of
gasoline between 1973 and 2006.
• The graph shows the level of the price, how it has changed
over time, when change was rapid or slow, and whether
there was any trend.
Graphing Data
5. •
Cross-Section Graphs
• A cross-section graph shows the values of a variable for
different groups in a population at a point in time.
• The cross-section graph on the next slide enables you to
compare the number of people who participate in 10
popular leisure activities in the United States.
Graphing Data
7. • Scatter Diagrams
• A scatter diagram plots the value of one variable on the x-
axis and the value of another variable on the y-axis.
• A scatter diagram can make clear the relationship between
two variables.
• The three scatter diagrams on the next slide show
examples of variables that move in the same direction, in
opposite directions, and in no particular relationship to
each other.
Graphing Data
9. Graphs Used in Economic Models
• Graphs are used in economic models to show the
relationship between variables.
• The patterns to look for in graphs are the four cases in
which
Variables move in the same direction.
Variables move in opposite directions.
Variables have a maximum or a minimum.
Variables are unrelated.
10. • Variables That Move in the Same Direction
• A relationship between two variables that move in the
same direction is called a positive relationship or a direct
relationship.
• A line that slopes upward shows a positive relationship.
• A relationship shown by a straight line is called a linear
relationship.
• The three graphs on the next slide show positive
relationships.
Graphs Used in Economic Models
12. • Variables That Move in Opposite Directions
• A relationship between two variables that move in
opposite directions is called a negative relationship or an
inverse relationship.
• A line that slopes downward shows a negative relationship.
• The three graphs on the next slide show negative
relationships.
Graphs Used in Economic Models
14. • Variables That Have a Maximum or a Minimum
• The two graphs on the next slide show relationships that
have a maximum and a minimum.
• These relationships are positive over part of their range
and negative over the other part.
Graphs Used in Economic Models
16. • Variables That are Unrelated
• Sometimes, we want to emphasize that two variables are
unrelated.
• The two graphs on the next slide show examples of
variables that are unrelated.
Graphs Used in Economic Models
18. The Slope of a Relationship
• The slope of a relationship is the change in the value of the
variable measured on the y-axis divided by the change in
the value of the variable measured on the x-axis.
• We use the Greek letter (capital delta) to represent
“change in.”
• So y means the change in the value of the variable
measured on the y-axis and x means the change in the
value of the variable measured on the x-axis.
• The slope of the relationship is y/x.
19. • The Slope of a Straight
Line
• The slope of a straight
line is constant.
• Graphically, the slope is
calculated as the “rise”
over the “run.”
• The slope is positive if
the line is upward
sloping.
The Slope of a Relationship
20. • The slope is negative if
the line is downward
sloping.
The Slope of a Relationship
21. • The Slope of a Curved Line
• The slope of a curved line at a point varies depending on
where along the curve it is calculated.
• We can calculate the slope of a curved line either at a point
or across an arc.
The Slope of a Relationship
22. • Slope at a Point
• The slope of a curved
line at a point is equal to
the slope of a straight
line that is the tangent
to that point.
• Here, we calculate the
slope of the curve at
point A.
The Slope of a Relationship
23. • Slope Across an Arc
• The average slope of a
curved line across an arc
is equal to the slope of a
straight line that joins
the endpoints of the arc.
• Here, we calculate the
average slope of the
curve along the arc BC.
The Slope of a Relationship
24. Graphing Relationships Among
More Than Two Variables
• When a relationship involves more than two variables, we
can plot the relationship between two of the variables by
holding other variables constant—by using ceteris paribus.
• Ceteris paribus means “if all other relevant things remain
the same.”
25. Graphing Relationships Among
More Than Two Variables
• Here we plot the relationships among three variables:
• Price, consumption, and temperature
26.
27. Definition of Economics
• All economic questions arise because we want more than
we can get.
• Our inability to satisfy all our wants is called scarcity.
• Because we face scarcity, we must make choices.
• The choices we make depend on the incentives we face.
• An incentive is a reward that encourages an action or a
penalty that discourages an action.
28. • Economics is the social science that studies the choices that
individuals, businesses, governments, and entire societies make
as they cope with scarcity and the incentives that influence and
reconcile those choices.
• Economics divides in to main parts:
Microeconomics
Macroeconomics
Definition of Economics
29. • Microeconomics
• Microeconomics is the study of choices that individuals
and businesses make, the way those choices interact in
markets, and the influence of governments.
• Macroeconomics
• Macroeconomics is the study of the performance of the
national and global economies.
Definition of Economics
30. Two Big Economic Questions
• Two big questions summarize the scope of economics:
How do choices end up determining what, how, and for
whom goods and services get produced?
When do choices made in the pursuit of self-interest also
promote the social interest?
31. • What, How, and For Whom?
• Goods and services are the objects that people value and
produce to satisfy human wants.
• What?
• Agriculture accounts for less than 1 percent of total U.S.
production, manufactured goods for 20 percent, and
services for 80 percent.
• In China, agriculture accounts for 10 percent of total
production, manufactured goods for 50 percent, and
services for 40 percent.
Two Big Economic Questions
32. • How?
• Goods and services are produced by using productive
resources that economists call factors of production.
• Factors of production are grouped into four categories:
Land
Labor
Capital
Entrepreneurship
Two Big Economic Questions
33. • The “gifts of nature” that we use to produce goods and
services are land.
• The work time and work effort that people devote to
producing goods and services is labor.
• The quality of labor depends on human capital, which is
the knowledge and skill that people obtain from education,
on-the-job training, and work experience.
• The tools, instruments, machines, buildings, and other
constructions that businesses use to produce goods and
services are capital.
• The human resource that organizes land, labor, and capital
is entrepreneurship.
Two Big Economic Questions
34. • For Whom?
• Who gets the goods and services depends on the incomes
that people earn.
Land earns rent.
Labor earns wages.
Capital earns interest.
Entrepreneurship earns profit.
Two Big Economic Questions
35. • When is the Pursuit of Self-Interest in the Social
Interest?
• Every day, 304 million Americans and 6.7 billion people in
other countries make economic choices that result in
What, How, and For Whom goods and services are
produced.
• Do we produce the right things in the right quantities?
• Do we use our factors of production in the best way?
• Do the goods and services go to those who benefit most
from them?
Two Big Economic Questions
36. • You make choices that are in your self-interest—choices
that you think are best for you.
• Choices that are best for society as a whole are said to be
in the social interest.
• An outcome is in the social interest if it uses resources
efficiently and distributes goods and services fairly.
• The Big Question
• Is it possible that when each one of us makes choices that
are in our self-interest, it also turns out that these choices
are also in the social interest?
Two Big Economic Questions
37. • Self-Interest in the Social Interest
• Five topics that generate discussion and that illustrate tension
between self-interest and social interest are
Globalization
The information-age economy
Global warming
Natural resource depletion
Economic instability
Two Big Economic Questions
38. The Economic Way of Thinking
• Choices and Tradeoffs
• The economic way of thinking places scarcity and its
implication, choice, at center stage.
• You can think about every choice as a tradeoff—an
exchange—giving up one thing to get something else.
• The classic tradeoff is “guns versus butter.”
• “Guns” and “butter” stand for any two objects of value.
39. • What, How, and For Whom Tradeoffs
• The questions what, how, and for whom become sharper
when we think in terms of tradeoffs.
• What Tradeoffs arise when people choose how to spend
their incomes, when governments choose how to spend
their tax revenues, and when businesses choose what to
produce.
The Economic Way of Thinking
40. • How Tradeoffs arise when businesses choose among
alternative production technologies.
• For Whom Tradeoffs arise when choices change the
distribution of buying power across individuals.
• Government redistribution of income from the rich to the
poor creates the big tradeoff—the tradeoff between
equality and efficiency.
The Economic Way of Thinking
41. • Choices Bring Change
• What, how, and for whom goods and services get produced
changes over time and the quality of our economic lives
improve.
• But the quality of our economic lives and the rate at which
they improve depends on choices that involve tradeoffs.
• We face three tradeoffs between enjoying current
consumption and leisure time and increasing future
production, consumption, and leisure time.
The Economic Way of Thinking
42. • If we save more, we can buy more capital and increase our
production.
• If we take less leisure time, we can educate and train
ourselves to become more productive.
• If businesses produce less and devote resources to
research and developing new technologies, they can
produce more in the future.
• The choices we make in the face of these tradeoffs
determine the pace at which our economic condition
improves.
The Economic Way of Thinking
43. • Opportunity Cost
• Thinking about a choice as a tradeoff emphasizes cost as an
opportunity forgone.
• The highest-valued alternative that we give up to get
something is the opportunity cost of the activity chosen.
The Economic Way of Thinking
44. • Choosing at the Margin
• People make choices at the margin, which means that they
evaluate the consequences of making incremental changes
in the use of their resources.
• The benefit from pursuing an incremental increase in an
activity is its marginal benefit.
• The opportunity cost of pursuing an incremental increase
in an activity is its marginal cost.
The Economic Way of Thinking
45. • Responding to Incentives
• Our choices respond to incentives.
• For any activity, if marginal benefit exceeds marginal cost,
people have an incentive to do more of that activity.
• If marginal cost exceeds marginal benefit, people have an
incentive to do less of that activity.
• Incentives are also the key to reconciling self-interest and
the social interest.
The Economic Way of Thinking
46. • Human Nature, Incentives, and Institutions
• Economists take human nature as given and view people as
acting in their self-interest.
• Self-interested actions are not necessarily selfish actions.
• But if human nature is given and people pursue self-
interest, how can the social interest be served?
• Economists answer by emphasizing the role of institutions
in creating incentives to behave in the social interest.
• Paramount: the rule of law that protects private property
and facilitates voluntary exchange in markets.
The Economic Way of Thinking
47. Economics: A Social Science and
Policy Tool
• Economics as Social Science
• Economists distinguish between two types of statement:
What is—positive statements
What ought to be—normative statements
• A positive statement can be tested by checking it against
facts.
• A normative statement cannot be tested.
48. • Unscrambling Cause and Effect
• The task of economic science is to discover positive
statements that are consistent with what we observe in the
world and that enable us to understand how the economic
world works.
• Economists create and test economic models.
• An economic model is a description of some aspect of the
economic world that includes only those features that are
needed for the purpose at hand.
• Qd = f(p) 1.1
• Q= a+b(p) 1.2
• Q= 10 – 3p 1.3 (example)
Economics: A Social Science and
Policy Tool
49. • A model is tested by comparing its predictions with the
facts.
• But testing an economic model is difficult, so economists
also use
Natural experiments
Statistical investigations
Economic experiments
Economics: A Social Science and
Policy Tool
50. • Economics as Policy Tool
• Economics is a way of approaching problems in all aspects
of our lives. Three broad areas are
Personal economic policy
Business economic policy
Government economic policy
Economics: A Social Science and
Policy Tool