Download to read offline
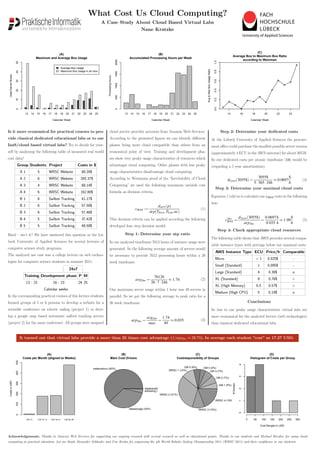

This document presents a case study comparing the costs of cloud-based virtual labs against traditional educational labs at the Lübeck University of Applied Sciences. It outlines a four-step decision model for determining economics and resource usage, highlighting that virtual labs provide a significant cost advantage for students involved in practical courses. The findings are supported by quantitative data on server usage and cost drivers, demonstrating that cloud computing is more economical for specific educational applications.


