All-domain Anomaly Resolution Office U.S. Department of Defense (U) Case: “Eg...
Presentation.pptx
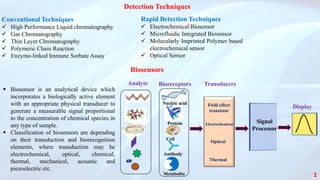
1. Detection Techniques
Conventional Techniques
High Performance Liquid chromatography
Gas Chromatography
Thin Layer Chromatography
Polymeric Chain Reaction
Enzyme-linked Immune Sorbate Assay
Rapid Detection Techniques
Electrochemical Biosensor
Microfluidic Integrated Biosensor
Molecularly Imprinted Polymer based
electrochemical sensor
Optical Sensor
1
Analyte Bioreceptors Transducers
Signal
Processor
Field effect
transistor
Electrochemical
Optical
Thermal
Nucleic acid
Protein
Cell
Antibody
Metabolite
Display
Biosensor is an analytical device which
incorporates a biologically active element
with an appropriate physical transducer to
generate a measurable signal proportional
to the concentration of chemical species in
any type of sample.
Classification of biosensors are depending
on their transduction and biorecognition
elements, where transduction may be
electrochemical, optical, chemical,
thermal, mechanical, acoustic and
piezoelectric etc.
Biosensors
2. Nanomaterial Aspects
Applications of Manganese oxide nanomaterials
Manganese oxide widely important in waste water treatment,
as a catalyst and different sensors and biosensors.
It is environment friendly and used in the fabrication of
lithium ion battery.
It is also used in nanocomposites, supercapacitors and
scavenger for the trace metals and ions.
Manganese oxide having semiconducting nanomaterial
property with the crystallite size of 5 – 100 nm.
It has larger surface to volume ratio, and paramagnetic
behaviour.
It exist in different structural form like MnO, MnO2, MnO3,
Mn2O3, Mn3O4, and Mn2O7 etc.
Manganese oxide nanomaterials
Graphene quantum dots
Graphene quantum dots are the type of carbon quantum
dots and fall in the category of zero-dimensional (0-D)
nanomaterials and having lateral dimension smaller than
10 nm.
It endow several properties such as less toxicity,
biocompatibility, photostability, semiconducting, electrical
conductivity, dispersibility and luminescence etc.
It exhibit excellent physical and chemical properties that
have explored remarkable area including sensor,
bioimaging, antibacterial, photothermal therapy and drug
delivery etc.
2
Nanomaterials are defined as synthesized materials with external or internal
dimension are between 1 – 100 nm size range and possesses unbound or
aggregated particles
They are represented as nanoparticles, nanorods, nanowires, nanobelt,
nanosheet, nanoflowers, nanoballs, nanotubes, and nanocones etc.
It is classified into four dimension such zero-dimension (0-D), one-dimension
(1-D), two-dimension (2-D), and three-dimension (3-D).
QDs are referred as semiconductor nanocrystals which are highly fluorescent
in nature and having particle size smaller than 10 nm.
QDs are zero dimensional nanostructured materials.
Bayda, S.; Adeel, M.; Tuccinardi, T.; Cordani, M.; Rizzolio, F. The History of Nanoscience and
Nanotechnology: From Chemical–Physical Applications to Nanomedicine. Molecules 2020, 25 (1), 112.
3. Research Objective
(A)Synthesis of Nanomaterials
Synthesis of Manganese oxide Nanomaterials
Synthesis of fluorescent quantum dots
(B) Characterization of nanomaterials using techniques:
X-ray Diffraction
Fourier Transform Infra-red Spectroscopy
Raman Spectroscopy
Scanning Electron Microscopy
Transmission Electron Microscopy
(C) Detection of mycotoxins using techniques such as:
Electrochemical biosensor
Electrochemical Sensor
Optical Sensor
3
4. Synthesis of Manganese oxide Nanomaterial
Mixture of Mn2+
and Na+
ions
+
Filtered
material
Dried
Obtained
NPs
Filtrate
Aqueous
solution
of NaOH
Mn CH3COO)2. 4H2O → Mn2+
+ 2CH3COO−
+ 4H2O
NaOH → Na+
+ OH−
Mn2+
+ 2OH−
→ Mn OH 2
Mn OH)2
Dried at room
Temperature
Mn3O4 +
1
2
O2
Ionization Of Precursor
Addition of Precursor
Calcination
Chemical reactions
Aqueous
solution of
Mn(CH3COO)2
Mn OH)2
650°C
Mn2O3 +
1
2
O2
Mn OH)2
350°C
MnO2 +
1
2
O2
Synthesis of Graphene Quantum Dots
Curry Patta
Fresh leaves
3 gm of ash + 20 ml
of D.I water
Heating in
Muffle
Synthesized Graphene
quantum dots
4
Synthesis of Molecularly Imprinted Polymer
+ APS +
Polymerization
Template
removal
MIP
Analyte
Synthesis of Nanomaterials used in the Thesis work
5. Characterization Study
Fig. a) XRD patterns b) Raman spectra of MnO2 (350°C) and Mn2O3 (650°C).
Fig. (a), (b) FE-SEM images of MnO2 (350°C) and (c), (d)
FE-SEM images of Mn2O3 (650°C).
5
Fig. FTIR spectra of (a) MnO2 (350°C) and (b) Mn2O3 (650°C).
Temperature Dependent Structural Transition in Manganese oxide and its Electrochemical Study
6. Fig. TGA plot of samples at (a) 350 °C and (c) 650 °C; and
derivative plot in (b) and (d) respectively.
Thermogravimetric Analysis
6
Fig. (a) Cyclic voltammetry curve of MnO2 (350°C)/ITO at different scan rates (b)
DPV plot of MnO2 (350°C)/ITO (C) EIS plot of MnO2 (350°C)/ITO (d) Cyclic
voltammetry curve of Mn2O3 (650°C)/ITO at different scan rate (e) DPV plot of
Mn2O3 (650°C)/ITO, and (f) EIS plot of Mn2O3.
Electrochemical Studies
7. Conclusion
XRD plot confirmed the pure phase formation of MnO2 and Mn2O3 nps calcined at 350 °C and 650 °C
temperature.
The FTIR and Raman spectra differentiate the different phase of manganese oxide with their respective
peaks .
Scanning electron microscopy image of MnO2 at 350 °C and Mn2O3 at 650 °C calcination temperature
shows the spherical and rod like structure respectively.
Thermogravimetric analysis data showed nearly 20 % weight loss for MnO2 nps at 350 °C and 7 % weight
loss for Mn2O3 nps at 650 °C.
The CV, DPV and EIS study exhibited the good electrochemical properties for these two MnO2 and
Mn2O3 nanoparticles
7
9. Material Characterization
Fig. FTIR spectra of (a) ITO/ Mn2O3 electrode,
(b) Anti-AFB1/ Mn2O3 /ITO bioelectrode and
(c) BSA/Anti-AFB1/ Mn2O3 /ITO
Fig. (a), (b) SEM and EDX image, respectively;
(c) and (d) TEM images; (e) SAED pattern and
(f) HR-TEM image of Mn2O3nps.
9
Part-A Dimanganese trioxide (Mn2O3) based label-free Electrochemical Biosensor for Detection of Aflatoxin-B1
Fig. (a) XRD patterns of Mn2O3 and (b)
Raman spectra of Mn2O3 nps.
11. Electrochemical Studies
CV and DPV plot
Fig. Comparison CV plot of (a) ITO/Mn2O3(b) Anti-AFB1/Mn2O3/ITO (c)
BSA/Anti-AFB1/Mn2O3/ITO in as a function of scan rate (10-100 mV/s) in PBS
containing 3.3 mM of [Fe(CN)6]3-/4- and (d) DPV comparison among ITO/Mn2O3,
AntiAFB1/ Mn2O3 /ITO and BSA/Anti-AFB1/Mn2O3/ITO. 11
Fig. (a) The effect of pH and (b) incubation time for the
electrochemical response of BSA/Anti-AFB1/Mn2O3/ITO
immunoelectrode in PBS (0.1 M; 7 pH) containing [Fe(CN)6]3-/4-
pH and Incubation study
12. Fig.(a) Reproducibility of different immunoelectrode, (b) Repeatability study of
BSA/Anti-AFB1/Mn2O3/ITO immunoelectrode, (c) Control measurement for
Mn2O3/ITO electrode and d) interferant study of BSA/Anti-AFB1/Mn2O3/ITO
immunoelectrode against several interferants.
Plot of Reproducibility, Repeatability, Control and
Interferent study of immunosensor
12
Fig. (a) DPV response study of BSA/Anti-AFB1/Mn2O3/ITO immunoelectrode
(b) zoom plot of response study (c) bar plot of spiked and immunoelectrode and
(d) linear plot of BSA/Anti-AFB1/Mn2O3/ITO immunoelectrode and spiked
sample.
Response Study
𝐿𝑂𝐷 =
3.3 ∗ 𝑆𝐷
𝑆𝑙𝑜𝑝𝑒
13. Conclusion
The Mn2O3 nps phase was synthesized by co-precipitation route and X-ray diffraction study
confirms the purely synthesized Mn2O3 nps with an average crystallite size of 31.5 nm.
The transmission electron microscopy study confirms average particle size of 45 nm and
EDX study ascribed the elemental analysis with 100% purity.
The immunosensor was fabricated using Mn2O3 nps, Anti-AFB1 and BSA (as a blocking
agent) as BSA/Anti-AFB1/ Mn2O3 /ITO immunoelectrode to performed the response study of
AFB1 mycotoxin.
The incubation time was calculated 30 minutes for the response study.
The response study was performed between 1 pg mL-1 to 10 µg mL-1 and showed the
sensitivity of 2.044 µg mL ng-1 cm-2 with lower detection limit of 0.54 pg mL-1 .
A spiked sample response of corn extract was studied in the linear range of 1 pg mL-1 to 10
µg mL-1 and immunoelectrode (BSA/Anti-AFB1/ Mn2O3 /ITO).
13
14. Characterization Studies
Fig. (a) shows the TEM image, (b) HR-TEM image, (c) SAED
pattern of Mn3O4 nps, and (d) EDX and SEM image of Mn3O4 nps.
Part-B
Rapid and label-free detection of Aflatoxin-B1 via microfluidic electrochemical biosensor based on
manganese oxide (Mn3O4 nps) synthesized by co-precipitation route at room temperature
14
Fig. (a) XRD pattern and (b) Raman
spectra of Mn3O4 nps.
15. Fabrication of Microfluidic Chips and Channel
Schematic of Immobilization of Anti-AFB1 on
the Microfluidic Channel
15
16. Electrochemical Measurement
Optimization of flow of liquid sample inside the microfluidic channel
CV and DPV measurement of static mode of liquid sample
16
Mn3O4/ITO Anti-AFB1/Mn3O4/ITO
BSA/Anti-AFB1/Mn3O4/ITO
Fig. DPV response plot of Mn3O4/ITO, Ani-
AFB1/Mn3O4/ITO and BSA/Ani-AFB1/Mn3O4/ITO in
the static mode inside the microfluidic channel
17. CV measurement of dynamic flow of liquid sample
Fig. Flow Rate study using CV at various flow rate 1, 5, 10 and 15 for (a)
Mn3O4/ITO, (b) Anti-AFB1/Mn3O4/ITO and (c) BSA/Anti-
AFB1/Mn3O4/ITO; inside the microfluidic channel.
Fig. Flowrate study using DPV at various flow rate 1, 5, 10 and 15 for
(a) Mn3O4/ITO, (b) Anti-AFB1/Mn3O4/ITO and (c) BSA/Anti-
AFB1/Mn3O4/ITO; inside the microfluidic channel.
DPV Measurement of Dynamic flow of Liquid sample
17
18. Conclusion
The crystalline phase of Mn3O4 nps was synthesized at room temperature which crystallinity, elemental analysis and
morphology was characterized by XRD, Raman, EDX and TEM.
UV-photolithography was used to fabricate the three electrode chip and 200 µm channel.
The flowrate study was optimized for 1, 5, 10, and 15 µL min-1 in the microfluidic channel.
The immunosensor was fabricated inside the microfluidic channel using Mn3O4 nps, Anti-AFB1 and BSA (as a blocking
agent) as BSA/Ab-AFB1/Mn3O4/ITO immunoelectrode against the AFB1 mycotoxin.
The response study was carried out in the microfluidic channel with 1 µL min-1 flowrate.
The response study was measured from 1 pg mL-1 to 300 ng mL-1 range with 3.4 µA mL ng-1 cm-2 with lower detection
limit of 0.259 pg mL-1 .
18
20. Structural and Morphological Studies
Fig. (A) XRD pattern of MnO2 nps calcined at 350°C; (B) Scanning
electron microscopic image of MnO2 nps recorded (a) lower magnification
and (b) at higher magnification showing spherically shaped MnO2 nps
calcined at 350 °C.
Part-A Bio-Active Free Direct Optical Sensing of Aflatoxin B1 and Ochratoxin A Using a Manganese
dioxide Nano-System
20
Fig. Schematic of interaction
between MnO2 nps and AFB1 (A)
and OchA (B) explaining a
sequential decrease in the
absorbance of OchA.
Interaction of MnO2 with AFB1 and
OchA
21. Acknowledgment
Dr. Sobhan Sen (Supervisor)
Dr. Partima R. Solanki (Co-supervisor)
Prof. Kedar Singh (Dean of SPS, JNU)
Dr. Pijus Kumar Sasmal (SPS) & Dr. Jaydeep Bhattacharya (SBT) (RAC members)
Dr. Shasank Deka (DU) and Dr. Bipin kumar Gupta (NPL) (Thesis Reviewer)
Dr. G.B.V.S. Lakshmi (Women Scientist, SCNS, JNU)
All NanobioLab and SpecLab members
School of Physical Sciences staff, JNU
Advanced Instrumentation Research Facility (AIRF), JNU.
University grant commission for financial support
21