Presentation1, radiological film reading of the ankle joint.
•Download as PPTX, PDF•
16 likes•1,213 views

Health&Medicine.

Recommended
Recommended
More Related Content
What's hot
What's hot (20)
Similar to Presentation1, radiological film reading of the ankle joint.
Similar to Presentation1, radiological film reading of the ankle joint. (20)
More from Abdellah Nazeer
More from Abdellah Nazeer (20)
Recently uploaded
Recently uploaded (20)
Presentation1, radiological film reading of the ankle joint.
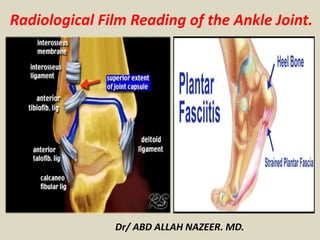
- 1. Dr/ ABD ALLAH NAZEER. MD. Radiological Film Reading of the Ankle Joint.
- 2. Disorders of the Achilles Tendon.
- 3. Disorders of the Achilles Tendon. Axial T2-weighted MR image with fat suppression shows barbed-wire appearance of fascicles (curved arrow). Also note partially circumferential high signal (straight arrow) consistent with small degree of peritendonitis.
- 5. Sagittal T1-weighted (A) and sagittal short tau inversion recovery (B) MR images show bulbous thickening (solid straight arrows) of Achilles tendon and that anterior and posterior margins of Achilles tendon are no longer parallel. No internal signal can be seen. Note normal volume of retrocalcaneal bursa fluid (solid curved arrow). Incidentally noted is cartilaginous calcaneal navicular coalition (open arrow).
- 7. Axial T2-weighted fat-suppressed MR image shows extensive thickening of Achilles tendon with loss of normal concave anterior margin (arrows).
- 9. Sagittal T1-weighted MR image shows markedly thickened Achilles tendon (white arrows) caused by rheumatoid arthritis. Also, note findings consistent with retrocalcaneal bursitis (straight black arrow) and with subtalar joint disease (curved black arrow). Erosion of calcaneus can be seen as well.
- 11. Gout. Sagittal T1-weighted MR image shows thickening of Achilles tendon (straight arrows) representing gouty infiltration. Gouty infiltration of anterior tibialis tendon (curved arrow) can also be seen.
- 13. 55-year-old woman with mucoid degeneration. Sagittal T1-weighted and sagittal short tau inversion recovery MR images show thickened Achilles tendon with internal signal (arrows). This signal was nonlinear and interrupted on T2-weighted image (not shown).
- 17. 58-year-old woman with mucoid degeneration. Sagittal F-short tau inversion recovery image : inversion time, 150 msec) shows irregular longitudinal mucoid deposit in Achilles tendon (arrows).
- 19. 8-year-old man with mucoid degeneration. Axial T2-weighted fat-suppressed MR image shows thickened Achilles tendon (arrows) with multifocal speckled appearance consistent with mucoid degeneration.
- 21. 47-year-old male runner with peritendonitis. Axial T2-weighted fat-suppressed MR image shows thin rim of partially circumferential high signal (arrows), which represents mild peritendonitis. Background mucoid degeneration within tendon and intratendon signal can be seen.
- 23. 45-year-old man with acute Achilles tendonitis. Fat-suppressed MR image (TR/TE, 6000/80) shows edema in fat anterior to Achilles tendon (arrows).
- 25. 45-year-old man with interstitial tear. Sagittal short tau inversion recovery image (TR/TE, 4000/48; inversion time, 150 msec) shows multiple longitudinal lines (arrows) inside thickened Achilles tendon consistent with interstitial tear.
- 27. Achilles interstitial tear. Sagittal PD and PD FS and axial PDFS images reveal areas of T2 fluid signal parallel to the long axis of the tendon (arrows). Interstitial tears are caused by coalescence of areas of degeneration.
- 29. Longitudinal area (arrowheads) inside distal Achilles tendon consistent with insertional interstitial tear. Small amount of reactive marrow edema (straight arrow) is seen in calcaneus as well as excessive retrocalcaneal bursitis (curved arrow). Partial posterior Achilles tendon tear (black arrow). Longitudinal interstitial tear (white arrows) and evidence of underlying hypoxic degeneration with thickened tendon can also be seen.
- 31. Partial Achilles tendon rupture. Axial PD and sagittal PD FS and PD images of a partial rupture of the fibers of the Achilles tendon (arrows).
- 33. Complete Achilles tendon tear (arrows) in typical location: 5 cm from its insertion. Gap is approximately 1 cm. Completely avulsed Achilles tendon (arrow) with significant gap because proximal fibers have been retracted. Fluid can be seen within gap.
- 35. Complete Achilles tendon rupture. Axial and sagittal PD FS and PD images of a complete rupture of the Achilles tendon with tendon retraction (arrows).
- 37. Acute Achilles tendon tear and atrophy. Axial short tau inversion recovery image shows evidence of edema within soleus muscle (arrows), which is consistent with acute atrophy.
- 39. 48-year-old man with symptomatic spur. Sagittal T1-weighted (A) and short tau inversion recovery (B) MR images show subtle edema in posterior calcaneal spur (arrows).
- 41. MR images show degenerative cyst at posterior calcaneus (arrows) adjacent to thickened Achilles tendon insertion. Small amount of reactive edema can be seen around cyst.
- 43. Edema (curved arrows) in Kager's fat pad anterior to Achilles tendon, which is consistent with acute Achilles tendonitis. Extensive reactive marrow edema (straight arrows) can also be seen.
- 45. Insertional tendinosis. Sagittal PD FS and PD, and axial PD images of the ankle revealing a thickened Achilles tendon insertion with increased internal signal (arrows).
- 47. Axial fast spin-echo MR image shows extensive retrocalcaneal bursitis (solid arrow) with linear thick signal within Achilles tendon (open arrow) representing insertional tendonitis.
- 49. Grade 1 soleus muscle strain secondary to an Achilles rupture. Axial FS PD FSE image.
- 51. Sagittal T1-T2WI MR images show soft-tissue signal displacing fat posterior to thickened Achilles tendon consistent with retro-Achilles bursitis (open arrow, B). Ill-defined fluid can be seen in retrocalcaneal bursa, which is consistent with retrocalcaneal bursitis (curved arrows). Edema in enlarged tuberosity (straight arrows) is seen as well. All these findings are suggestive of Haglund's disease.
- 53. Haglund’s syndrome. Sagittal PD, sagittal PD FS and axial T2 FS images of the posterior ankle. Images show an enlarged bursal projection (black arrow), retrocalcaneal bursitis (white arrows), Achilles insertional tendinosis (orange arrows) and adjacent calcaneal bone marrow edema pattern (blue arrows), consistent with Haglund’s syndrome. Otherwise known as a “pump bump”, an enlarged bursal projection or Haglund’s deformity predisposes to this syndrome.
- 57. Peroneal Tendon Injuries. (a) Axial T1-weighted MR image shows a flat to slightly concave retromalleolar groove (black arrow). Note the small, triangular, labrum-like, low-signal-intensity ridge at the fibular SPR attachment site (white arrow) and the PB muscle belly (arrowhead). (b) Axial T1-weighted MR image shows a convex retromalleolar groove (black arrow), with an associated irregular partially torn PB tendon (white arrow). Note the mildly thickened PL tendon (white arrowhead), a finding consistent with tendinopathy. The SPR is seen superficial to the peroneal tendons (black arrowhead).
- 59. Enlarged retrotrochlear eminence and peroneal tubercle. (a) Axial T1-weighted MR image shows a mildly enlarged retrotrochlear eminence (arrow) posterior to the peroneal tendons. (b) Axial T1-weighted MR image shows a markedly enlarged peroneal tubercle (black arrows). Note the attenuated PB tendon (white arrow) and mildly thickened PL tendon (arrowhead). The prominent peroneal tubercle measures more than 5 mm in width (double-headed arrow) relative to the lateral calcaneal cortex.
- 61. Sagittal T1-weighted MR image of the ankle shows a torn PL and retracted os peroneum (arrowhead) to the level of the lateral malleolus and a longitudinal split tear of the PB tendon (arrows).
- 63. Axial fat-saturated T2-weighted MR image shows a markedly distended common peroneal tendon sheath in the retromalleolar groove with an associated heterogeneous synovial fluid complex (white arrow), consistent with tenosynovitis. The PB tendon (black arrow) is crescentic, boomerang-shaped, irregular, moderately thickened, and heterogeneous, findings consistent with severe tendonopathy. The PL tendon (arrowhead) is minimally thickened, a finding consistent with mild tendonopathy.
- 65. Axial fat-saturated T2-weighted MR image shows an increased heterogeneous synovial fluid complex in the peroneal tendon sheath (arrowheads) with associated linear low-signal-intensity bands, consistent with stenosing tenosynovitis.
- 67. Axial fat-saturated T2-weighted MR image shows a longitudinal split tear of the PB tendon with an irregular appearance of two hemitendons (arrows) and the PL tendon (arrowhead) seen deep to the PB split tendon. The findings are consistent with a Raikin type B intrasheath subluxation.
- 69. Severe tendonopathy of the PL tendon. (a) Sagittal STIR MR image shows a moderately thickened and irregular PL tendon at the lateral aspect of the calcaneus (arrowheads), a finding consistent with severe tendonopathy. (b) Axial STIR MR image shows bone marrow edema along the lateral aspect of the calcaneus (black arrowheads), with associated PL tendonopathy (white arrowhead) and PB tendonopathy (arrow). A longitudinal split tear of the PB tendon that extended to the level of the peroneal tubercle was seen in the inframalleolar region (not shown).
- 71. Longitudinal split tear of the PB tendon. (a) Axial T1-weighted MR image shows a longitudinal split tear of the PB tendon (white arrows) in the fibular retromalleolar groove, with a grossly normal PL tendon (arrowhead). Note the accessory peroneus quartus muscle at the posteromedial aspect of the peroneal tendons (black arrow), which is causing crowding in the retromalleolar groove. (b) Coronal fat-saturated proton-density–weighted MR image shows the grossly normal PL tendon (arrowhead) between two PB hemitendons (white arrows), with the peroneus quartus tendon attaching onto the lateral aspect of the calcaneus at the retrotrochlear eminence (black arrows).
- 73. PL tendon rupture and longitudinal split tear of the PB tendon. (a) Sagittal STIR MR image of the ankle shows a ruptured PL tendon retracted to the level of the lateral malleolus (arrowhead) and a longitudinal split tear of the PB tendon (arrows).
- 75. Longitudinal split tear of the PL tendon, with an associated lateral ankle ligament injury and a type 1 SPR injury. (a) Axial fat-saturated T2-weighted MR image shows preserved anterior (black arrowhead) and posterior (curved black arrow) syndesmotic ligaments, a flattened PL tendon (white arrowhead), and a normal PB tendon (straight black arrow). Note the lateral positioning of the peroneal tendons, which invaginate into the small undersurface SPR tear (white arrow), a finding secondary to a type 1 SPR injury. (b) Axial fat-saturated T2-weighted MR image shows thickening of the PL tendon (white arrowheads), a finding consistent with tendonopathy, and a normal PB tendon (black arrow). Note the markedly thickened and irregular anterior (black arrowhead) and posterior (white arrow) talofibular ligaments, findings consistent with a chronic injury or tear. (c) Axial fat- saturated T2-weighted MR image shows a longitudinal split tear of the PL tendon (arrowheads) and a normal PB tendon (white arrow). Note the marked thickening and increased signal intensity of the calcaneofibular ligament (black arrow), findings consistent with a tear.
- 77. Axial T1-weighted MR image at the level of the fibular retromalleolar groove shows an irregular torn SPR with increased signal intensity and surrounding mild soft-tissue stranding. Note the fleck of bone (black arrowhead) avulsed off of the lateral malleolus, a finding consistent with a type 3 SPR injury. The peroneal tendons are anteriorly subluxated from the retromalleolar groove. There is a longitudinal split tear of the PB tendon (arrow). The mild thickening and minimal central intermediate signal intensity of the PL tendon (white arrowhead) are consistent with tendonopathy.
- 79. Ganglion cyst at the lateral aspect of the ankle (hindfoot). (a) Axial fat-saturated T2-weighted MR image shows a well-defined lobulated mass with fluid signal intensity (arrowheads) at the lateral aspect of the calcaneus, a finding that involves the posterior aspect of the IPR and is consistent with a ganglion cyst. Note the grossly normal peroneal tendons (arrow). (b) Long-axis US image shows the anechoic ganglion cyst (arrowheads) and associated posterior acoustic enhancement (arrows). LM = lateral malleolus.
- 80. Disorders of the Anterior tibialis Tendon.
- 81. Peroneal Tendonitis / Tendonopathy. Disorders of the Anterior tibialis Tendon.
- 83. Peroneal tenosynovitis and longitudinal split tear of the peroneus brevis tendon on the axial images. A: Circumferential fluid collection is evident within the common peroneal tendon sheath (arrow), in keeping with tenosynovitis. B: The peroneus brevis tendon has been divided into two separate subtendons (short arrows) which partially envelope the peroneus longus tendon (long arrow), in this case of peroneus brevis longitudinal split tear.
- 85. Tenosynovitis of the combined sheath of the paired peroneal tendons. A (proton density- weighted axial sequence) and B (T2- weighted fat-suppressed axial sequence): An abnormally large amount of fluid surrounding the peroneus brevis and longus tendons is shown (arrow). Thickened synovium is present posteriorly, representing an inflammatory tenosynovitis.
- 87. MR images of tibialis anterior tendinosis - PD (upper left) and PD with fat saturation (upper right and lower images). There is thickening and hypersignal of the tibialis anterior tendon (arrows). There is also a small partial rupture of the tendon, noted by higher signal intensity in the center of the tendon, similar to fluid signal.
- 89. Anterior tibial tendon partial rupture. Sagittal PD and PD FS images revealing discontinuity, thickening and partial retraction of the anterior tibial tendon (arrows) secondary to laceration.
- 91. Insertional AT tendinosis and partial tear in a 68-year-old man. Short-axis (a) and long-axis (b) fat- suppressed T2-weighted MR images show increased signal intensity of the AT tendon and longitudinal splitting (white arrows). Midfoot medial column osteoarthritis demonstrated by productive changes, marrow edema, and subchondral cysts (black arrows in a) may have predisposed toward the tear.
- 93. Partial ATT rupture with retraction. Sagittal and axial T2 FS images of the ankle showing partial discontinuity and retraction of ATT fibers with associated tenosynovitis (arrows). Sagittal and transverse ultrasound images in the same patient reveal the thickened ATT with partially retracted fibers and tenosynovitis.
- 95. Complete AT tendon tear in an 83-year-old man. (a) Sagittal T1-weighted MR image shows complete disruption of the AT tendon with thickening and retraction of the proximal tendon stump (arrow). (b) Axial fat-saturated T2-weighted MR image shows absence of the tendon (arrow) with surrounding edema.
- 97. Sagittal T2-weighted MR images show suspected intratendinous gout producing a high- grade partial AT tendon tear. (a) Marked AT tendon thickening and heterogeneity (arrow) is seen with suspected intratendinous gout involvement of the ankle joint (*). (b) Multiple erosions and soft-tissue masses (*) are compatible with suspected gout arthropathy.
- 99. MR evaluation of tibialis anterior tenosynovitis - There is fluid distension involving the full circumference of the tibialis anterior tendon (white arrows). Note the normal tendon just proximal to its insertion (yellow arrow).
- 101. AT tenosynovitis manifesting as a medial midfoot mass in a 42-year-old woman. Long-axis (a) and short- axis (b) fat-suppressed fluid-sensitive MR images show fluid distending the AT tendon sheath (arrow) near its distal course over the medial cuneiform and first metatarsal base. The tendon caliber is normal.
- 103. Tibialis anterior full-thickness tear - on the left, note the radiographic appearance of a soft-tissue swelling anterior to the distal tibia (white arrows). MR images (T1 weighted and T2 weighted with fat saturation) show the soft tissue mass to correspond to the retracted tendon (blue arrows) and fluid (red arrows). There is complete tendon disruption, confirming full-thickness tear.
- 105. Tibialis anterior subtendinous bursitis - Note fluid distension only partially involving the tendon (white arrows), in its distal portion, compared to the contralateral normal tendon (asterisk). This partial involvement is necessary to differentiate from tenosynovitis.
- 106. Disorders of the Posterior tibialis Tendon.
- 107. Posterior tibial tendinosis. Axial images (A, B) exhibit moderate thickening and intermediate signal in the distal posterior tibial tendon (arrows). Disorders of the Posterior tibialis Tendon.
- 109. PTT hypertrophy (type 1 tear). Axial PD, coronal and sagittal PD FS images showing a hypertrophied PTT with heterogenous signal intensity with tenosynovitis, consistent with a type 1 PTT tear. A normal PTT should be twice the size of the FDL, the abnormal tendon in this case is much larger.
- 110. Longitudinal split tear of the posterior tibial tendon, creating the “four-tendon sign.” Axial images (A, B) demonstrate four (instead of three) distinct tendons at the medial side of the ankle joint. The two most anteromedial tendinous structures (arrows) represent longitudinal splitting and separation of the original posterior tibial tendon.
- 111. Longitudinal split tear of the posterior tibial tendon, creating the “four-tendon sign.” Axial images (A, B) demonstrate four (instead of three) distinct tendons at the medial side of the ankle joint. The two most anteromedial tendinous structures (arrows) represent longitudinal splitting and separation of the original posterior tibial tendon.
- 113. Multifocal split tears of the posterior tibial tendon. Axial images (A, B) demonstrate multiple linear fluid-like signals within the distal posterior tibial tendon fragments (arrows).
- 115. Posterior tibial tendon tear in the presence of os naviculare. A: Axial image demonstrates an os naviculare type II (arrow) with mild bone marrow edema at the posterior tibial tendon insertion. B: More proximally, the posterior tibial tendon exhibits a longitudinal split tear (arrow).
- 117. Complete posterior tibial tendon disruption. A: In the axial plane, only fluid is identified at the expected position of the posterior tibial tendon (arrow). B: Sagittal image shows complete disruption of the posterior tibial tendon, with associated retraction of the torn fragments (arrows).
- 119. Retracted PTT tear. Sagittal PD FS images at the medial ankle showing a type 3 PTT tear, with torn, retracted fibers (arrow).
- 121. Posterior tibial tenosynovitis. A: Circumferential fluid along the posterior tibial tendon (long arrow) is indicative of tenosynovitis, in this case of rheumatoid arthritis. Note concurrent peroneus longus tenosynovitis (short arrow). B: A large fluid collection along with multiple tiny hypointense foci within the flexor hallucis tendon sheath (arrow) is due to synovial chondromatosis and stenosing tenosynovitis.
- 122. Disorders of the Flexor Hallucis longus Tendon.
- 123. Posteromedial ankle pain. Sagittal fast short T1 inversion recovery image shows enlarged os trigonum tarsi (open arrow) with loculated fluid in flexor hallucis longus tendon sheath (solid arrow) proximal to os. Flexor hallucis longus tendon was normal (not shown). Disorders of the Flexor Hallucis longus Tendon.
- 125. Clawing of great toe after penetrating injury. Axial proton density—weighted MR image shows scarring (arrow) at myotendinous junction of flexor hallucis longus tendon 1 cm above talar dome.
- 127. Posterior ankle pain. MR image inferior to A shows enlarged os trigonum tarsi (thin arrow) with adjacent cystic changes in talus (thick arrow) suggestive of altered biomechanics. There is abrupt change in amount of fluid in flexor hallucis longus tendon sheath at level of os.
- 129. FHL tendinosis and tear. Axial PD FS and axial and sagittal PD images revealing FHL tendinosis at the level of the sustanaculum tali (white arrows), with distal degeneration and tearing of the tendon fibers (orange arrows). FHL tendinosis is commonly seen in ballet dancers due to repetitive plantar flexion. If associated with nodularity, the FHL tendon may cause triggering, snapping or even a persistent plantar flexed position.
- 131. Flexor hallucis longus Tear.
- 133. FHL injuries are associated with extreme plantarflexion and push-off maneuvers, as occur in football players and ballet dancers. There is chronic muscle strain of the FHL just proximal to the sustentaculum tali. (A) Axial FS PD FSE with FHL muscle chronic strain (hyperintense signal). (B) Sagittal T1-weighted image showing extreme plantarflexion in the en pointe position with proximity of the transverse ligament and posterior process.
- 135. FHL tear proximal to the master knot of Henry. (a) Sagittal inversion-recovery image in a 58-year-old man shows FHL retraction to the ankle joint (arrow). (b) Short-axis proton-density–weighted MR image at the master knot of Henry (circled) shows absence of the FHL (black arrow) adjacent to the FDL (white arrow).
- 137. Tenosynovitis of the flexor hallucis longus.
- 139. Flexor Hallucis Longus Tenosynovitis.
- 141. FHL tenosynovitis with a ganglion in a 22-year-old female ballet dancer. Sagittal fat- suppressed T2-weighted MR image shows FHL tenosynovitis (white arrows) with secondary ganglion formation distally (black arrow) plantar to the interphalangeal joint.
- 143. Stenosing tenosynovitis; sagittal PD-fat-saturation-weighted sequence (A and B). Stenosing tenosynovitis of the FHL tendon (arrows) secondary to os trigonum syndrome (arrowhead in B).
- 145. Post-traumatic synovitis and stenosing tenosynovitis. A: Axial image acquired after recent ankle injury demonstrates circumferential fluid (arrow) around the posterior tibial tendon and diffuse soft tissue edema, corresponding to post-traumatic tenosynovitis. B: Sagittal image exhibits focal fluid distensions and septations within the flexor hallucis longus tendon sheath, which are indicative of stenosing tenosynovitis.
- 147. FHL stenosing tenosynovitis (STS). Sagittal T2 FS image showing a large amount of fluid distending the FHL tendon sheath proximal to the talar fibro-osseous tunnel, suggesting stenosing tenosynovitis. A flexor digitorum longus accessorious may cause crowding and contribute to STS. STS may also occur in isolation or in combination with posterior impingement.
- 149. Gouty involvement of the FHL tendon in a 38-year-old man. Short-axis contrast material–enhanced fat-suppressed T1-weighted MR image shows enhancing soft tissue (*) surrounding and invading the FHL tendon (arrows).
- 151. Giant cell tumour enveloping flexor hallucis longus tendon.
- 152. Disorders of the Extensor Hallucis Longus Tendon.
- 153. Chronic partial tear of the extensor hallucis longus in a 25 year old female basketball player with history of previous injury. An axial fast spin echo T2-weighted image at the level of the tibiotalar joint reveals a small T2-hyperintense focus (arrow) in the EHL tendon. Disorders of the Extensor Hallucis Longus Tendon.
- 155. Chronic rupture of the extensor hallucis longus in a 43 year-old female with anterior pain and inability to extend the great toe. Sagittal T1-weighted (left) and fat saturated fast spin echo proton density-weighted images (right) show abrupt termination of the EHL over the anterior talus (arrows), without associated edema or fluid
- 157. Tendinosis of the extensor hallucis longus. A 17 year-old male basketball player reports anterior right ankle pain. Axial fast spin echo T2-weighted (left) and sagittal fat saturated fast spin echo T2-weighted (right) images show focal thickening of the extensor hallucis longus over the anterior tibiotalar joint (arrows), with mild surrounding peritendinous edema.
- 159. A lateral radiograph of the ankle with well defined calcification projected along the dorsal surface of the hind foot. Sagittal MRI confirming abnormal calcification within the extensor hallucis and digitorum longus tendons (arrow) with inflammatory change within the surrounding soft tissues (arrow).
- 161. Complete EHL tear in a 41-year-old woman with a midfoot laceration injury. Sagittal MR image of the forefoot at the level of the first toe shows abrupt EHL tendon discontinuity (arrows) and a 4-cm tendon gap (*). Lacerations from sharp objects that fall on the dorsum of the foot are a frequent cause of extensor tendon tears.
- 163. Tenosynovitis of the extensor hallucis longus. A 77 year-old female patient reported difficulty walking and anterior ankle pain. Axial fast spin echo T2- weighted (left), coronal fat saturated proton density- weighted (right) and sagittal fat saturated proton density-weighted (bottom) images show fluid signal and a mesotendon in the extensor hallucis longus tendon sheath.
- 165. Ganglion cyst displacing the EHL tendon in a 33-year-old woman with a 1-month history of foot pain. Sagittal (a) and short-axis (b) fat-suppressed T2-weighted MR images of the midfoot show a multilobulated mass of fluid signal intensity displacing the EHL dorsally (arrow). A ganglion at that site could also cause entrapment of the medial branch of the DPN.
- 166. Disorders of the Flexor Digitorum Longus Tendon.
- 167. FDL tear following hammer toe repair in a 76-year-old woman. (a) Short-axis fat-suppressed proton- density–weighted MR image shows absence of the FDL tendon slip to the second toe (arrow). (b) Long-axis fat-suppressed T2-weighted MR image shows the distal tendon stump (arrow). Disorders of the Flexor Digitorum Longus Tendon.
- 169. FDL tenosynovitis.
- 171. Tenosynovitis. (a) Axial T2 FS. Increased T2 weighted signal intensity is visualized about the FHL (blue arrow) greater than the FDL (red arrow) and PT (yellow arrow) tendons. (b) Sagittal T2 FS. Increased fluid is again noted within the FHL tendon sheath (blue arrow). (c) Sagittal T2 FS. A trace amount of increased fluid is noted within the PT tendon sheath.
- 172. Disorders of the Extensor Digitorum Longus Tendon.
- 173. Tendinosis of the extensor digitorum longus. A 40 year- old female presented with a palpable anterior ankle mass. Axial T1-weighted (left) and fast spin echo T2-weighted (right) images through a skin marker placed on the palpable abnormality reveal focal thickening of the extensor digitorum longus tendon (arrows), with mild increased signal in the tendon on the T1-weighted image. A sagittal fat saturated T2- weighted image (bottom) also shows the area of focal thickening, without increased intrasubstance signal. Disorders of the Extensor Digitorum Longus Tendon.
- 175. Partial tear of the extensor digitorum longus.
- 177. Tenosynovitis of the distal second and third EDL tendon slips in a 63-year-old woman. Short-axis fat- saturated proton-density–weighted MR image at the level of the metatarsal shafts shows fluid distending the tendon sheaths of the second and third EDL divisions (arrows). Unlike in the flexor compartment of the ankle, fluid in the extensor tendon sheaths, even when minimal, is almost always pathologic.
- 179. EDL tenosynovitis. Axial and sagittal PD FS images revealing fluid distending the tendon sheath of the EDL (white arrows). Note the normal appearing ATT (blue) and EHL (orange).
- 181. Extensor digitorum longus tenosynovitis
- 183. Tenosynovitis of the extensor digitorum longus and peroneus tertius in a 73 year-old male with anterior ankle pain. Axial fast spin echo T2-weighted (left) and sagittal fat saturated proton density-weighted (right) images show prominent distention of the shared tendon sheath of the EDL and PT (arrows). Fluid in the tendon sheath delineates the five separate tendons of the EDL and PT on the axial image; the most lateral tendon is the PT (short arrow), and the four medial tendons of the EDL (arrowheads) insert on the second through fifth toes.
- 185. EDL tenosynovitis.
- 187. Tuberculous tenosynovitis. (a) Pre-contrast - coronal T1-weighted images with gadolinium enhancement show tenosynovitis in the distal portion of the lower limb - thickening of the extensor digitorum longus (white arrows) and anterior tibial (arrow heads) tendons.
- 189. Reactive arthritis and tenosynovitis of multiple tendons in a 38-year-old man. Axial fat-suppressed T2- weighted MR image shows synovitis and sheath distention of the AT (straight white arrow), EDL (curved white arrow), and peroneal tendons (black arrow) with debris or synovial hypertrophy. Involvement of multiple tendons and debris within tendon sheaths usually reflect inflammatory arthritis.
- 191. Painful swelling in the right ankle diagnosed with tuberculous tenosynovitis. Axial T1- weighted images at the level of the right tibiotalar joint demonstrate contrast enhancement of the extensor digitorum longus (black arrows) and tibialis anterior tendons (arrow heads) and surrounding smooth tissue. The extensor hallucis longus tendon is normal (white star).
- 193. Tuberculous tenosynovitis. Axial fat-suppressed T2-weighted MR images at the level of the right tibiotalar joint shows thickening of the extensor digitorum longus (arrows) and tibialis anterior tendons (arrow heads), peritendinous edema and minimal fluid within the synovial sheath, edema in the surrounding subcutaneous tissues with loss of fat planes and increased signal intensity within the tendons.
- 195. Sinus tarsi ganglion mimicking EDL tenosynovitis in a 43-year-old man. Sagittal (a) and axial (b) fat- suppressed T2-weighted MR images show a sinus tarsi ganglion (straight white arrows in a) insinuating between the retinacular roots (black arrow in a) and partially enveloping the EDL tendon (curved white arrow). A tear of the anterior talofibular ligament (black arrow in b) is seen with fluid distending the sheaths of the flexor and peroneal tendons (* in b), findings related to a recent inversion injury. Sinus tarsi syndrome.
- 199. Subtalar arthritis with sinus tarsi syndrome.
- 203. Retinacular injury after ankle inversion injury in a 29-year-old woman. Axial proton-density–weighted MR image of the distal aspect of the ankle shows marked thickening and heterogeneity of the inferior extensor retinaculum (arrows).
- 204. Disorder of the lateral ankle ligaments.
- 206. T1-weighted spin-echo image demonstrates thickening and contour irregularity of the anterior inferior tibiofibular ligament (arrow). (b) Fat-suppressed T2-weighted fast spin-echo image shows intraligamentous edema, contour irregularity, and surrounding edema involving the anterior inferior tibiofibular ligament (arrow).
- 208. Axial STIR MRI image showing rupture of the anterior inferior tibiofibular ligament (AITFL)
- 210. Complete anterior talofibular ligament injury.
- 214. Disorder of the Medial ankle ligaments.
- 215. Axial T1-weighted (left) and coronal proton density-weighted fat-suppressed (right) images demonstrate loss of the normal striations of the PTTL with increased signal indicating edema and contusion (asterisks). Disorder of the Medial ankle ligaments.
- 217. Coronal proton density fat-suppressed (left), axial T2-weighted FSE (middle), and sagittal T2-weighted fat- suppressed (right). In this pattern the anterior superficial ligaments fail initially. Proximal (type I) avulsion of the tibionavicular ligament is demonstrated at the anterior margin of the anterior colliculus (arrows) and ill- defined, lax and edematous distal ligament fibers (arrowheads) are apparent. The patient also had a tear of the anterior inferior tibiofibular ligament and a non-displaced spiral fracture of the distal fibular shaft.
- 219. Coronal fat-suppressed images through the posterior (left) and anterior (right) portion of the anterior colliculus demonstrate a chronic partial avulsion of the tibial spring ligament (arrowheads). On the more anterior slice the tibionavicular ligament (arrow) is abnormally thickened and low in signal indicating fibrosis from remote trauma. The posterior tibial tendon (PT) and superomedial portion of the spring ligament complex (SL) are labeled.
- 221. Coronal proton density fat-suppressed (left) and axial T2-weighted FSE (right) images demonstrate bare cortex at the intercollicular sulcus (arrowheads) with fluid signal filling the ligament defect (asterisk). In addition the superficial ligaments are scarred and appear abnormally thickened and irregular compatible with a chronic tear. The posterior tibial (PT) and flexor digitorum longus (FDL) tendons are indicated.
- 223. Coronal proton density-weighted fat-suppressed (middle), and axial T1-weighted images demonstrate distortion and thickening of the posterior tibiotalar ligament containing embedded ossicles (arrowheads) compatible with posteromedial impingement.
- 226. Deltoid ligament sprain. (a, b) Coronal and axial T2 FS. Increased T2 weighted signal intensity is visualized within the posterior deep fibers of the deltoid ligament (yellow arrows), compatible with grade 2 sprain.
- 228. Multi-ligamentous injuries. (a) Axial T2 FS. Intermediate T2 weighted signal intensity within and irregularity of the anterior tibiofibular ligament (blue arrow) is compatible with a partial tear. (b) Axial T2 FS. Complete disruption of the ATFL is evident (red arrow). The PTFL is intact, but appears mildly thickened with increased T2 weighted signal intensity (yellow arrow), consistent with partial tear. (c) Coronal T2 FS. Intermediate T2 weighted signal intensity is visualized within the deep posterior deltoid ligament (orange arrow), compatible with a partial tear. Opposing contusions are seen within the medial malleolus and medial talar dome (green arrows).
- 230. Lateral OLT with intact overlying chondral surface. Subchondral trabecular fracture and adjacent marrow edema are demonstrated on a coronal T1-weighted image (A). Mid-lateral talar dome location is shown with a cross- sectional area of reactive marrow edema. The edema associated with OLT should not be misinterpreted and result in overestimation of the area of trabecular bone involved. Coronal T1-weighted image. (B) Coronal FS PD FSE image. (C) Axial FS PD FSE image. (D) Color illustration with the capsule cut and the tibia and fibula reflected. Compression-type OLT corresponding with an area of subchondral trabecular compression in a stage I lesion. Osteochondral lesions.
- 232. Stage II (IIB) OLT with a shallow and wafer-shaped fragment and incomplete separation from the lateral talar dome. (A) Coronal T1-weighted image. (B) Coronal FS PD FSE image. (C) Sagittal FS PD FSE image. (D) A nondisplaced partial fracture shown in a color graphic corresponding to either a communication with the talar dome or an open articular surface lesion with incomplete separation of the fragment. Subchondral cystic lesions are associated with extension of a fracture to the talar chondral surface.
- 234. (a) Coronal T1. A subcentimeter osteochondral fracture of the medial talar dome is present (red ellipse). (b) Coronal T2. A rim of T2 weighted hypointense signal is visualized along the margin of the osteochondral defect (yellow arrow). No intervening fluid is present to suggest an unstable injury.
- 236. Nondisplaced fragment in a stage III OLT with intermediate-signal-intensity granulation tissue at the fragment—talus interface. (A) Sagittal T1-weighted image. (B) Sagittal FS PD FSE image.
- 238. (A) Stage IV OLT with interruption of the subchondral plate, subchondral cystic change, and medially displaced chondral fragment on a coronal section color illustration. (B, C) Stage IV OLT with the displaced fragment located in the anterior tibiotalar joint capsule. The lateral OLT is the donor site. Arthroscopy is performed on all stage III and IV lesions and stage I and II lesions that fail conservative treatment. (B) Coronal T1-weighted image. (C) Axial FS PD FSE image. (D) Displaced fragment from a medial talar dome donor site in OLT on a color graphic superior view of the talus with the tibia and fibula resected.
- 240. Osseous contusions. (a) Sagittal PD FS. Increased T2 weighted signal intensity is identified within the talus (blue arrow) and cuboid (red arrow). (b) Coronal T2. Again identified is increased T2 weighted signal intensity within the talus, consistent with contusion.
- 242. Talocalcaneal coalition. (a) Sagittal PD FS. The middle facet of the subtalar joint is broadened, with osseous (blue arrow) and fibrocartilagenous (yellow arrows) bridging identified. Associated mild edema is also noted in the talus and calcaneus (green arrows). Axial T2 FS. Talocalcaneal coalition of the middle facet is again evident (orange arrow). Increased T2 weighted signal intensity within the adjacent talus and calcaneus (orange arrows) is compatible with edema.
- 243. Os trigonum syndrome. Os Trigonum syndrome.
- 246. Os trigonum syndrome. Sagittal PD FS. A prominent os trigonum is evident (blue arrow). Significant surrounding soft tissue edema is present (yellow arrows). Increased signal intensity is also visualized within the accessory os and posterior talus (orange arrows), consistent with marrow edema.
- 258. Tarsal tunnel syndrome. (a) Axial T1. There is marked enlargement of the tibial nerve (blue ellipse). (b) Axial T1. Post-surgical changes of prior flexor retinaculum release are visualized (red arrow), as evidenced by thickening and discontinuity of the retinaculum and overlying scarring of the subcutaneous tissues. (c) Axial T2 FS. Enlargement of and intermediated T2 weighted signal intensity within the abductor hallucis muscle (yellow arrow) are evident. (d) Sagittal PD FS. Enlargement of and edema within the flexor digitorum brevis muscle (purple arrow) are also identified. This constellation of findings is consistent with tarsal tunnel syndrome and compression of the plantar branch of the tibial nerve.
- 260. Baxter Neuropathy. (a,b) Sagittal and axial T1. Isolated fatty atrophy of the abductor digiti minimi muscle, consistent with chronic compression of the inferior calcaneal nerve.
- 262. RHEUMATOID ARTHRITIS OF ANKLE JOINT. sagittal T1-weighted without an with contrast administration shows active inflammatory pannus affecting posterior subtalar joint, marginal bone erosions and subcutaneous rheumatoid nodule are seen.
- 263. Plantar Fasciitis.
- 266. Plantar Fasciitis.
- 268. Plantar Fasciitis.
- 269. Bursa.
- 270. Bursa.
- 275. Avascular necrosis.
- 278. Köhler disease
- 280. Köhler disease.
- 284. Avascular necrosis of navicular bone.
- 285. Thank You.