Download as PDF, PPTX


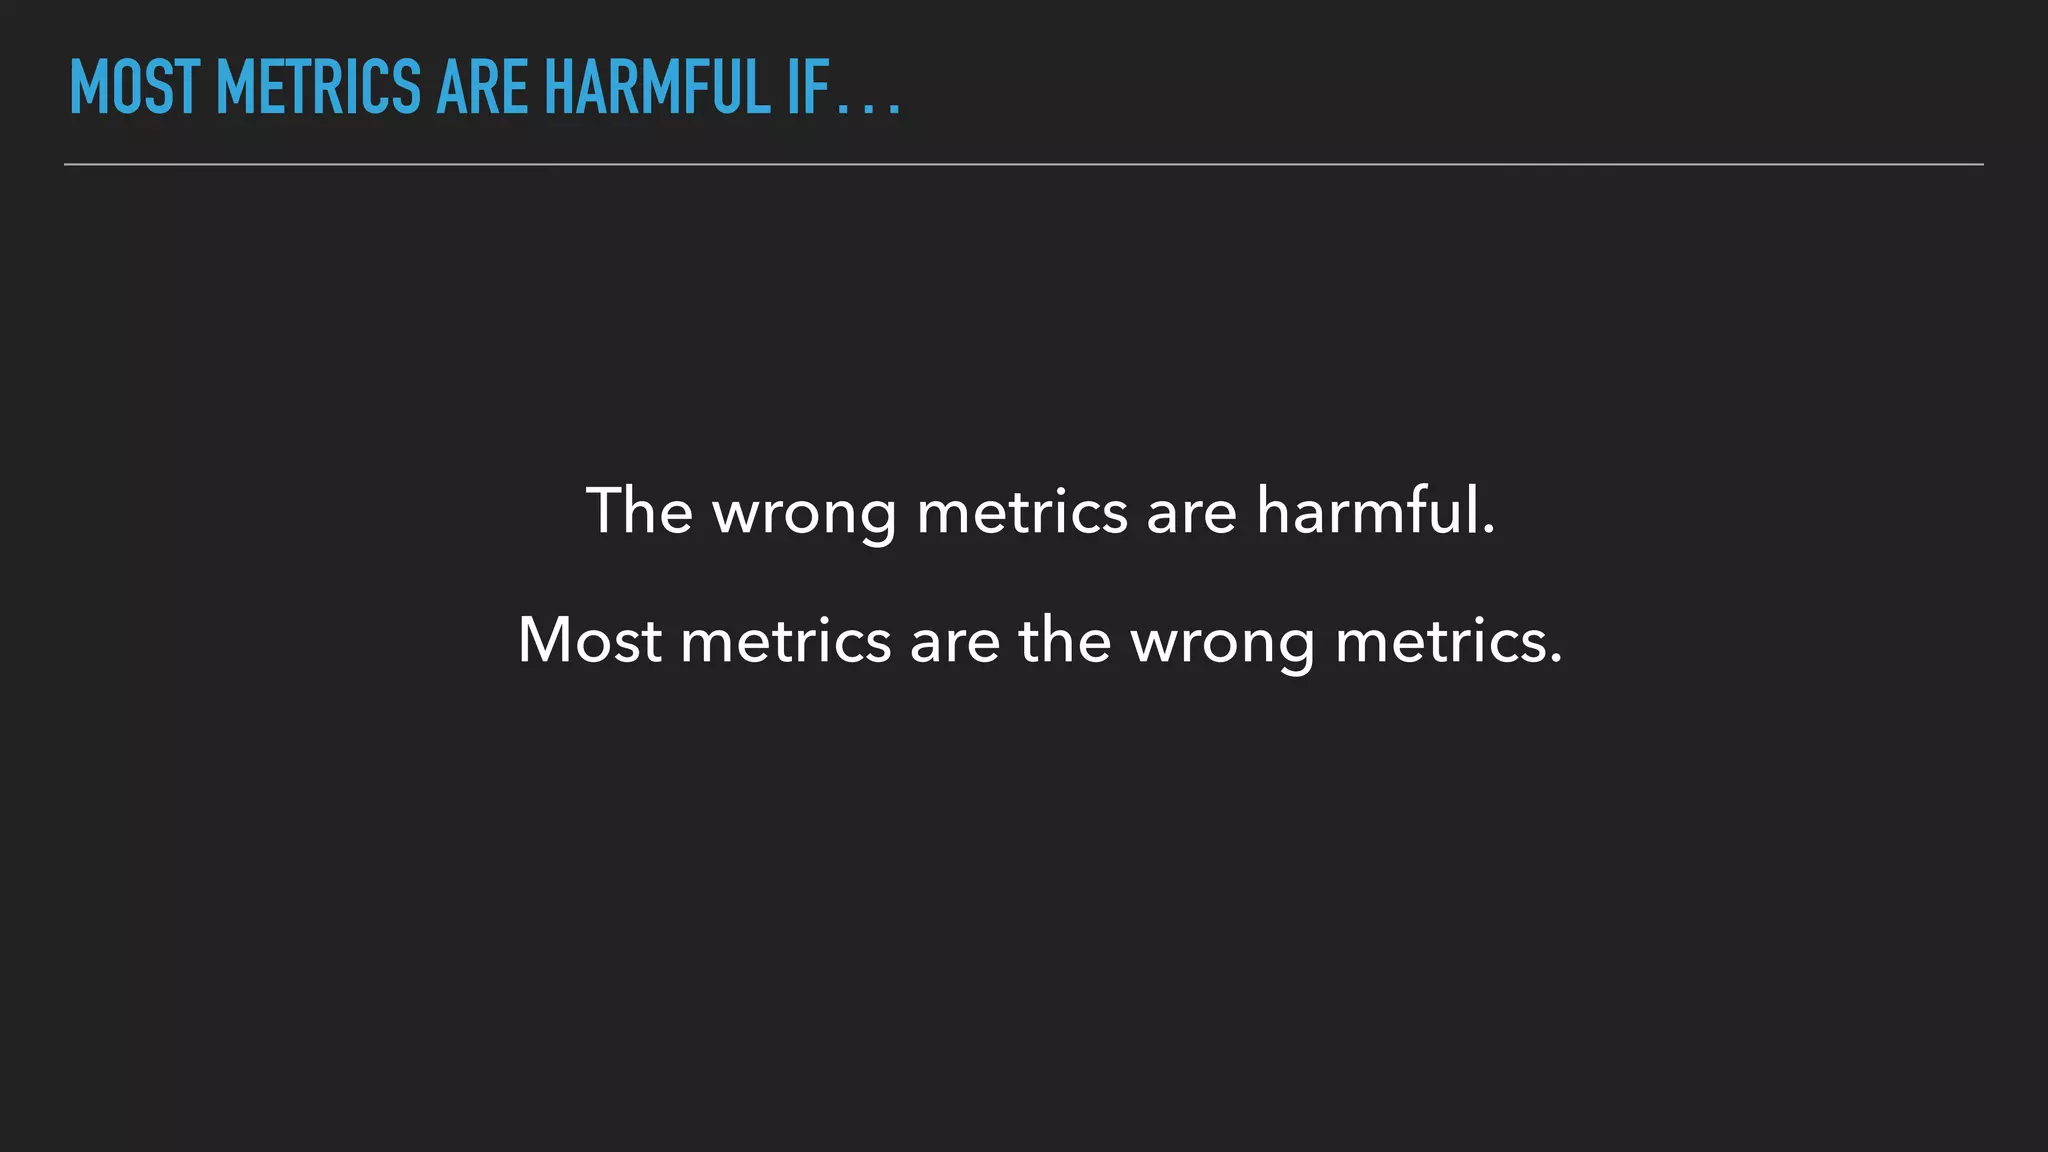
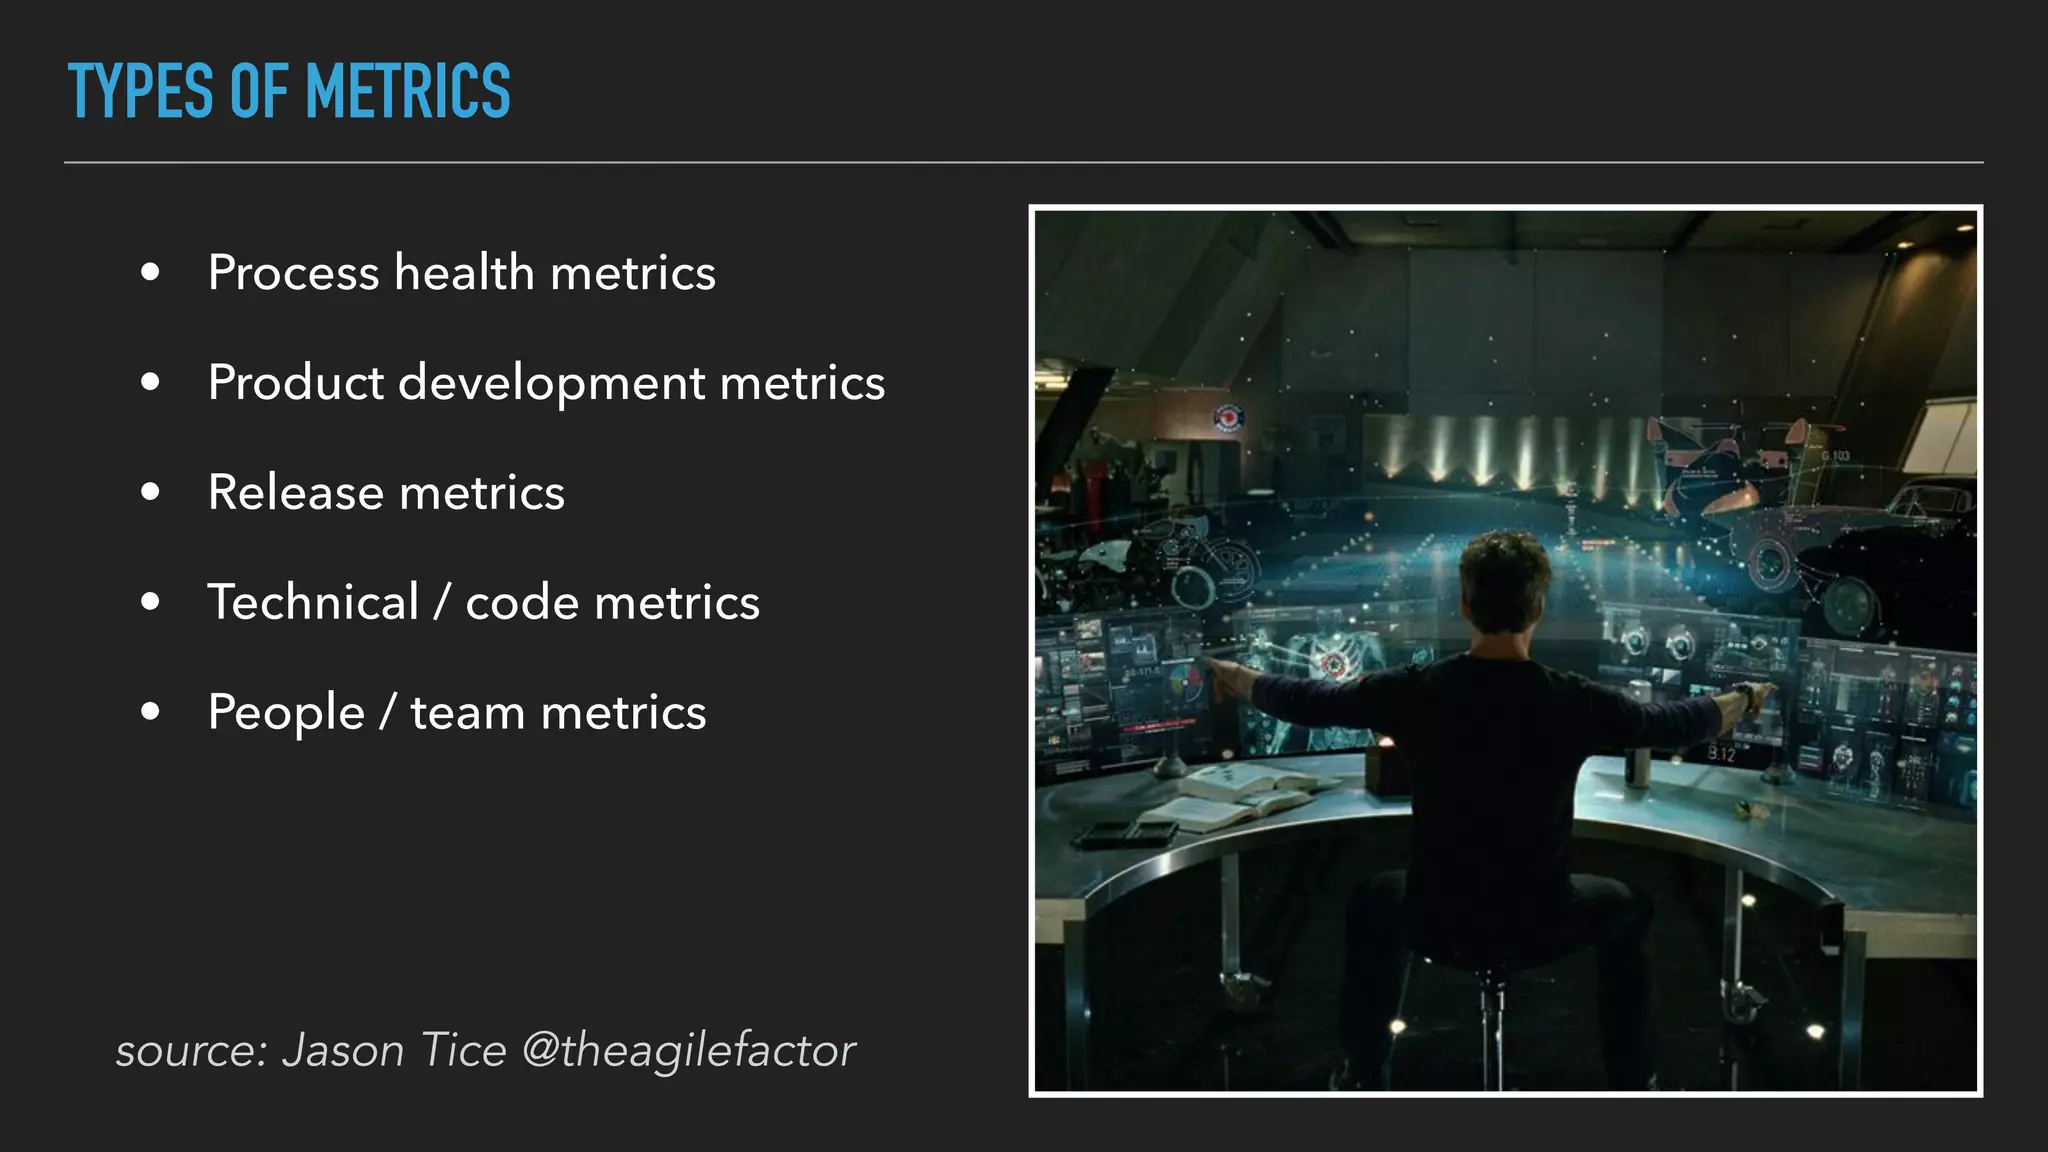
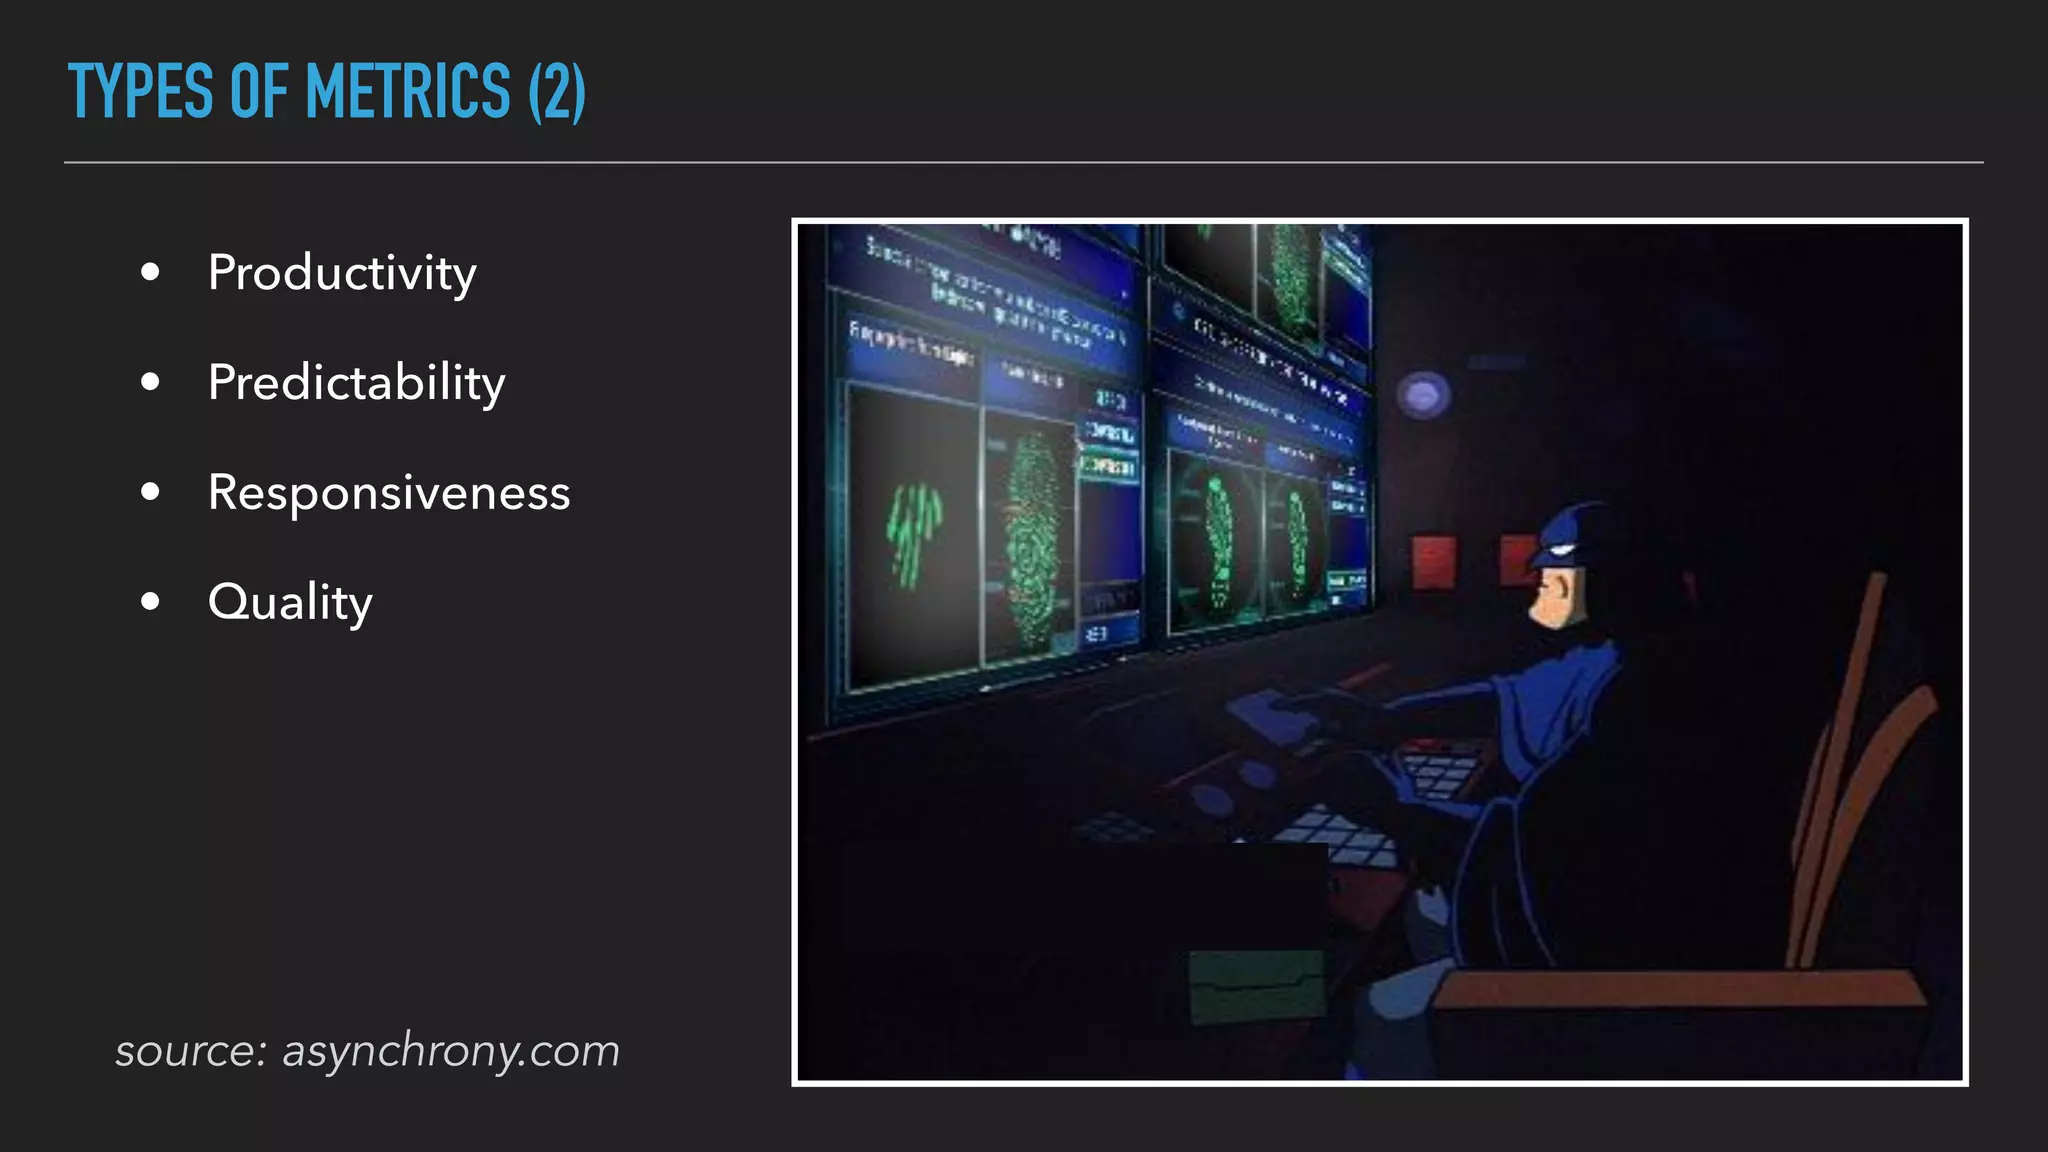
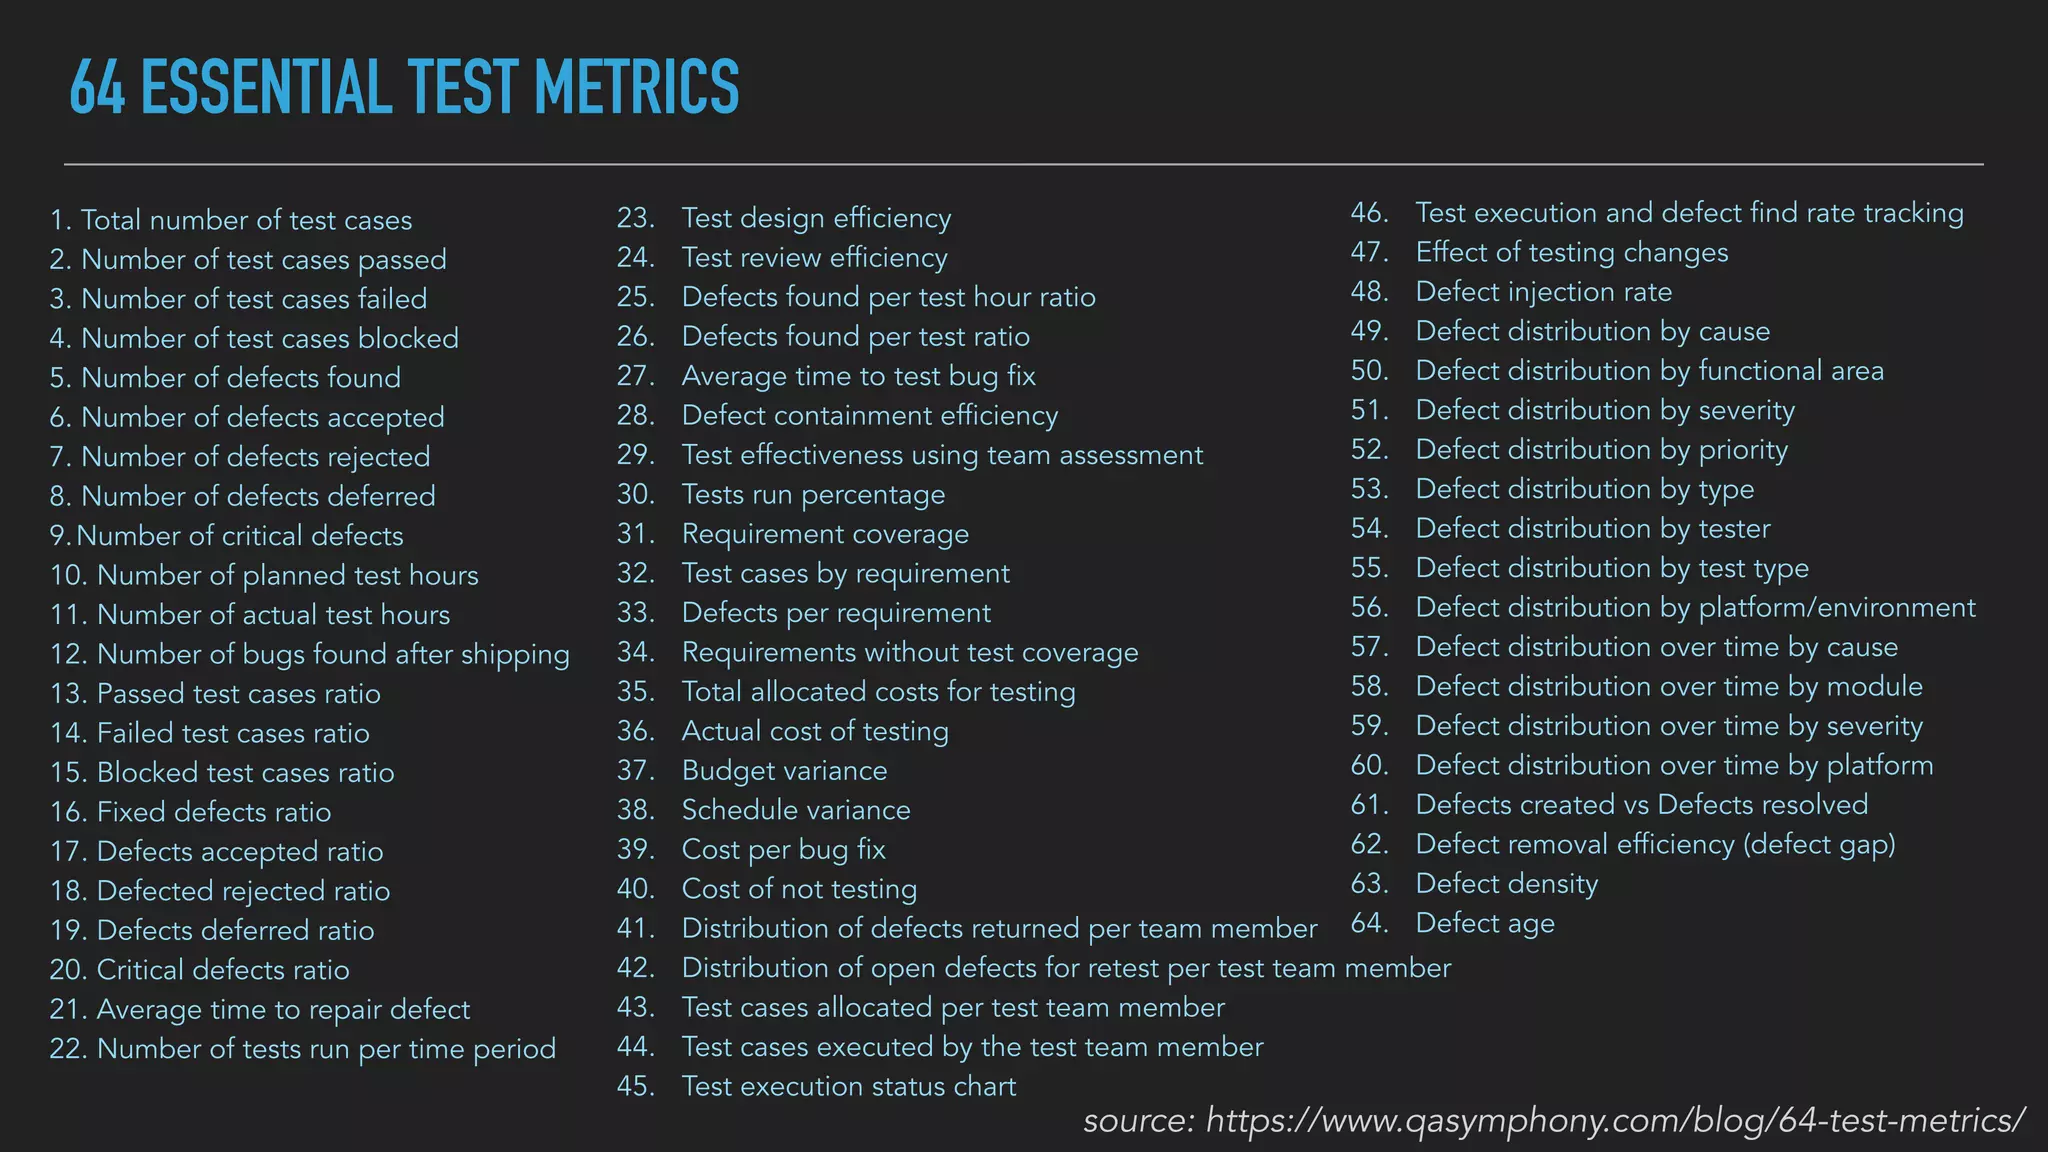


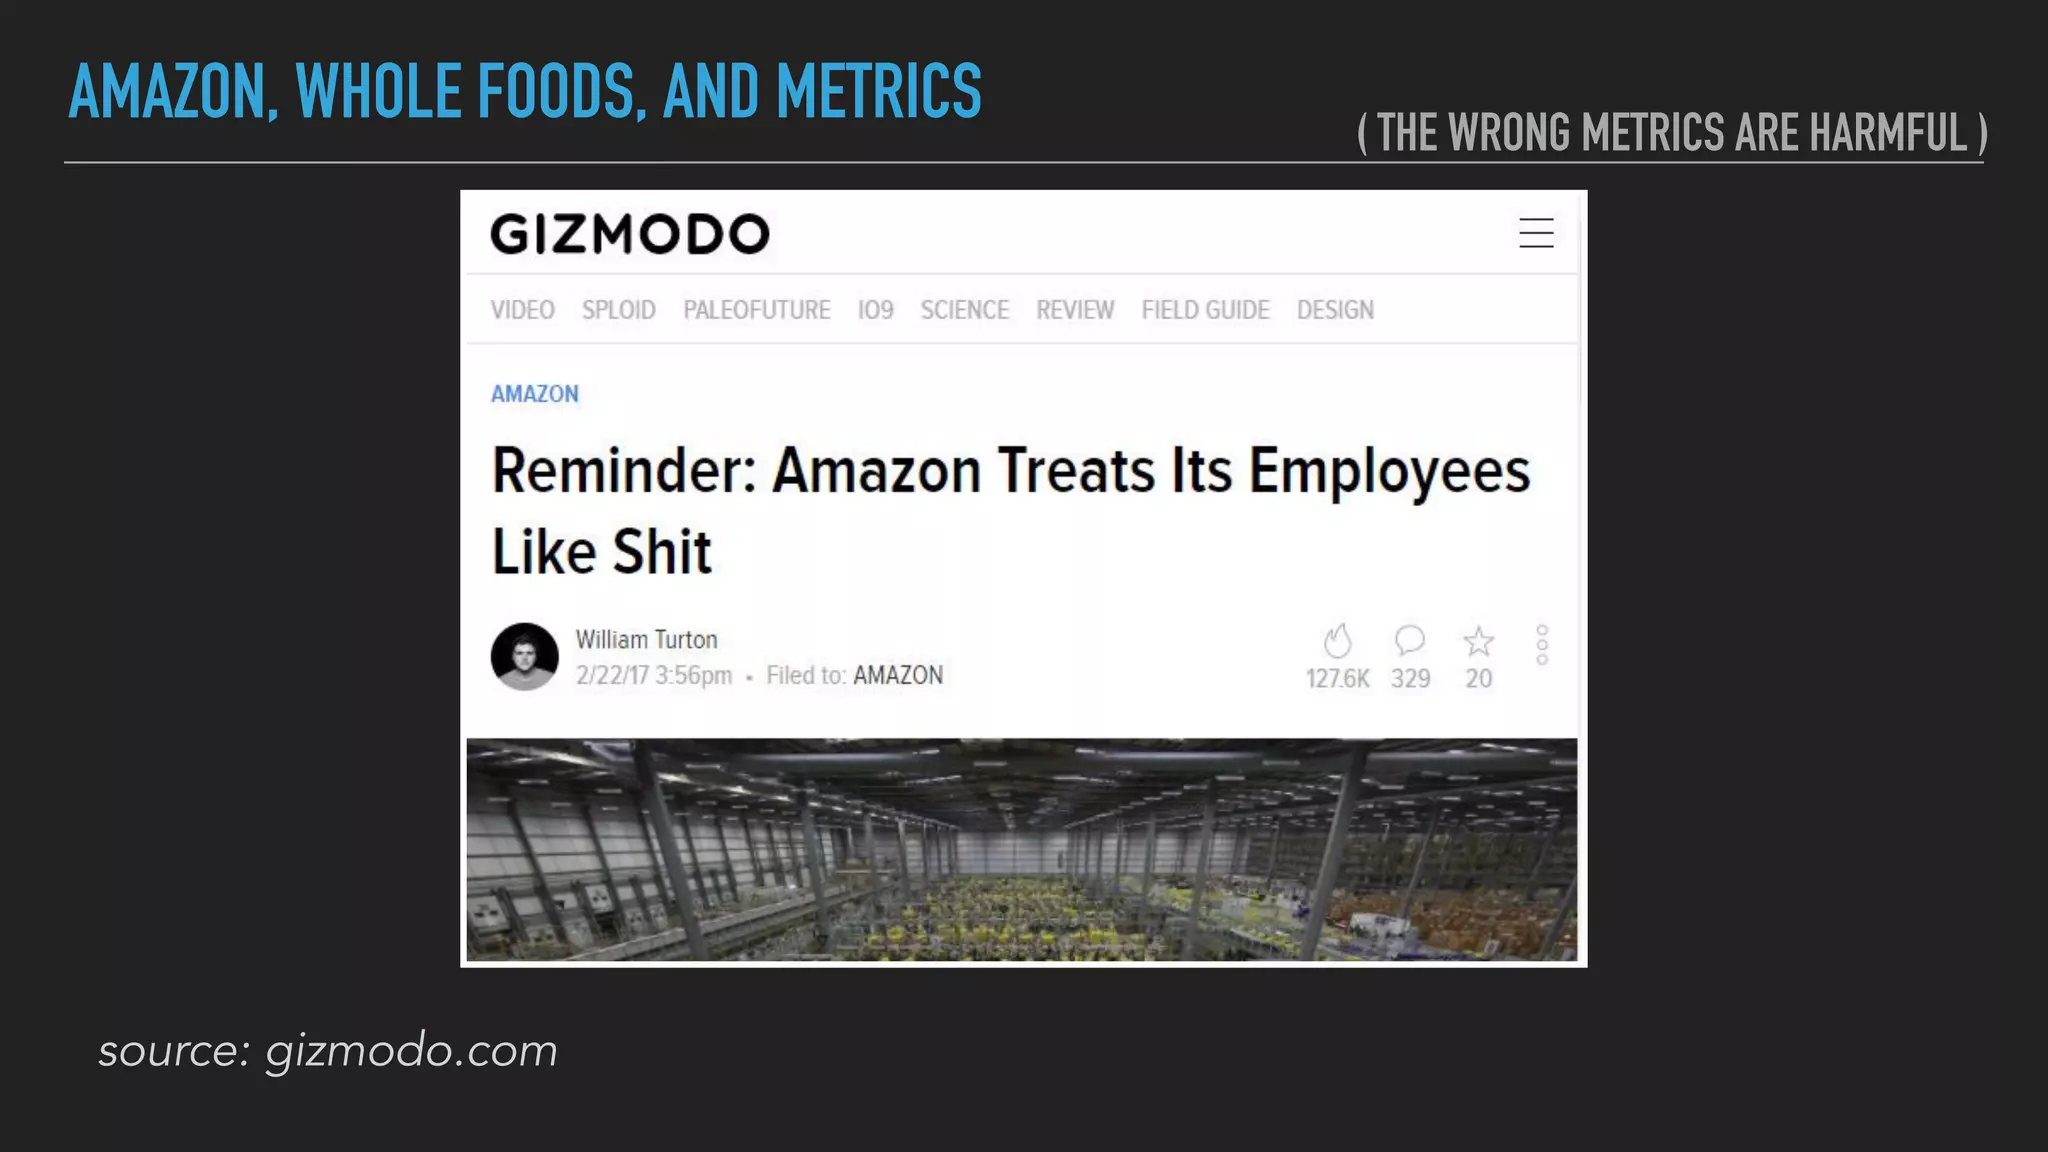

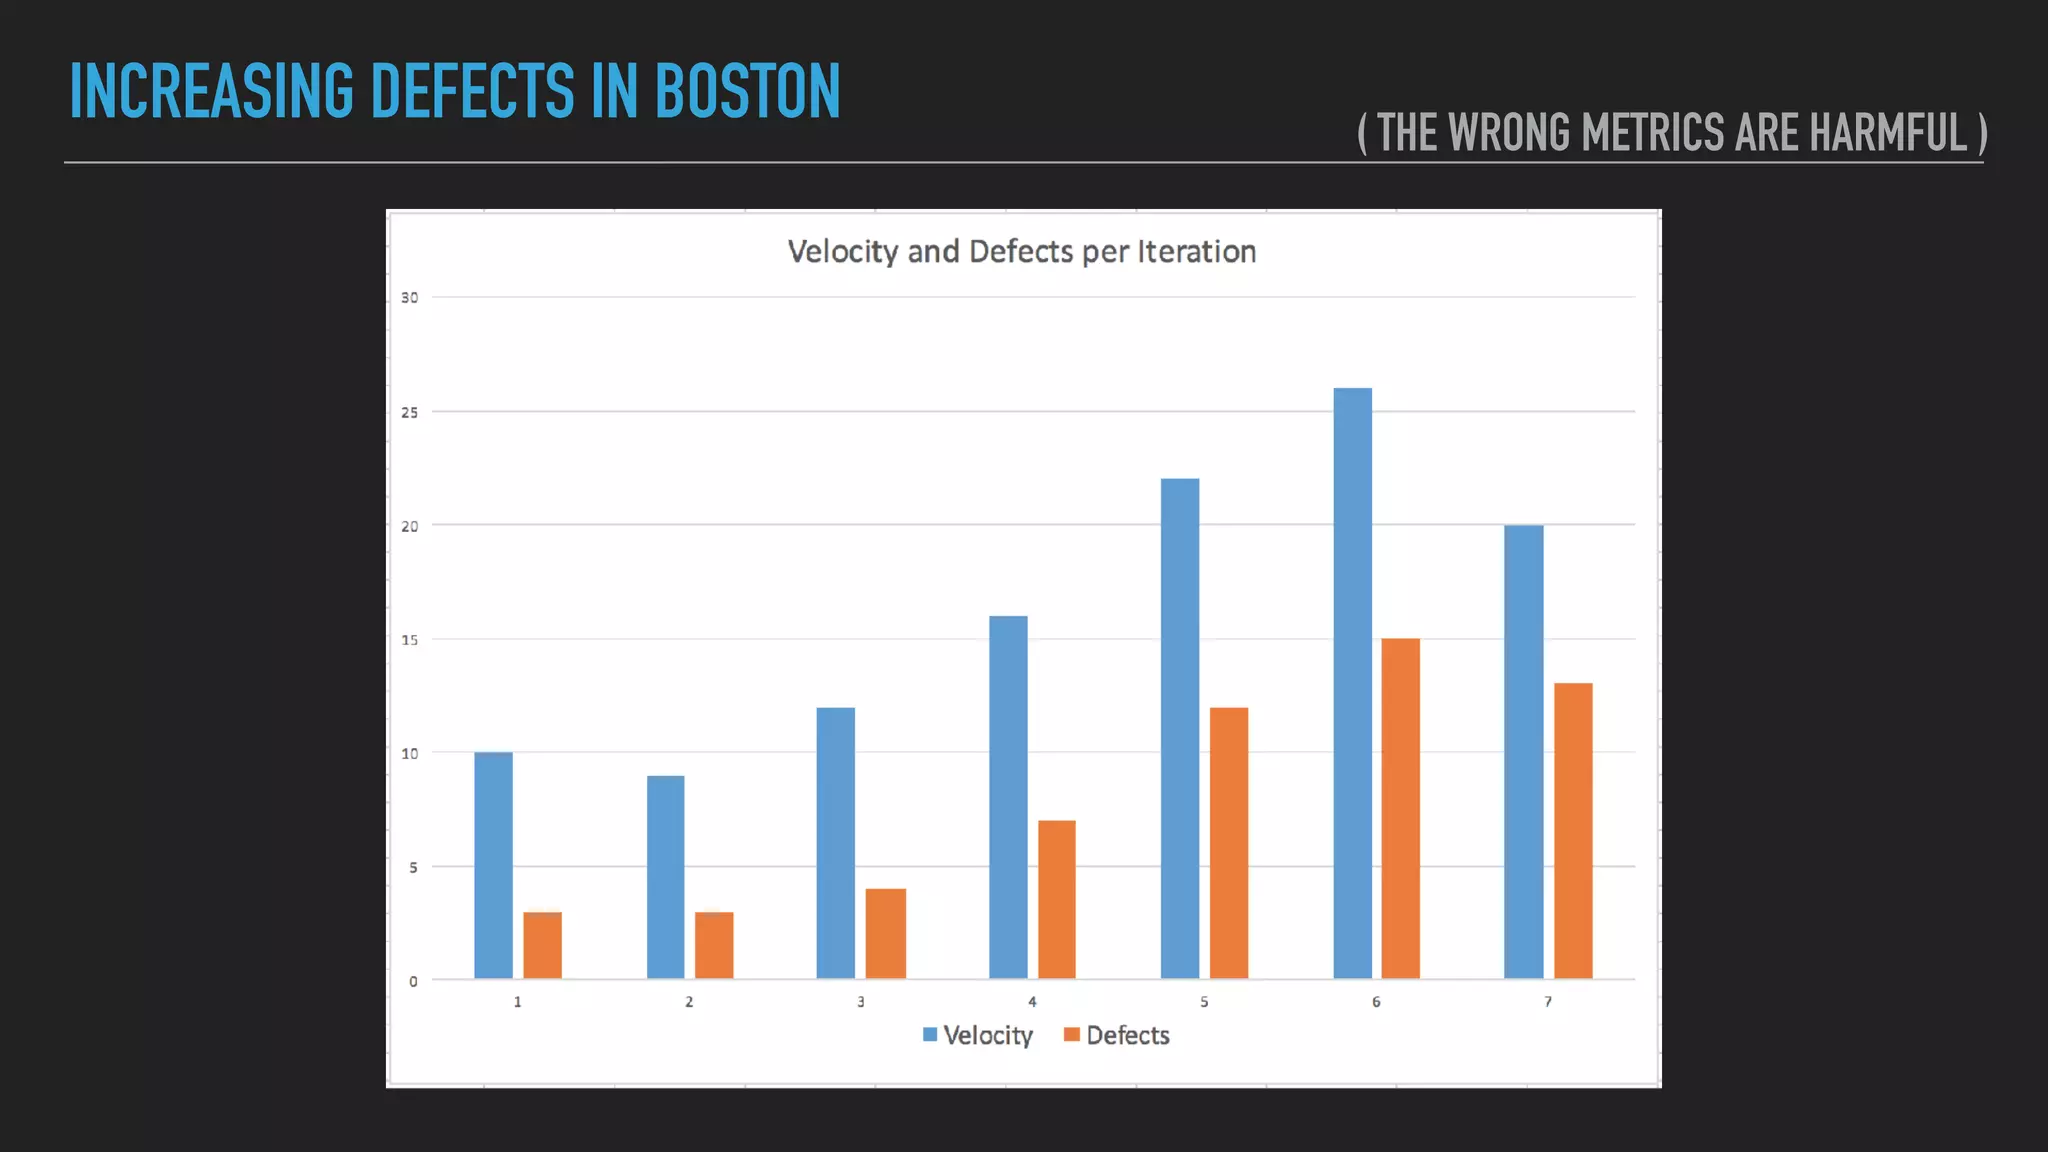
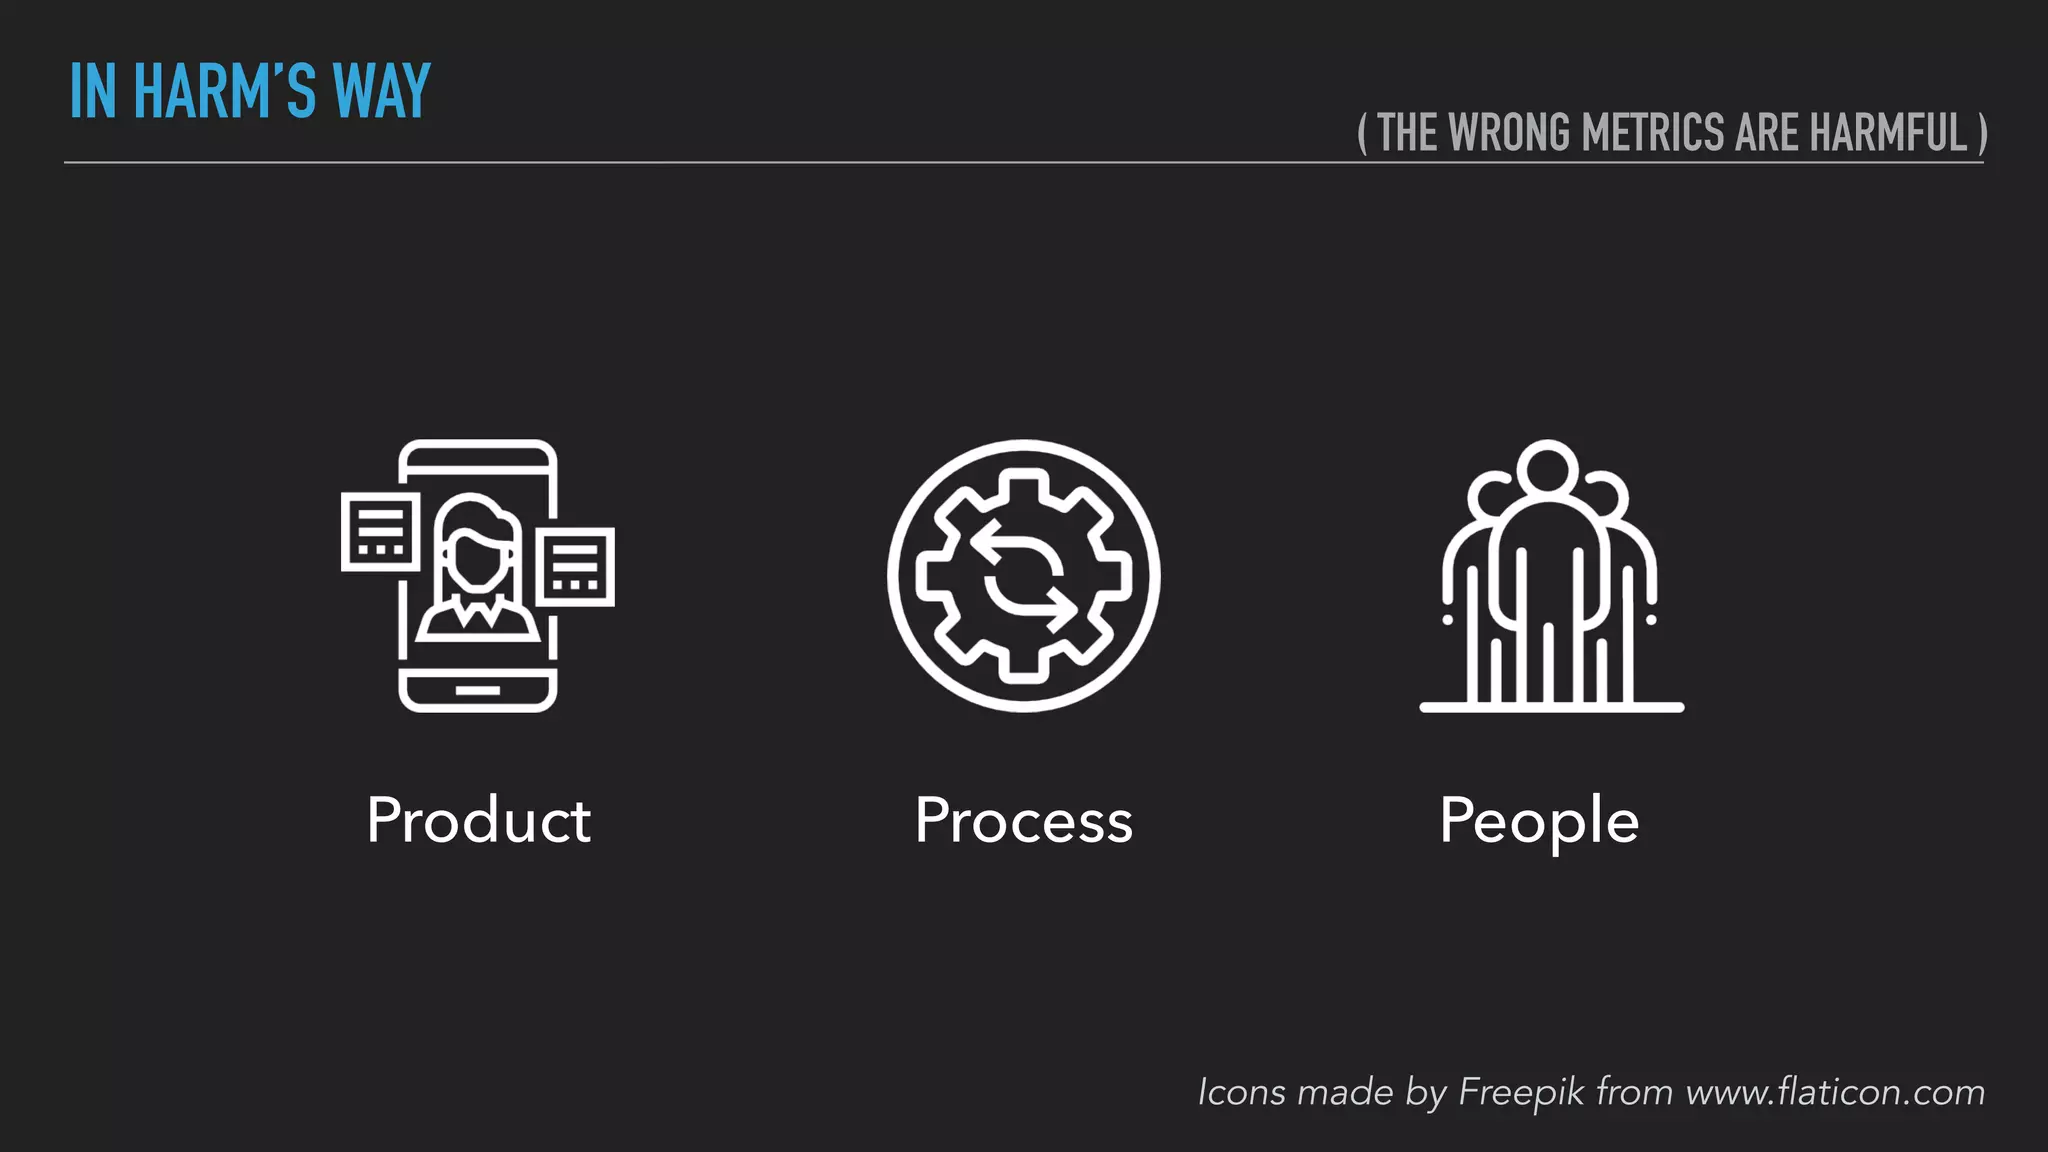
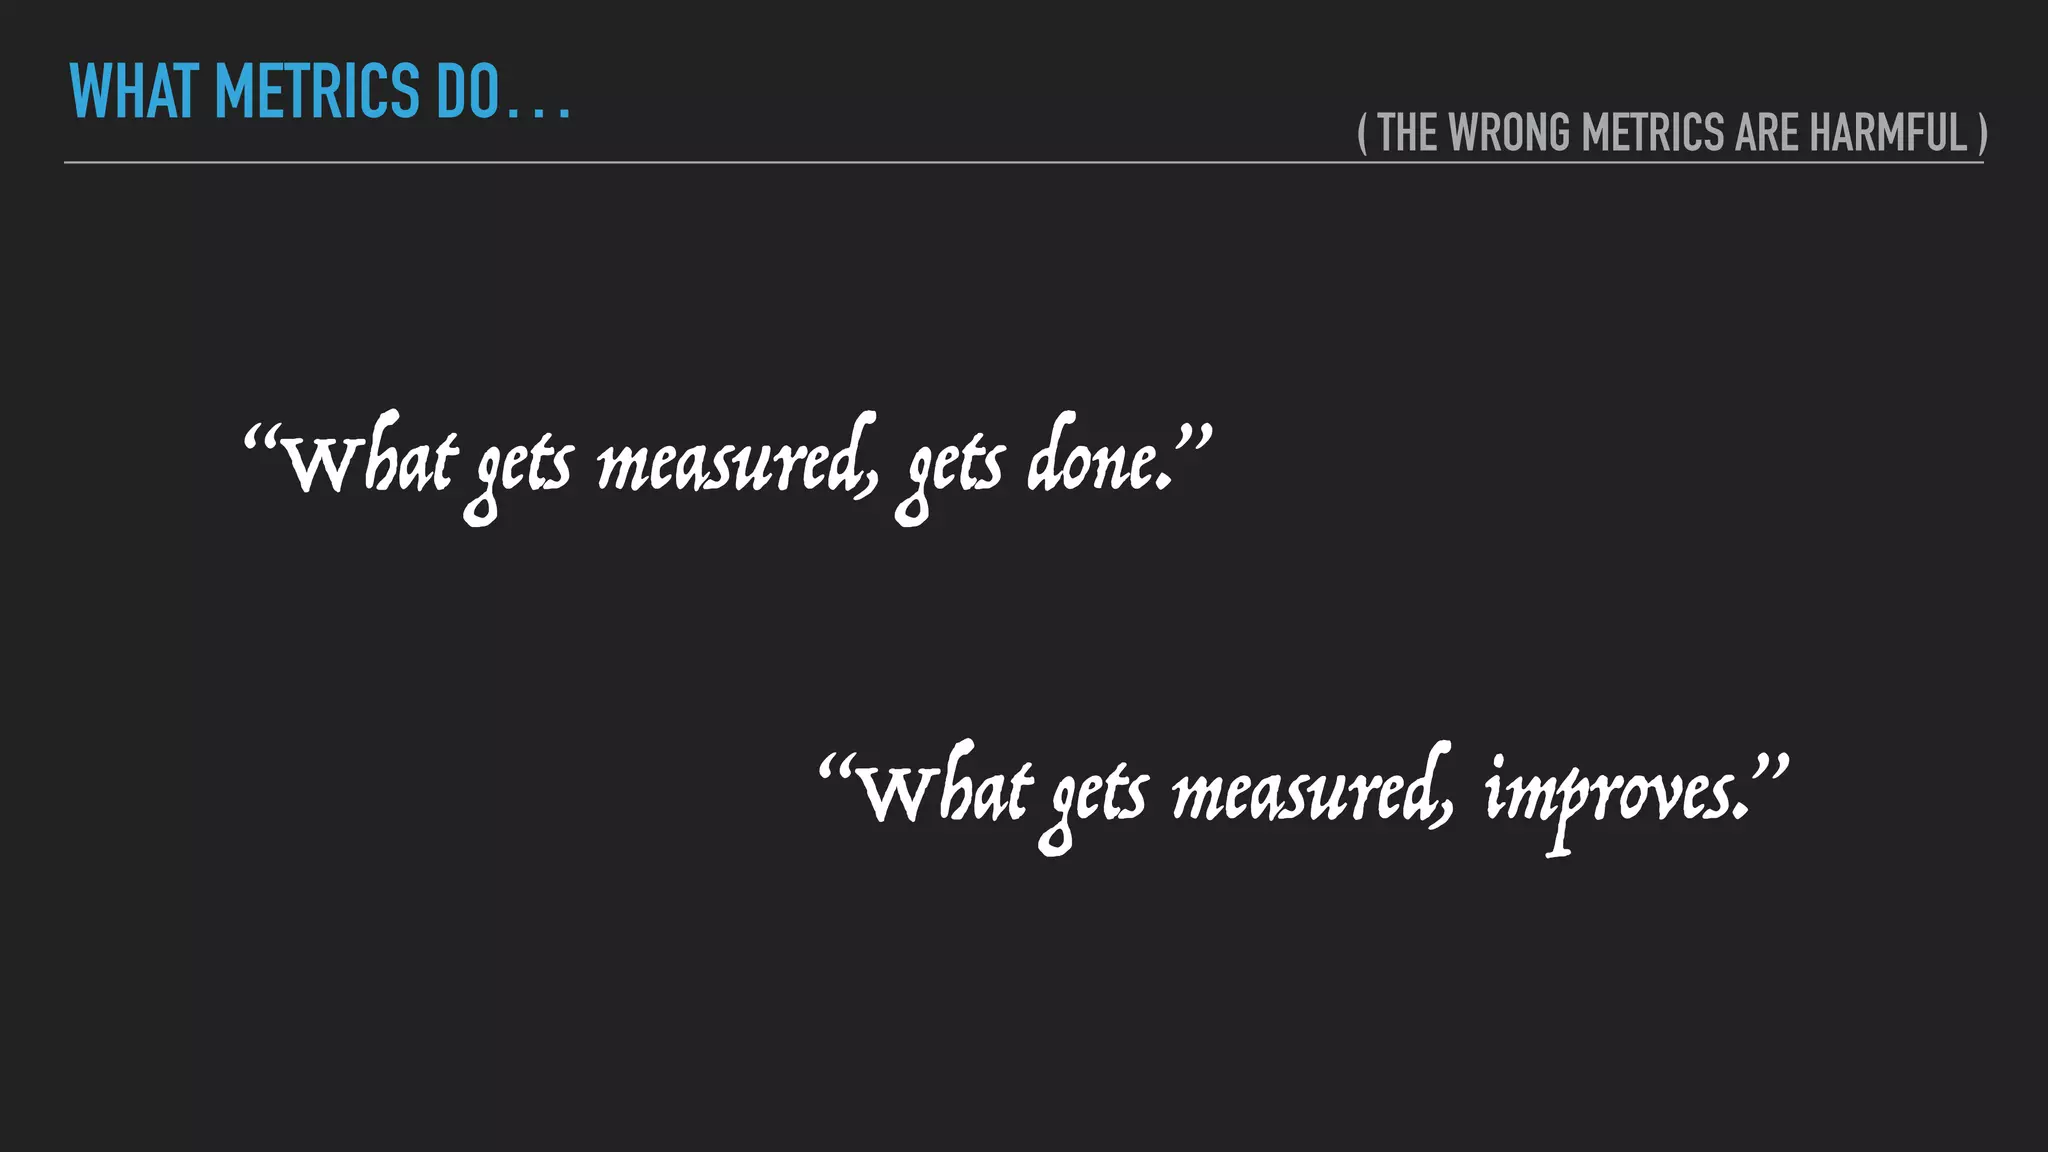
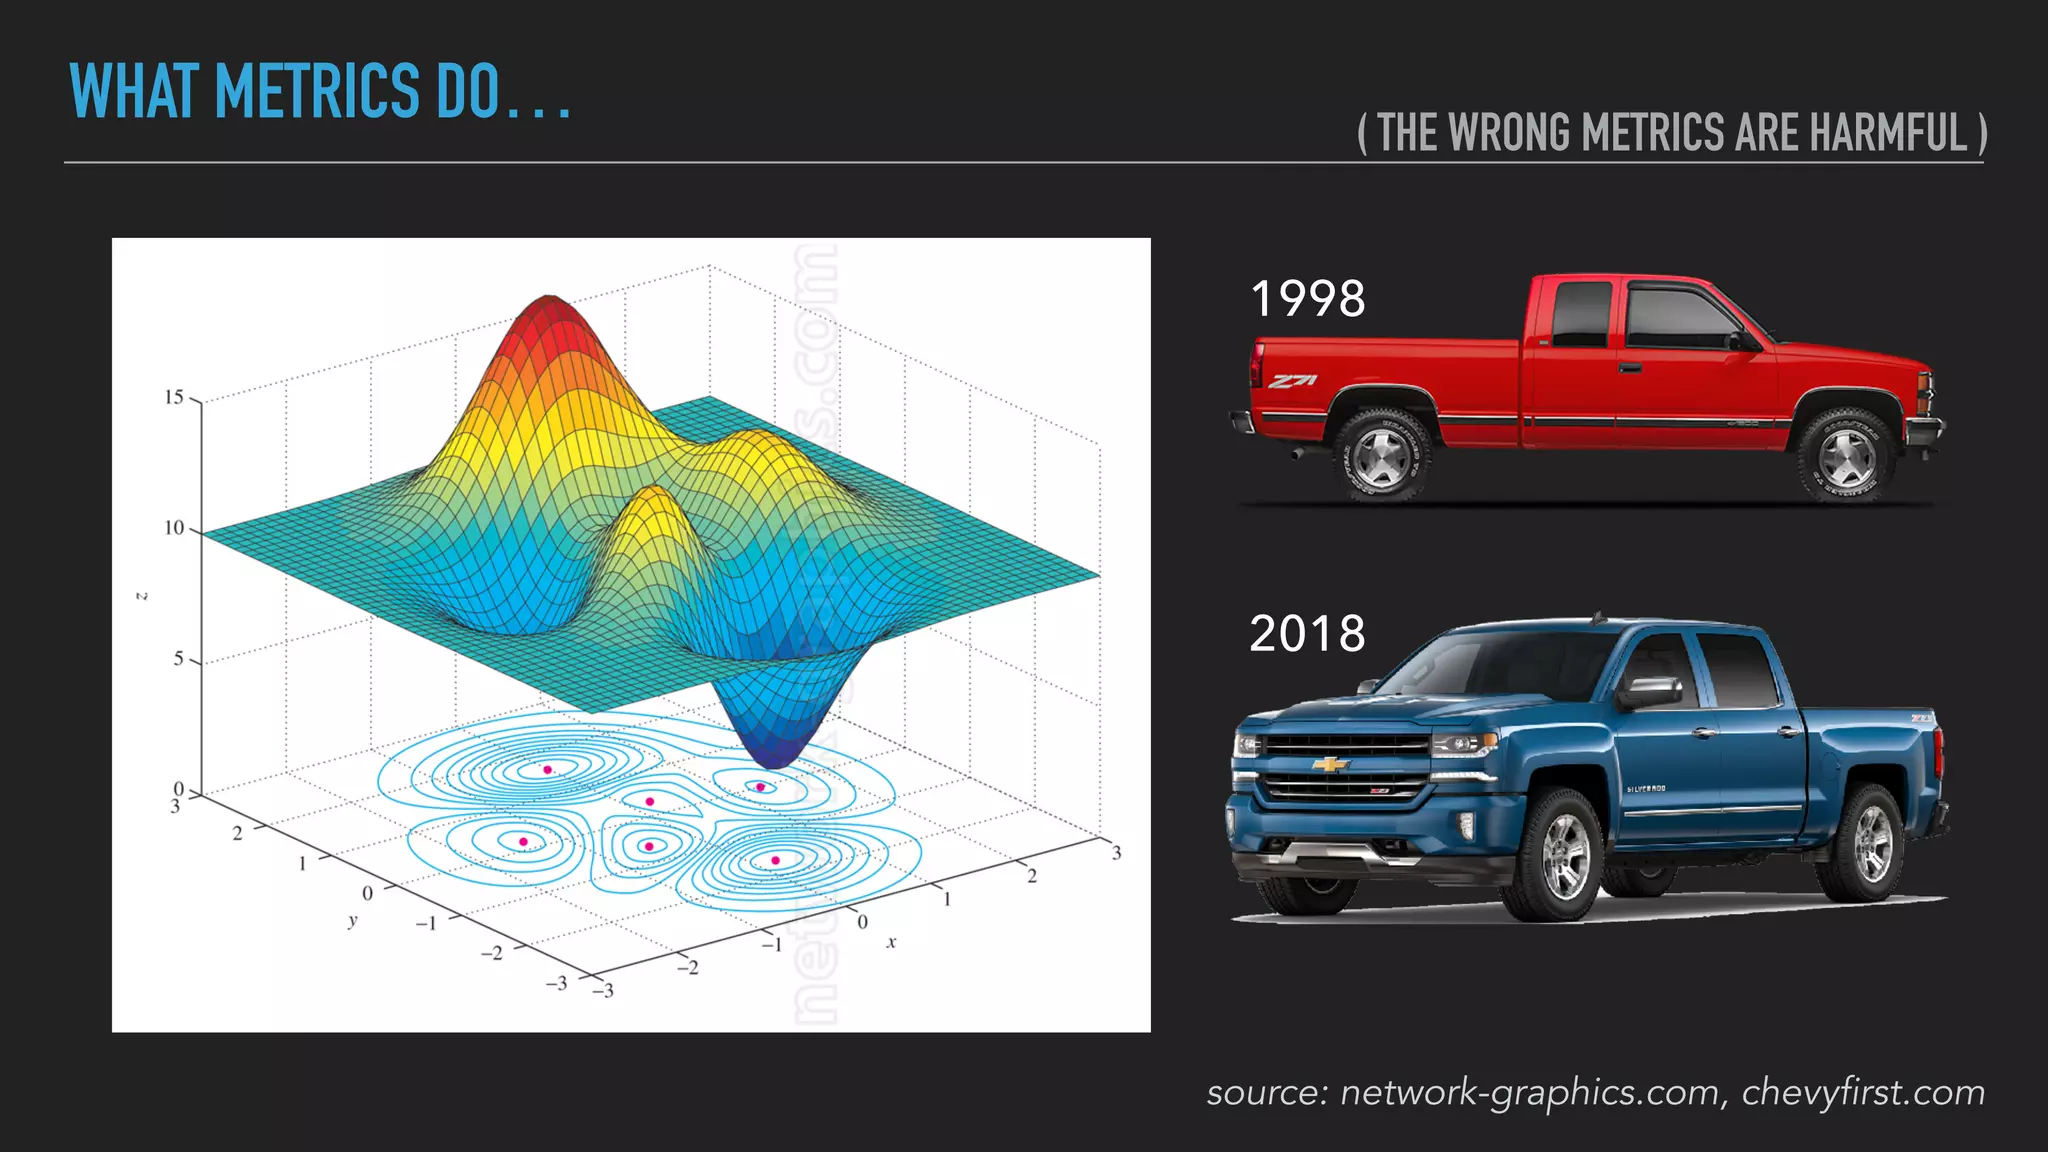
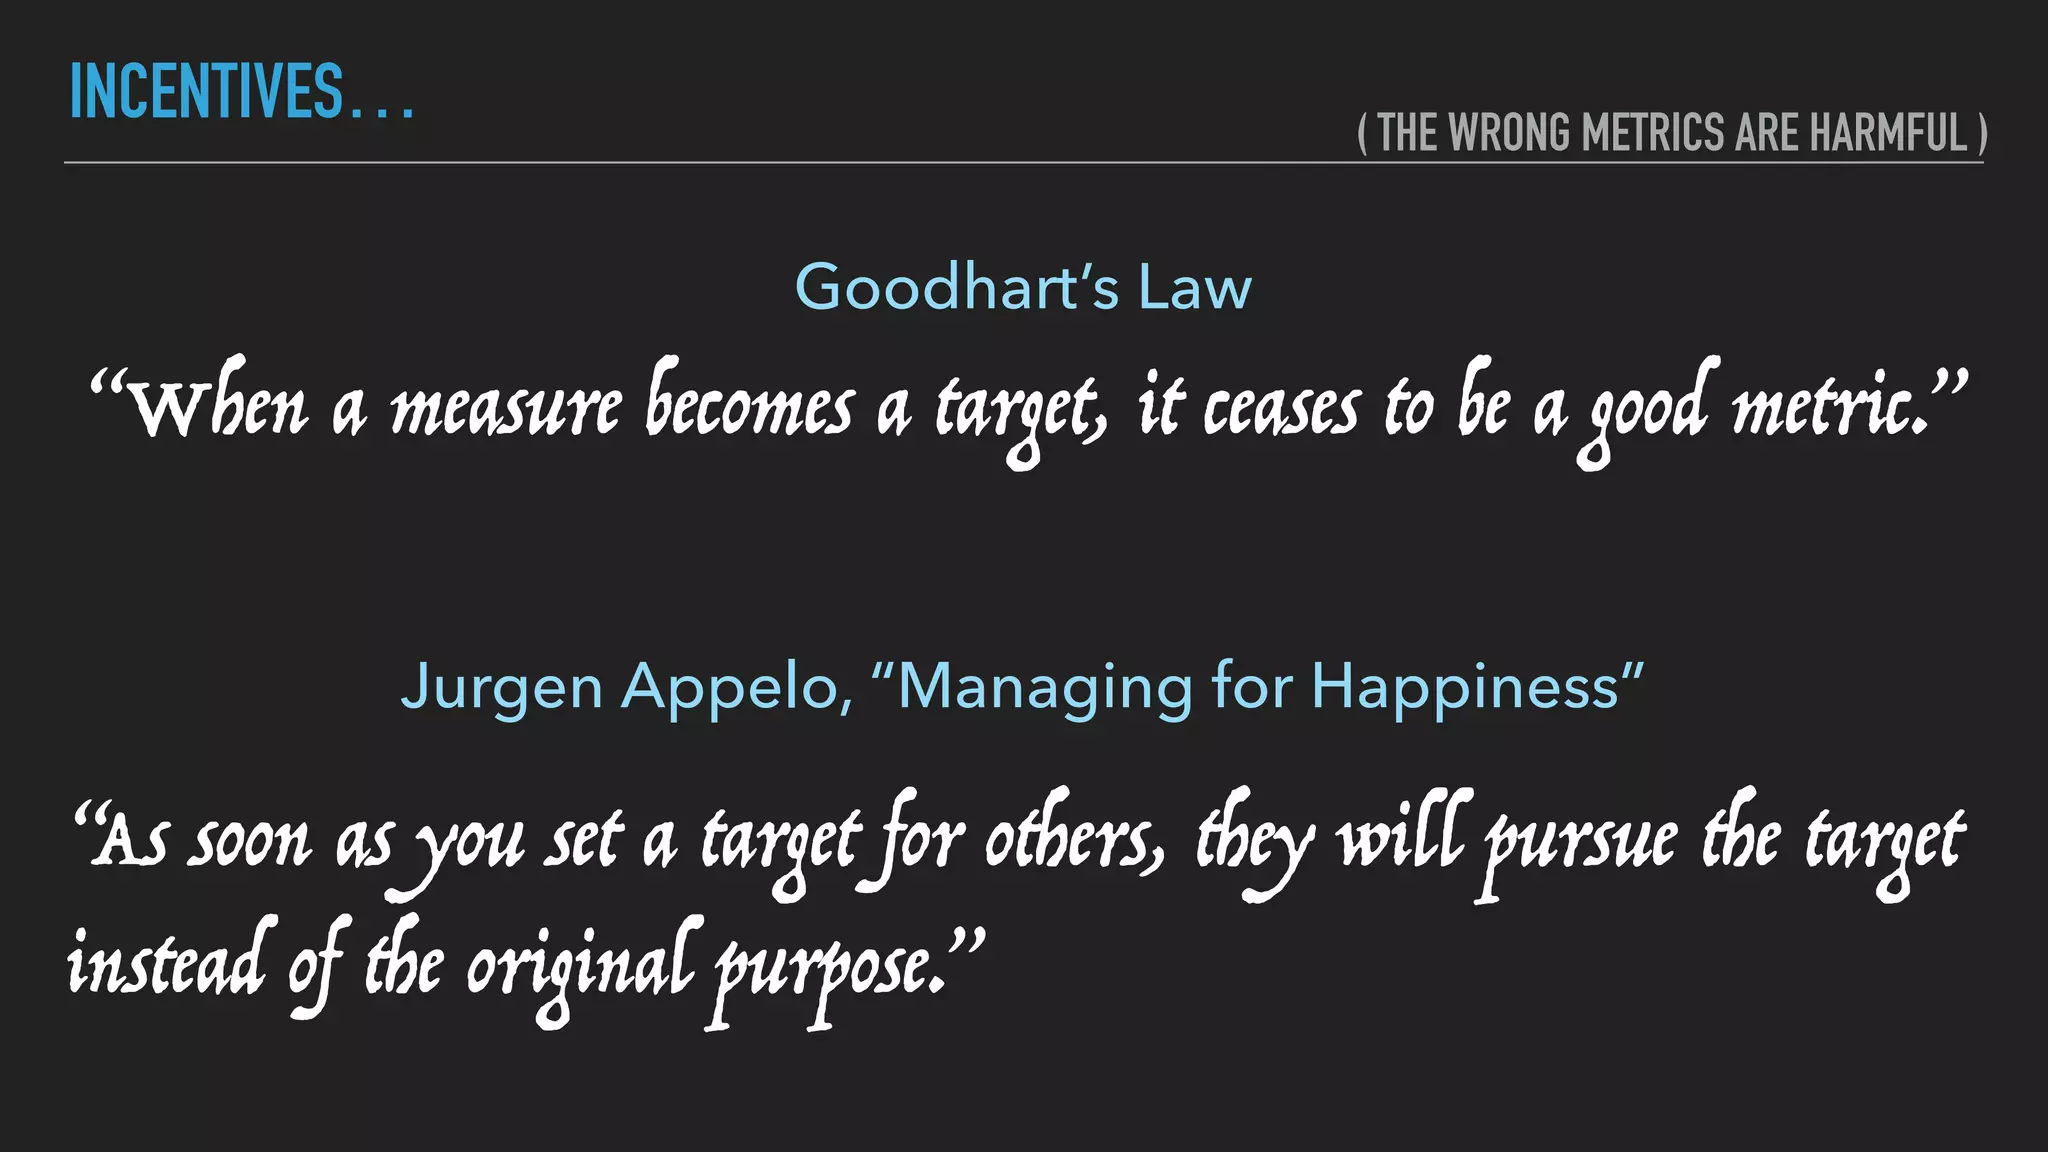
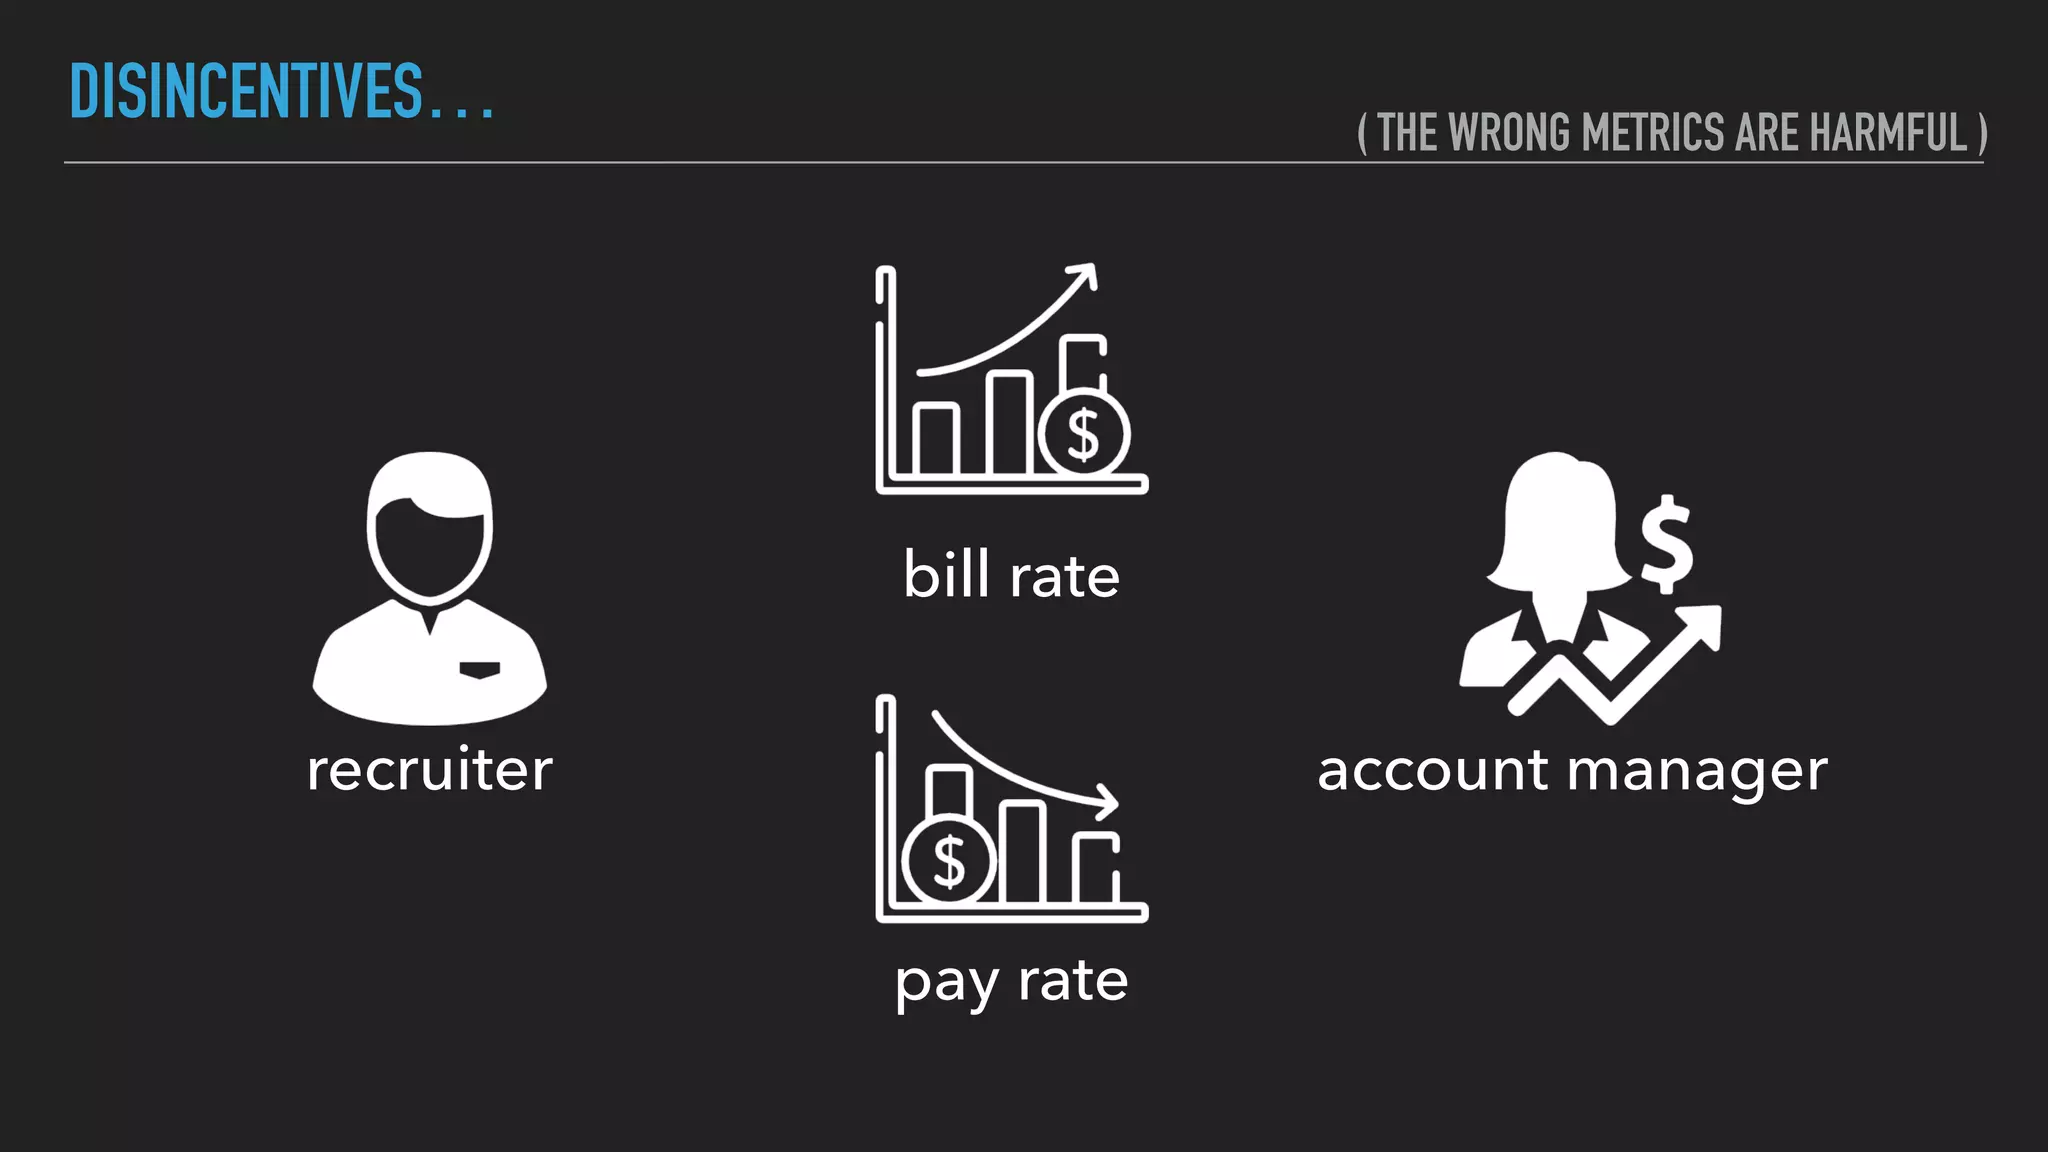
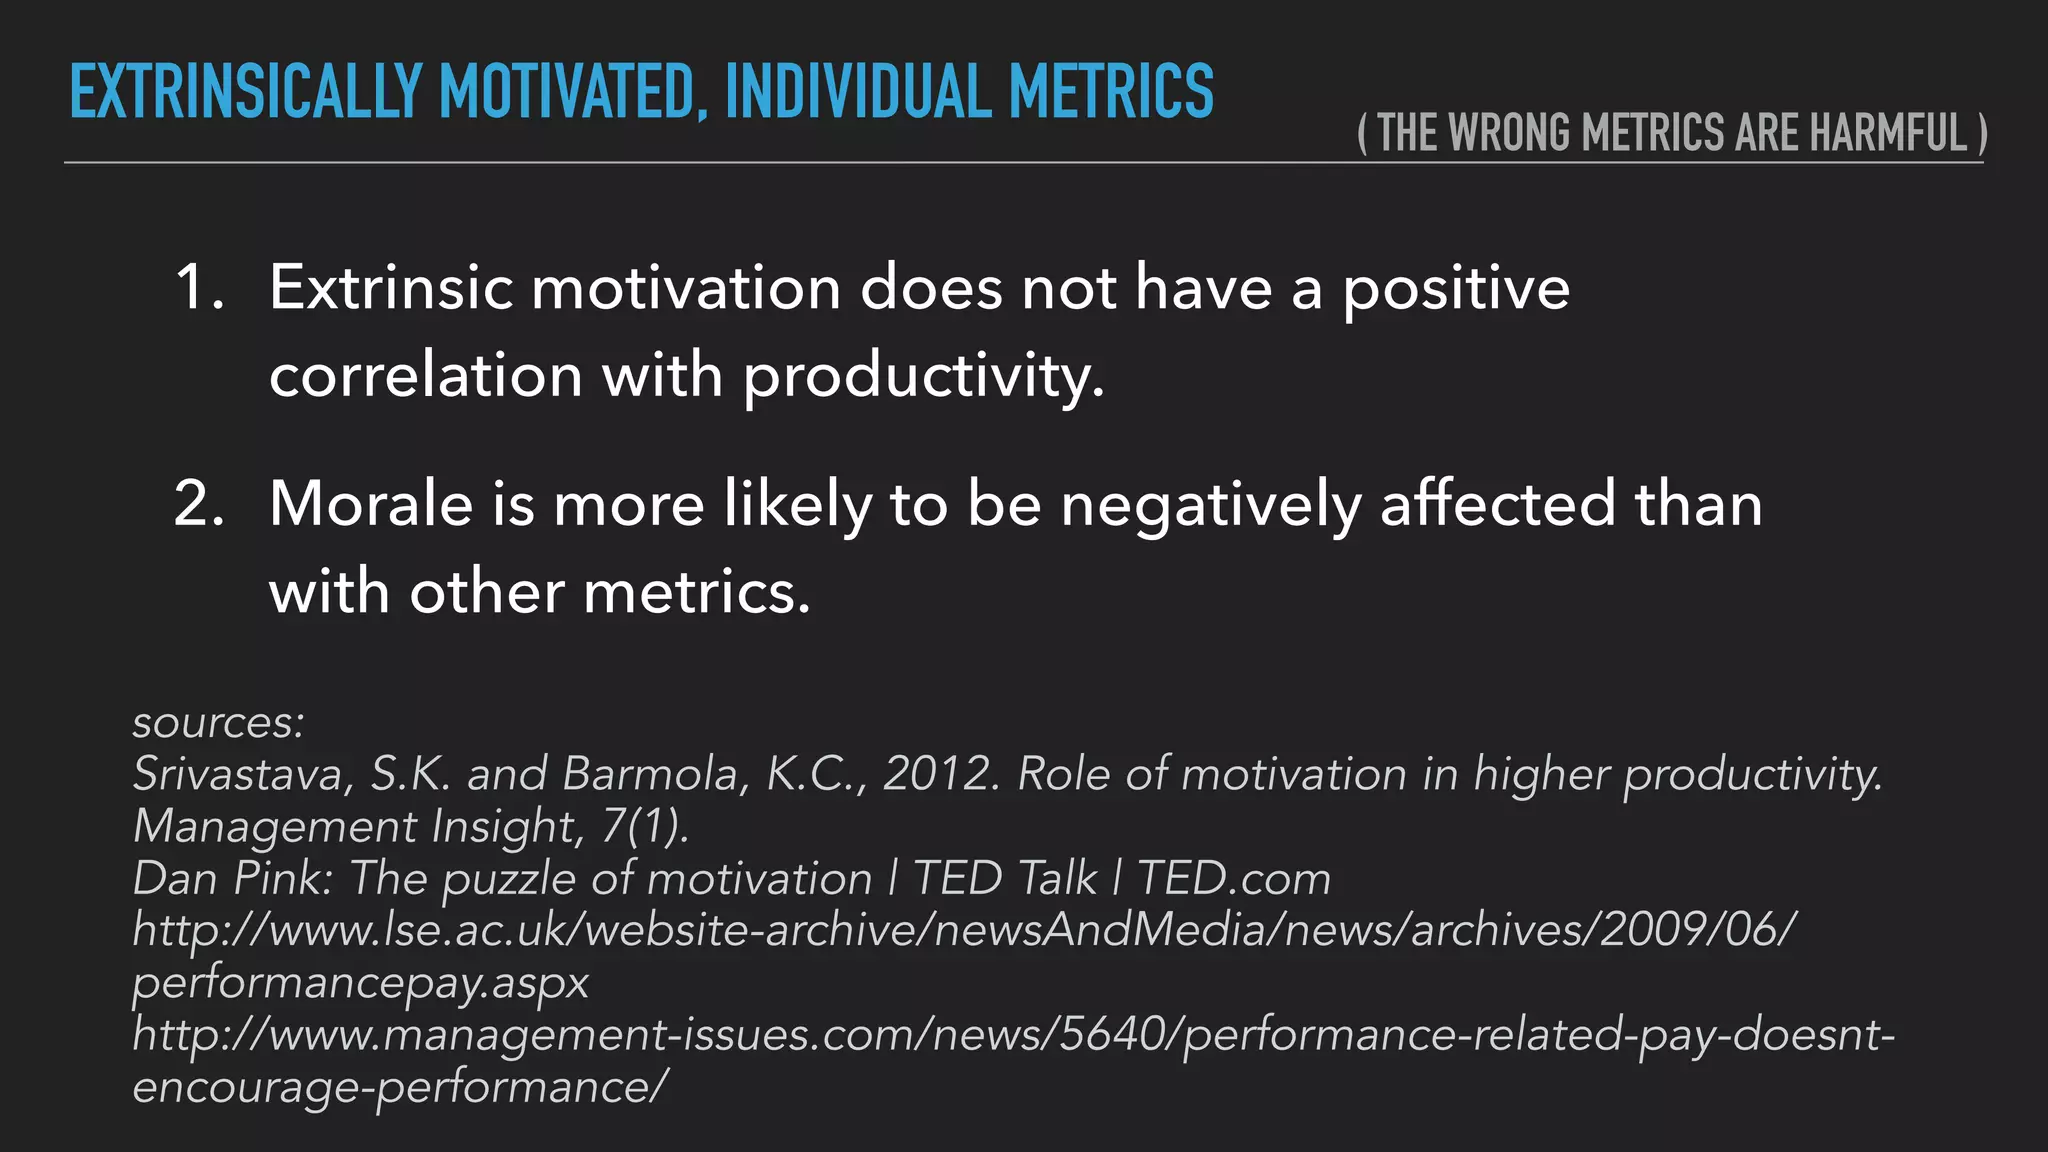
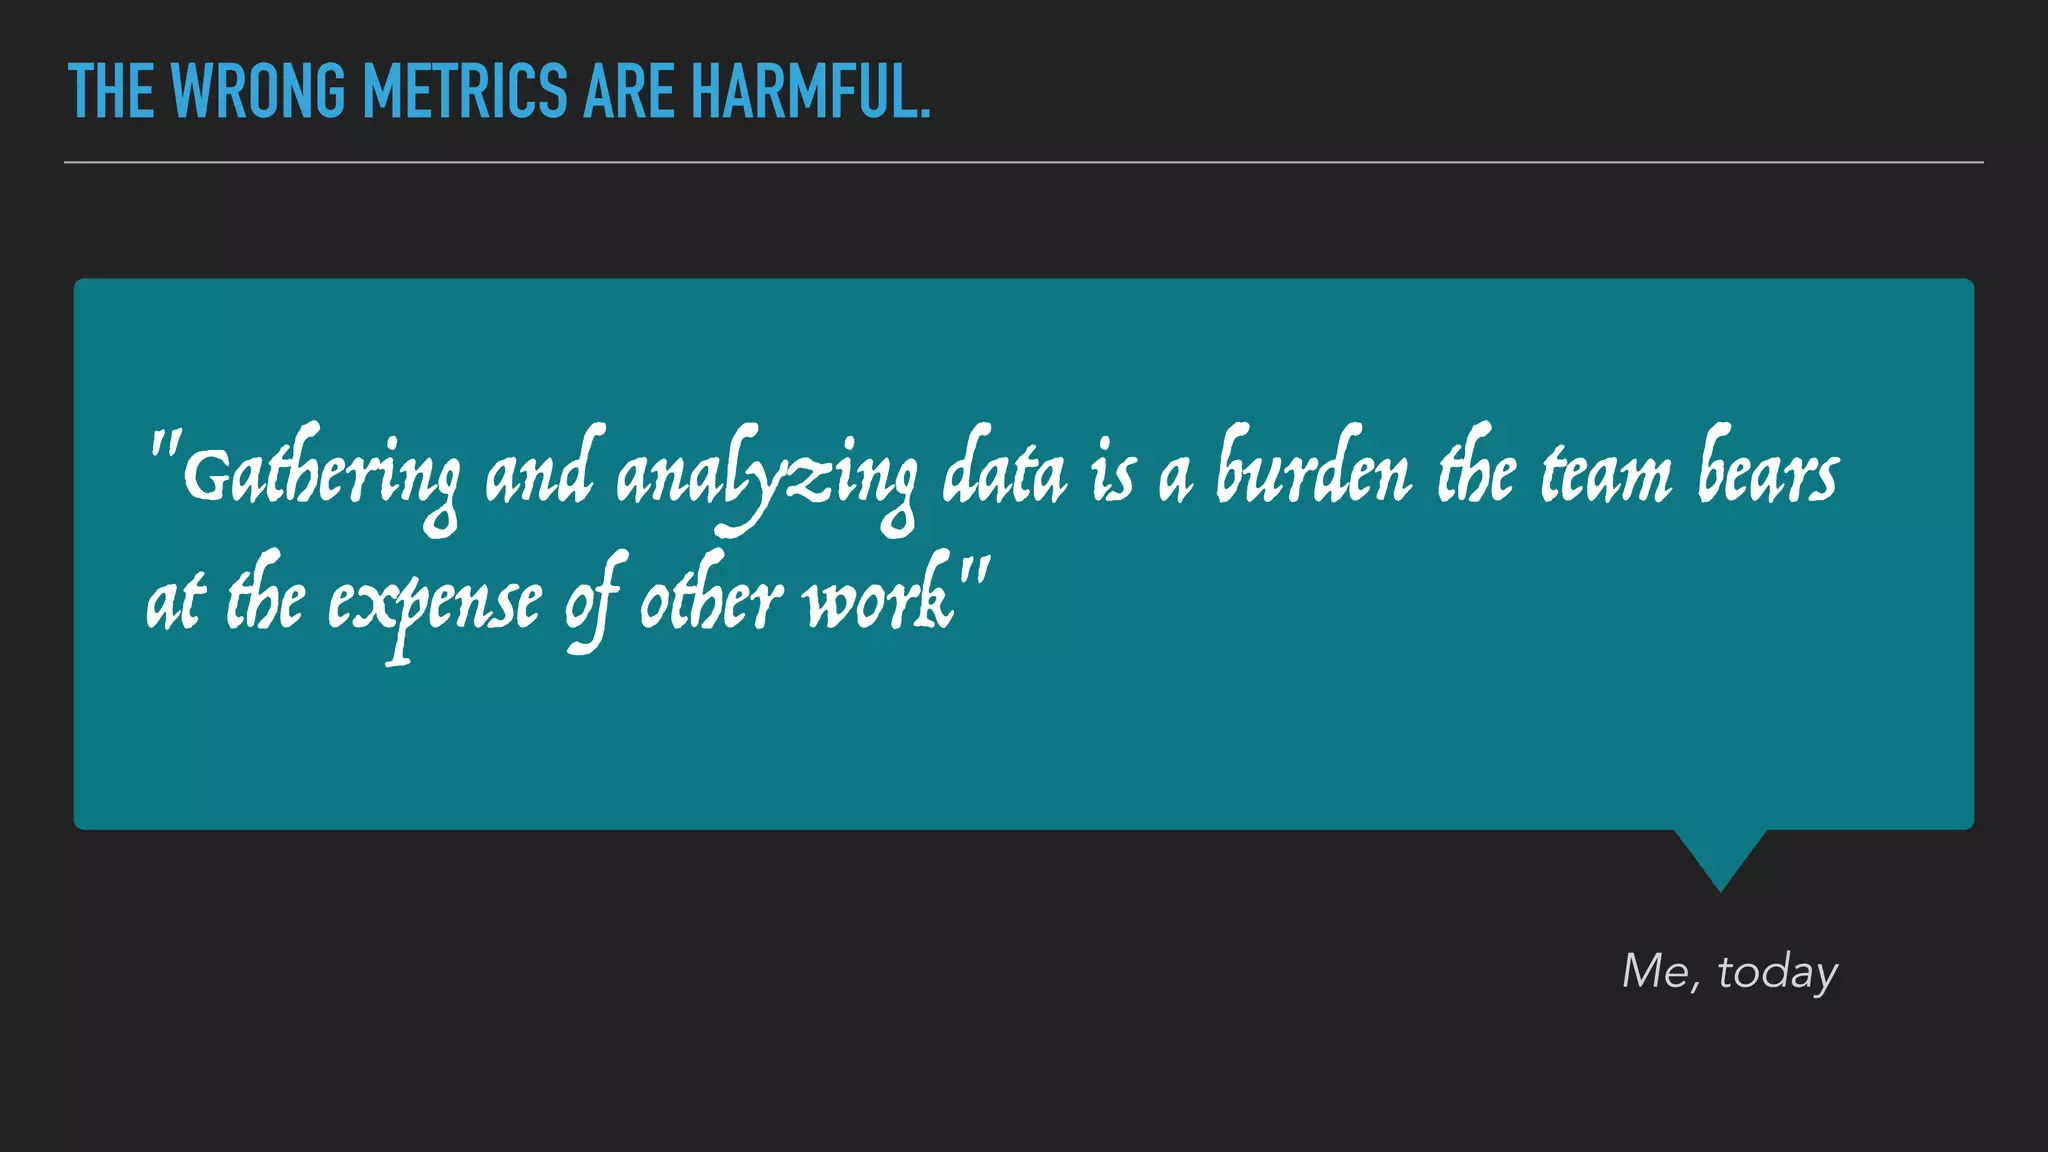
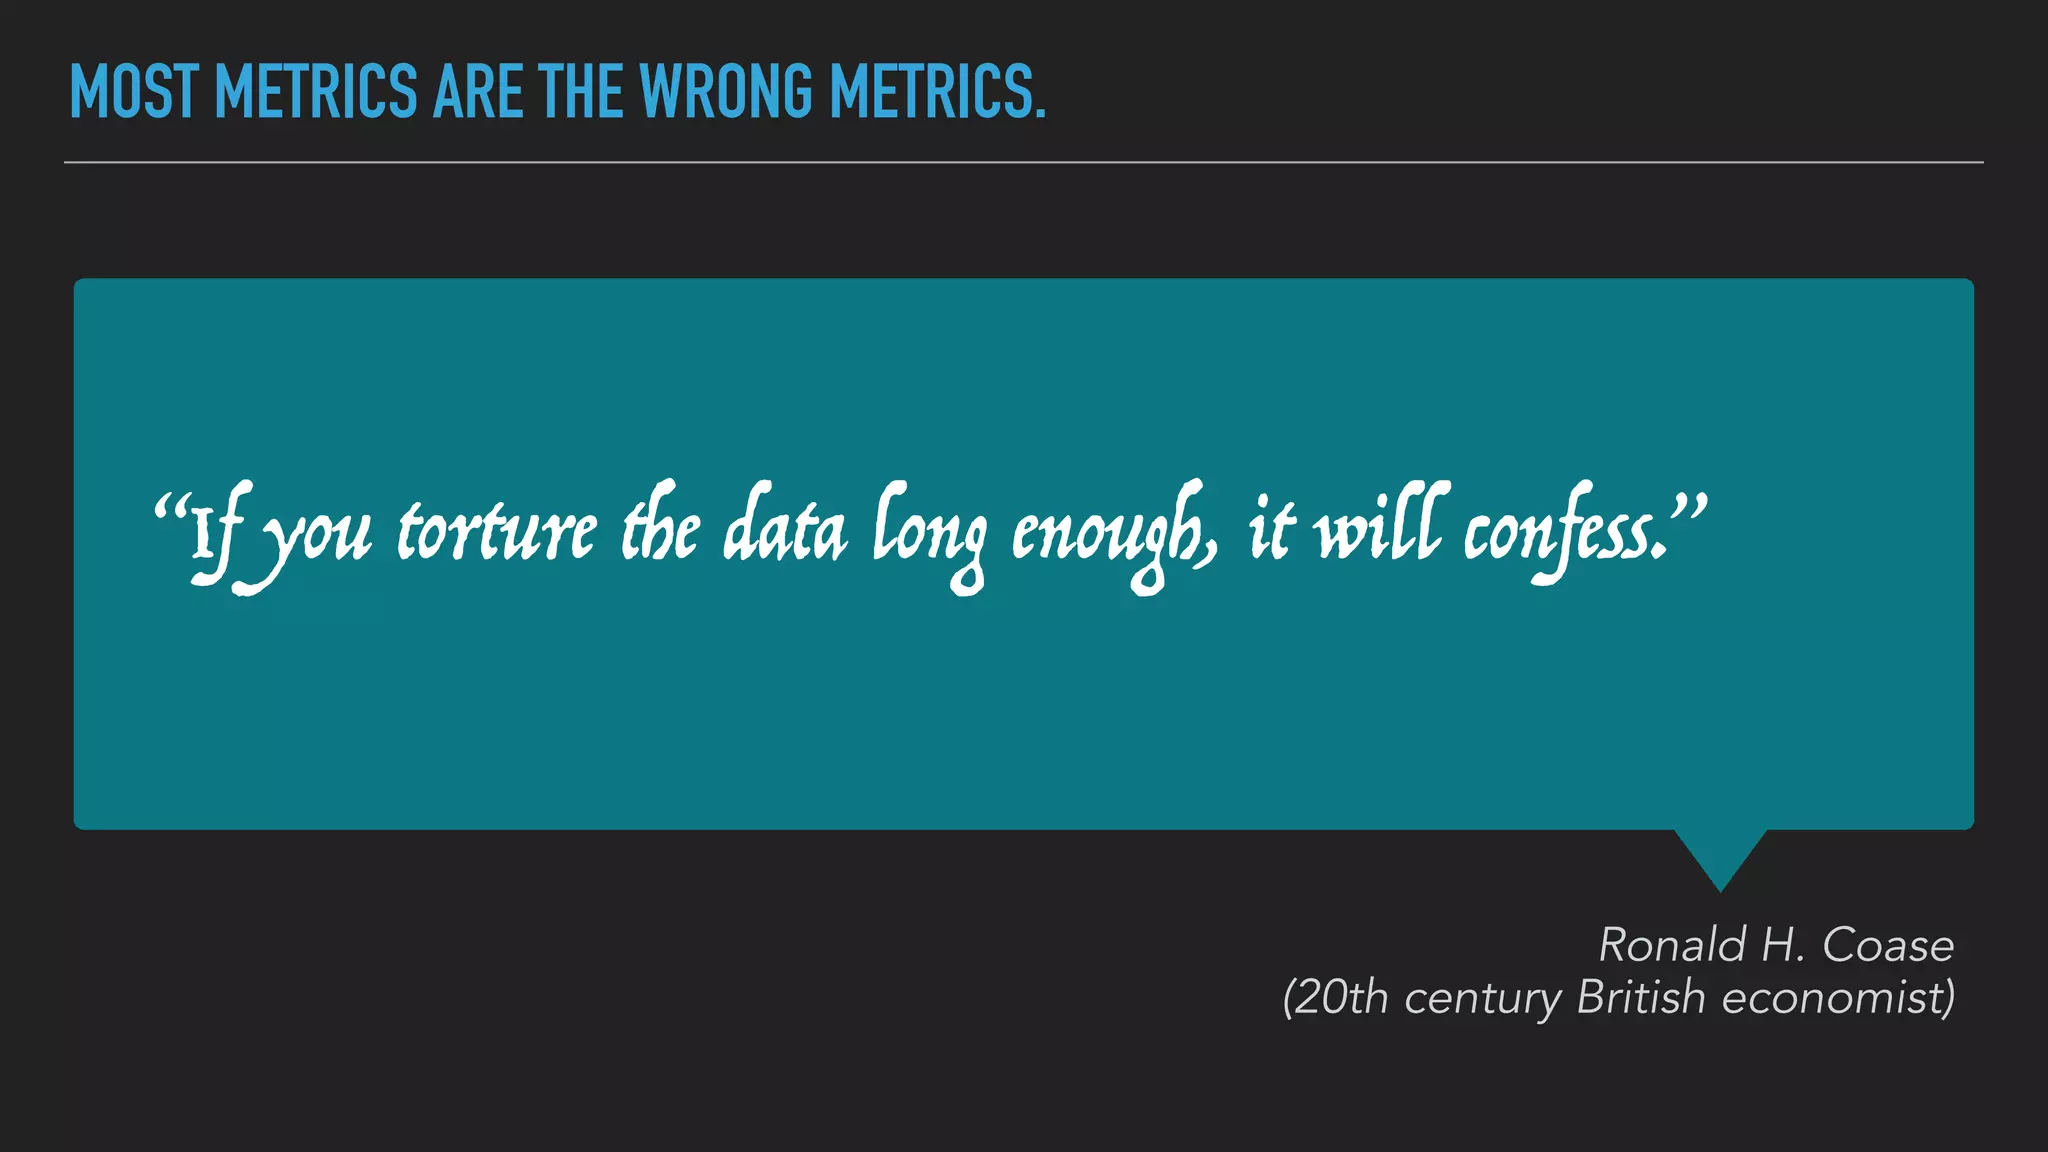
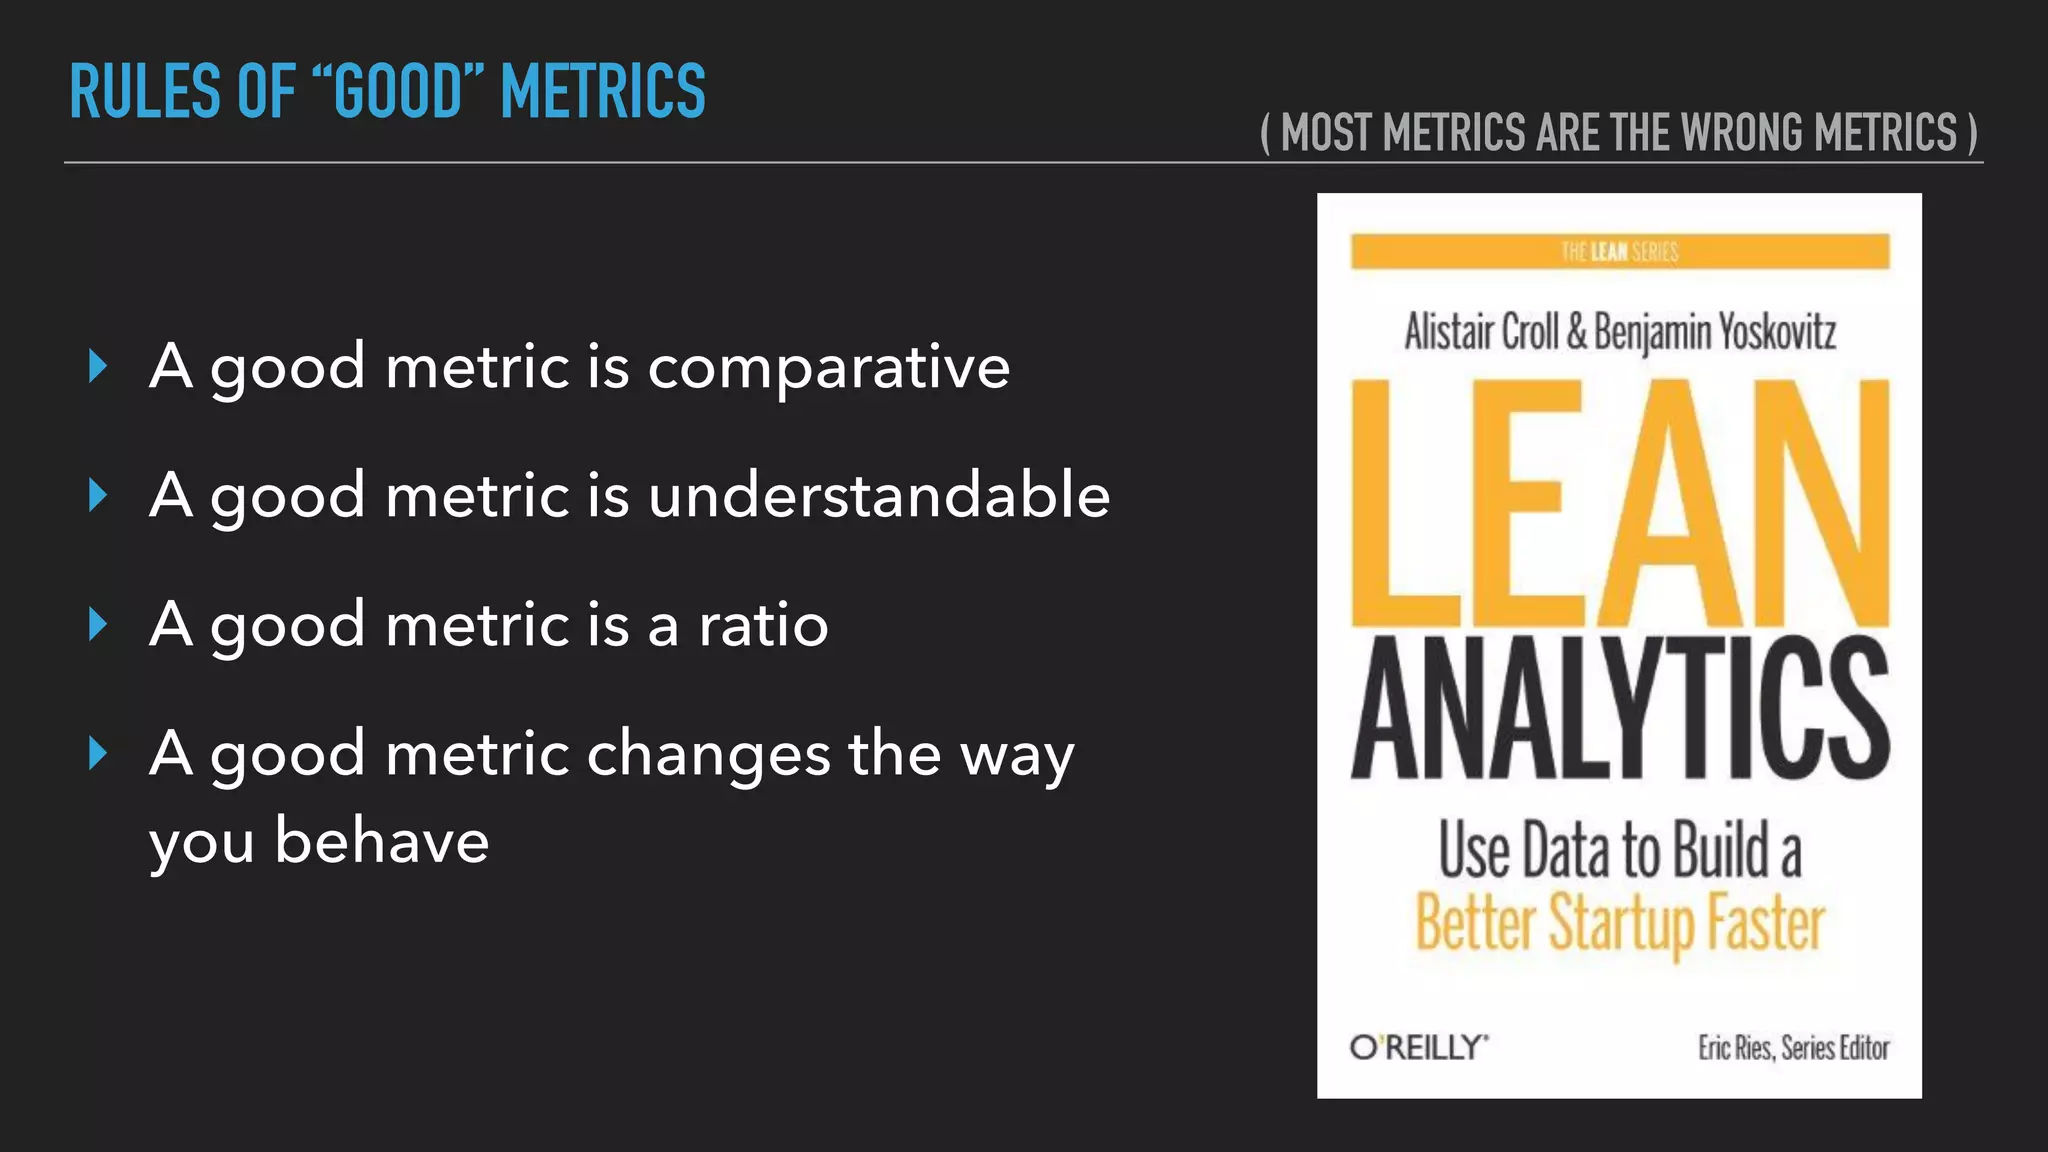
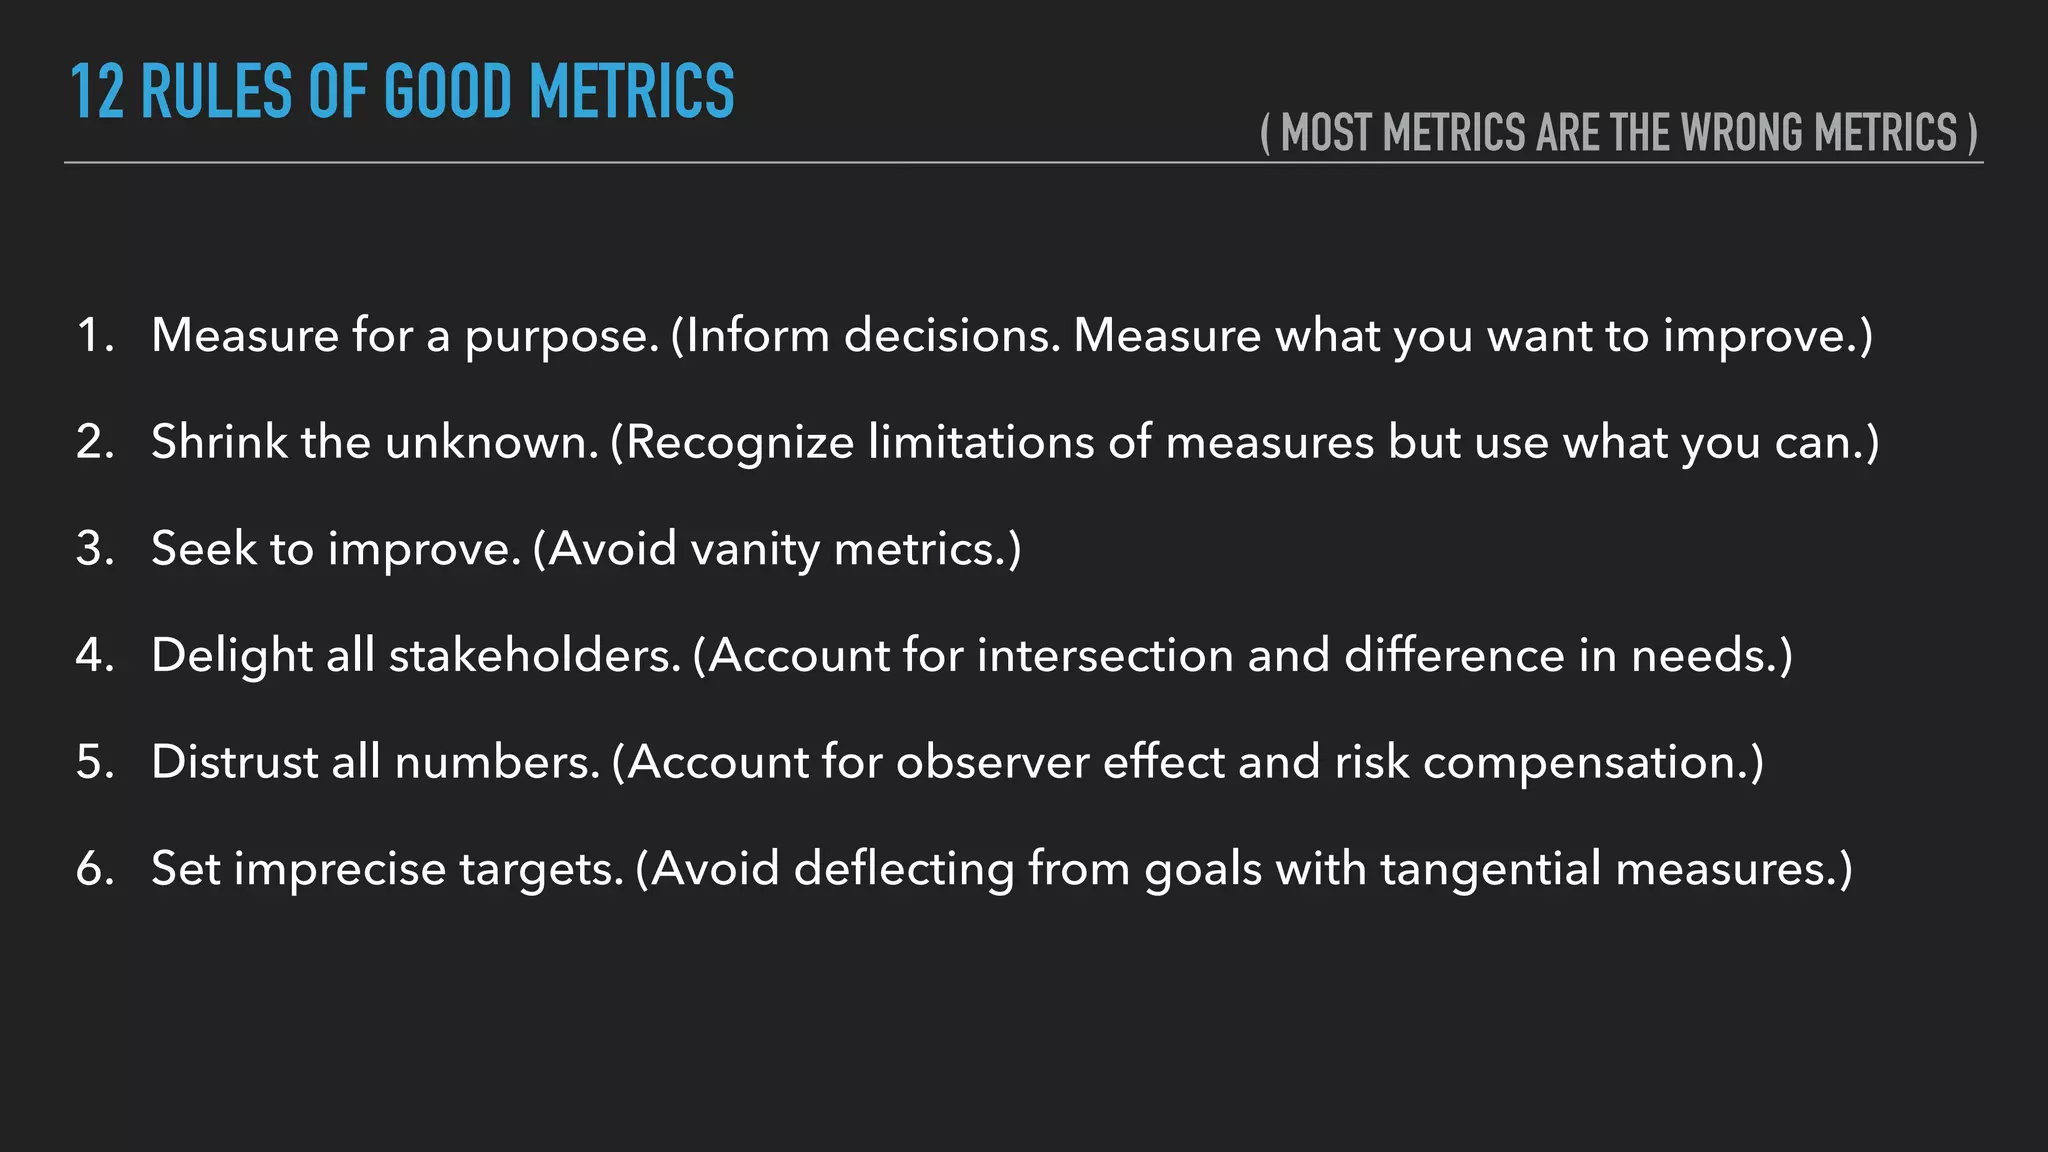
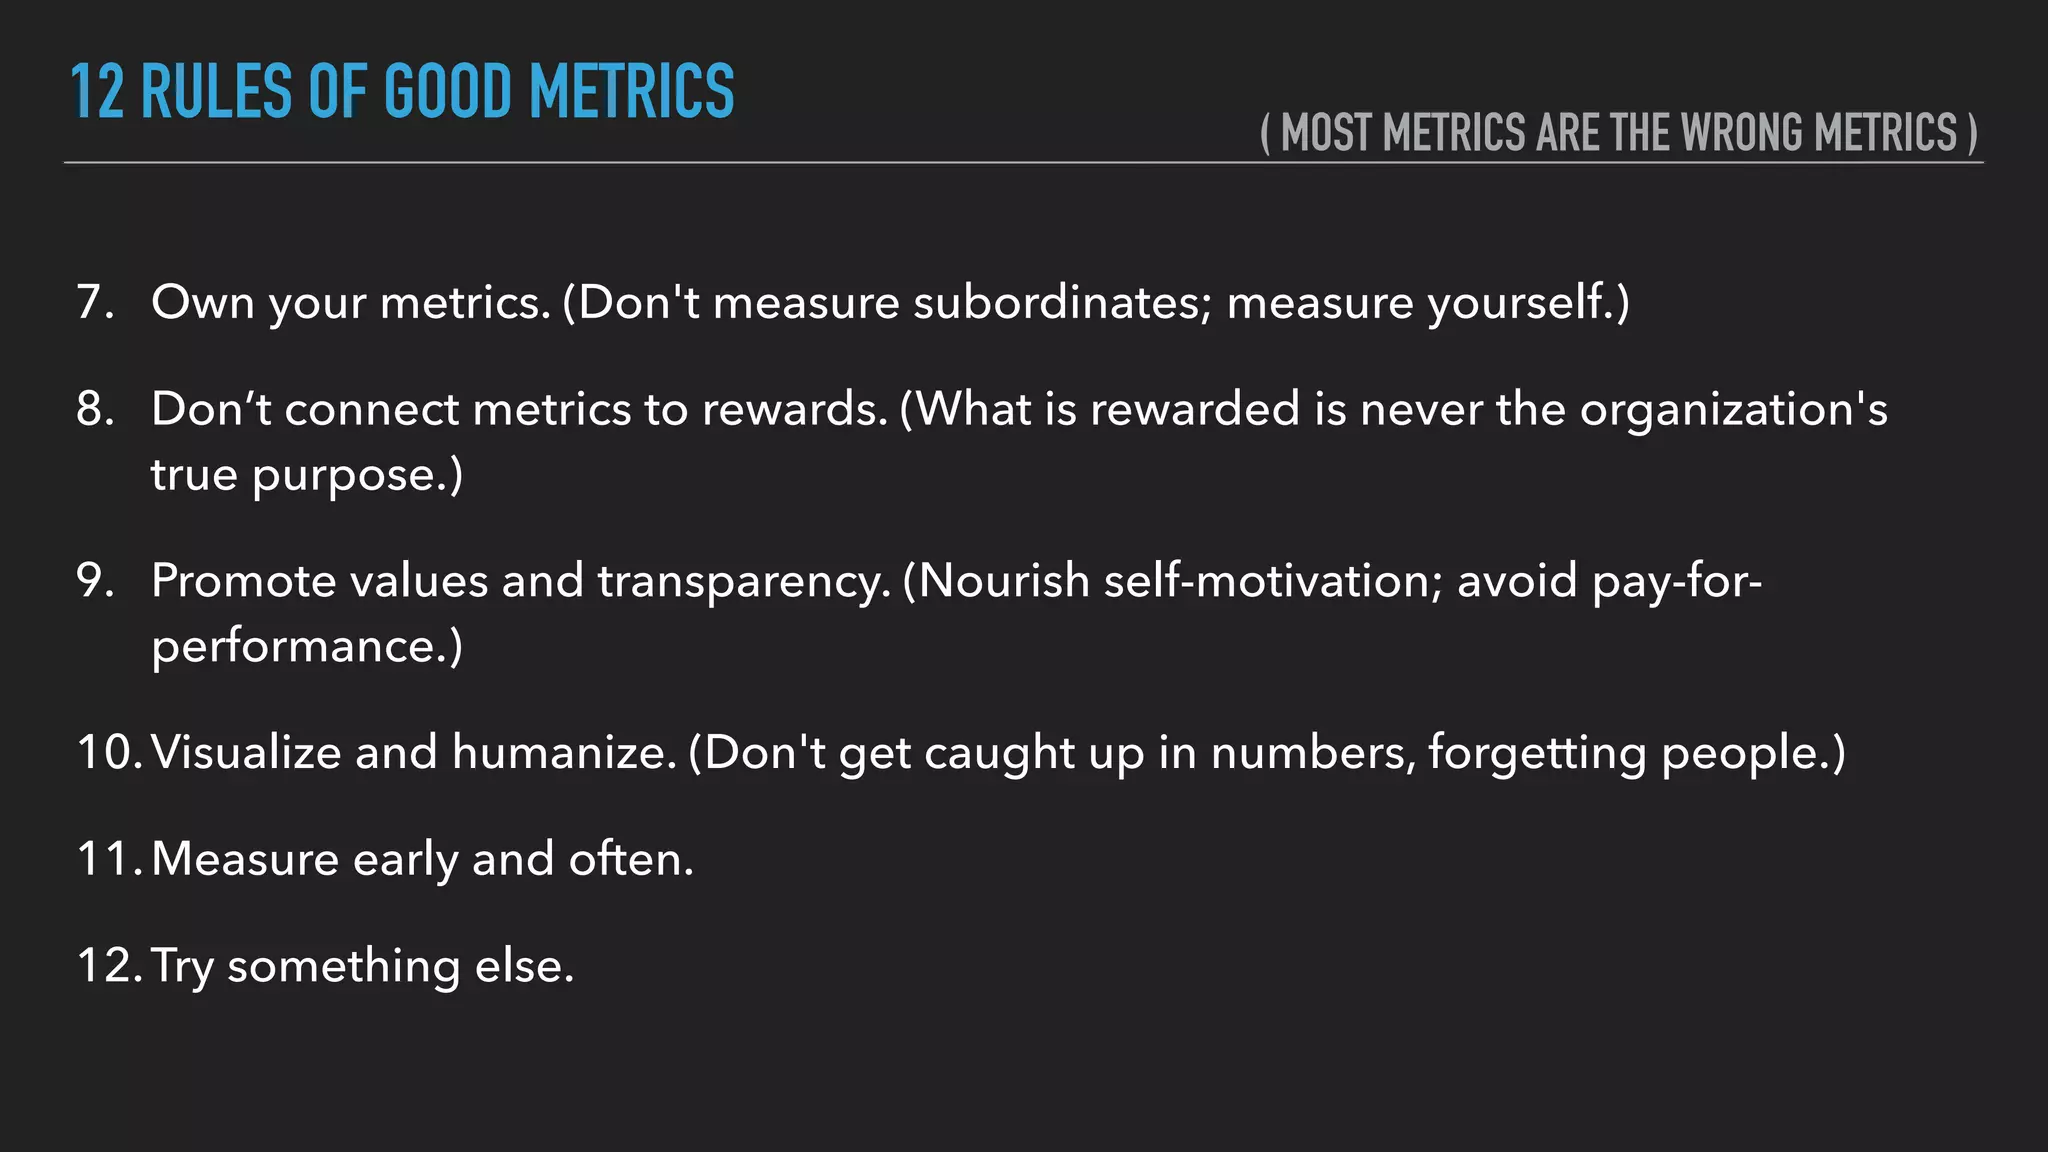
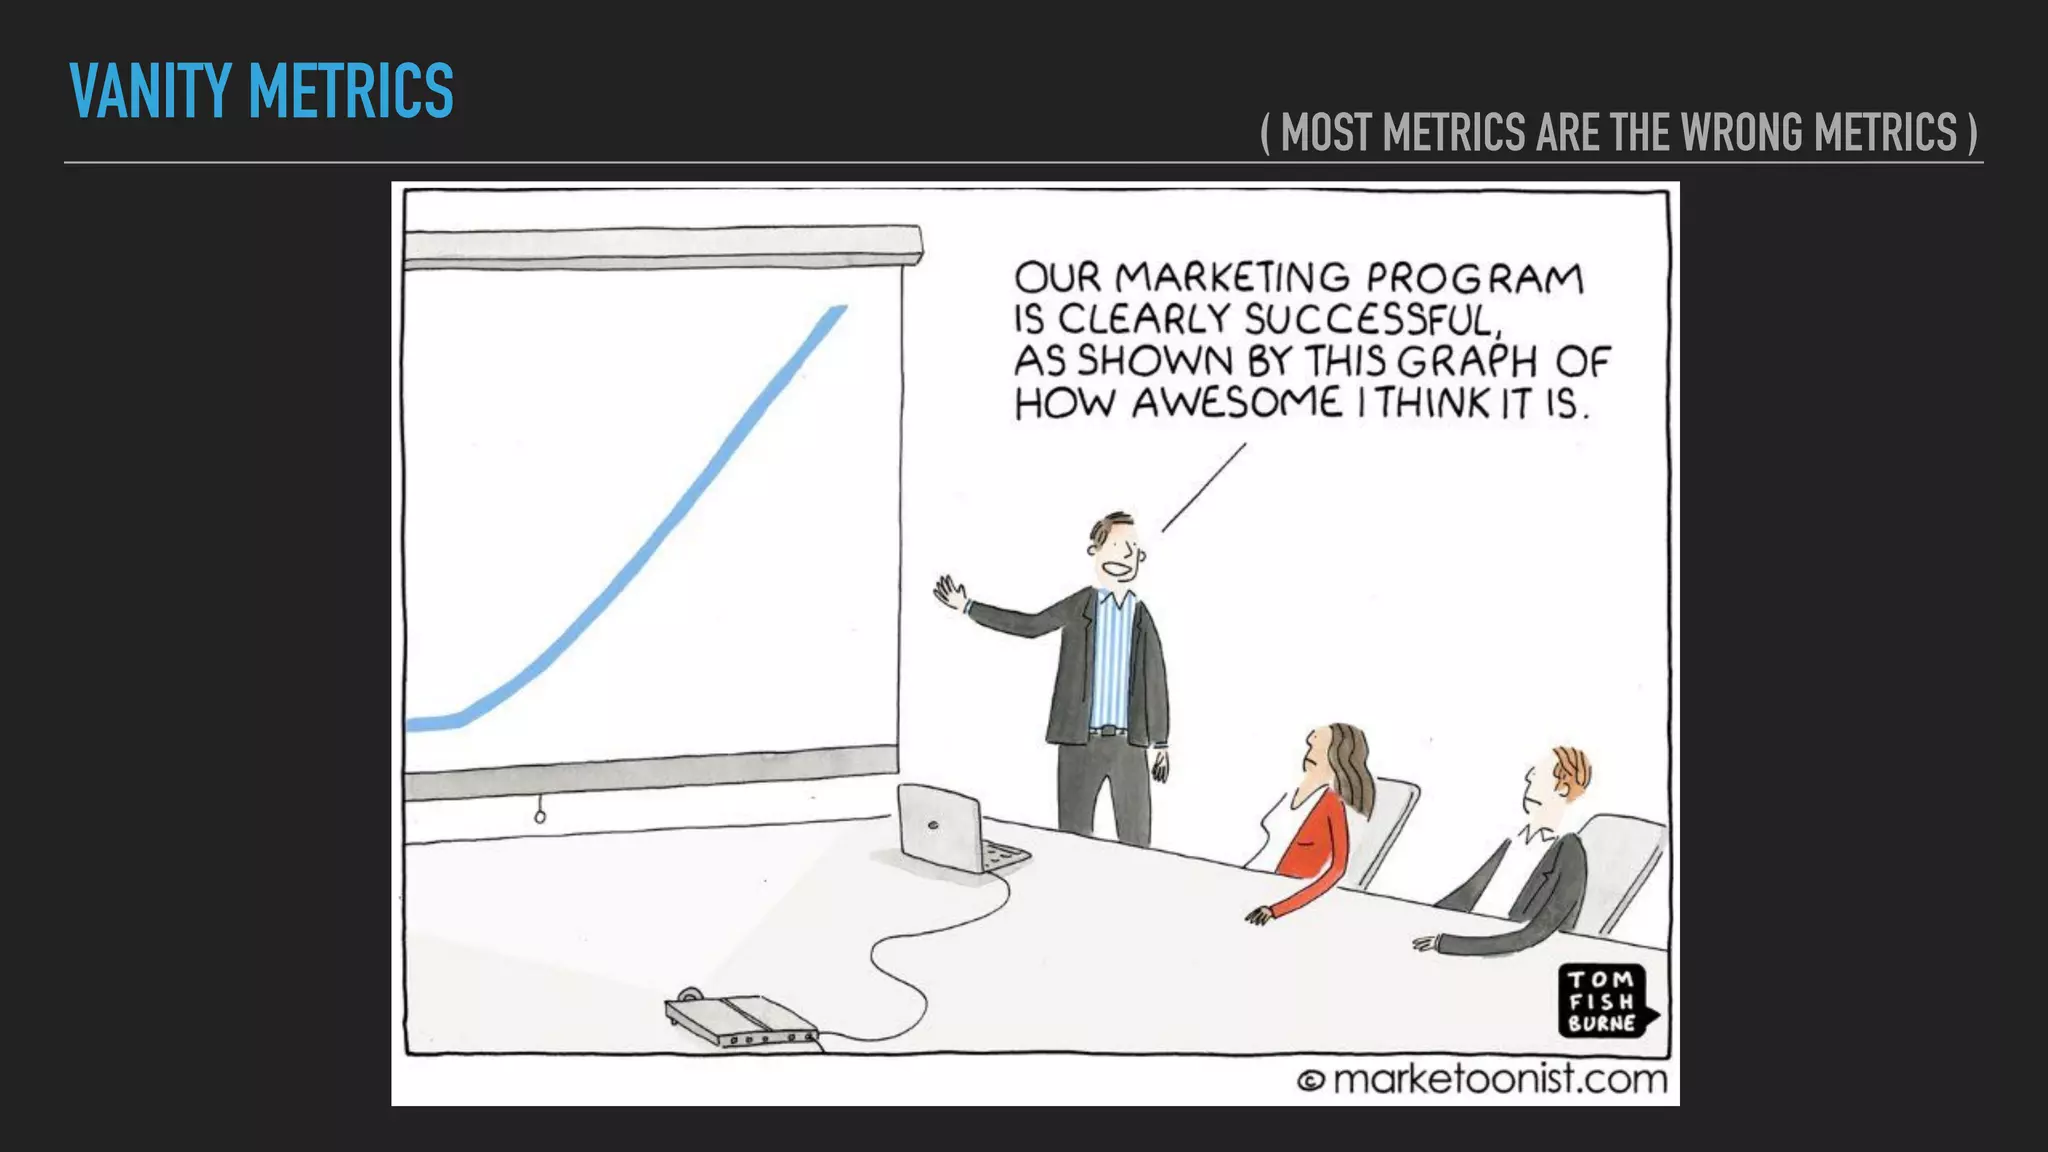
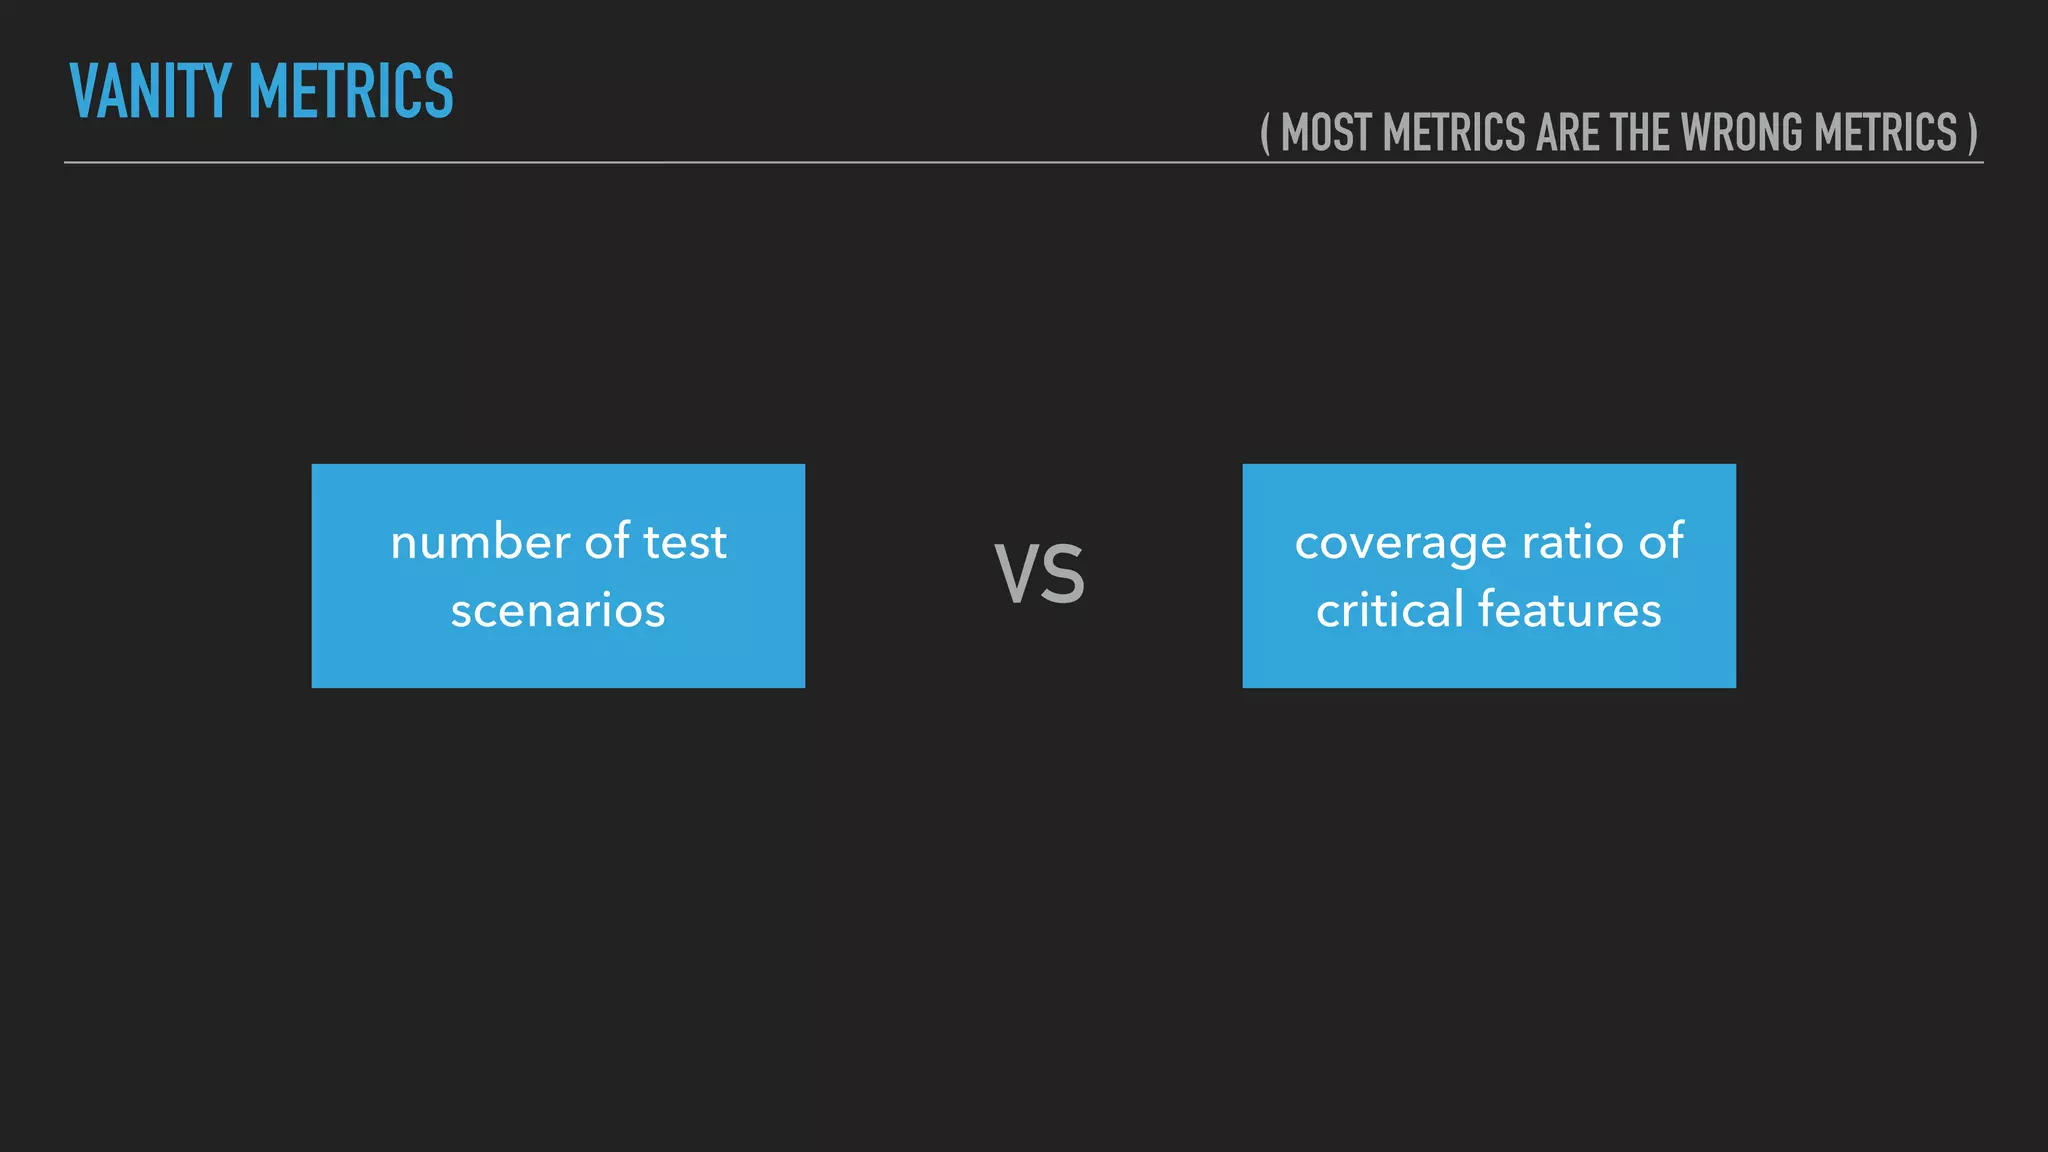
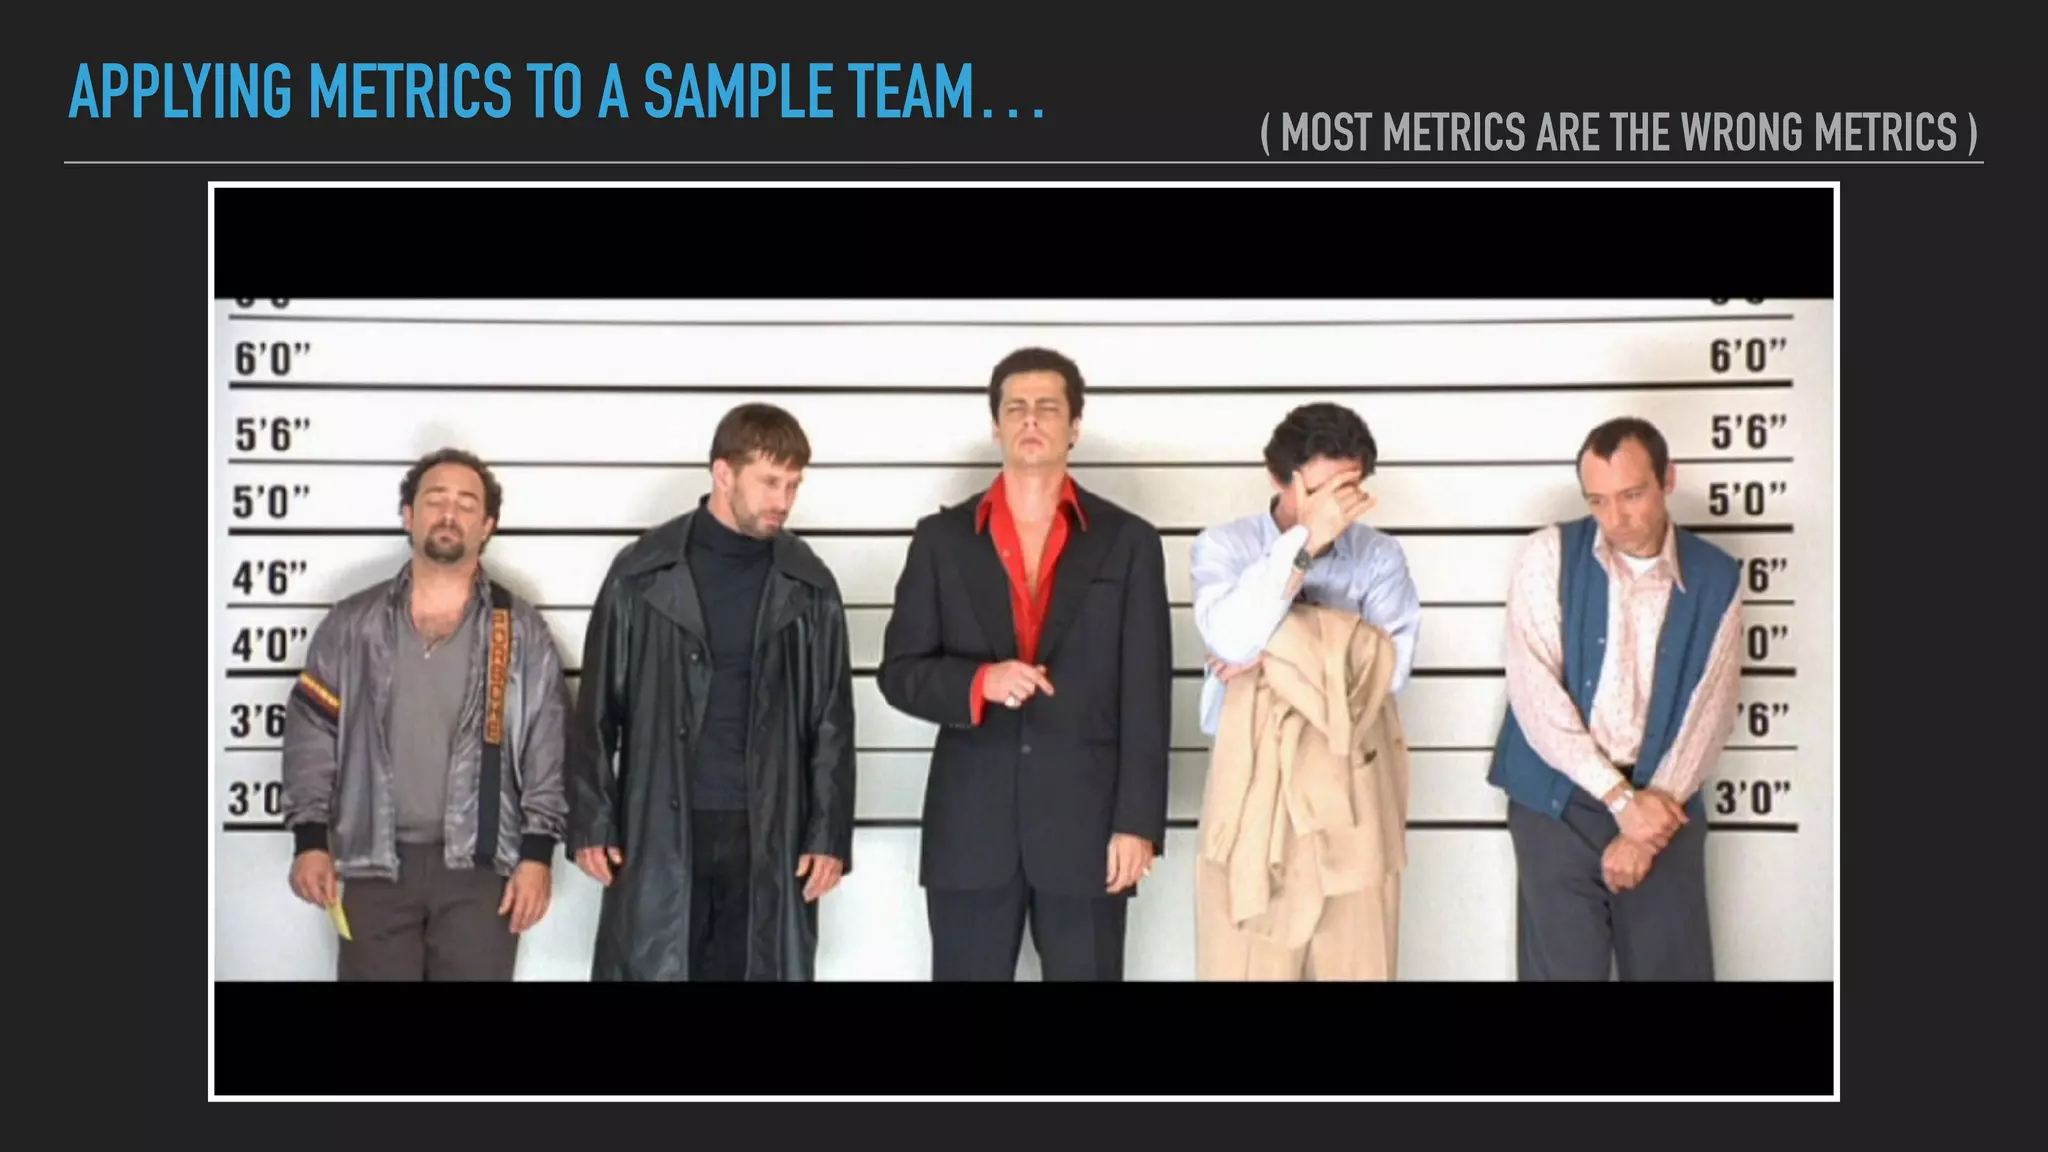
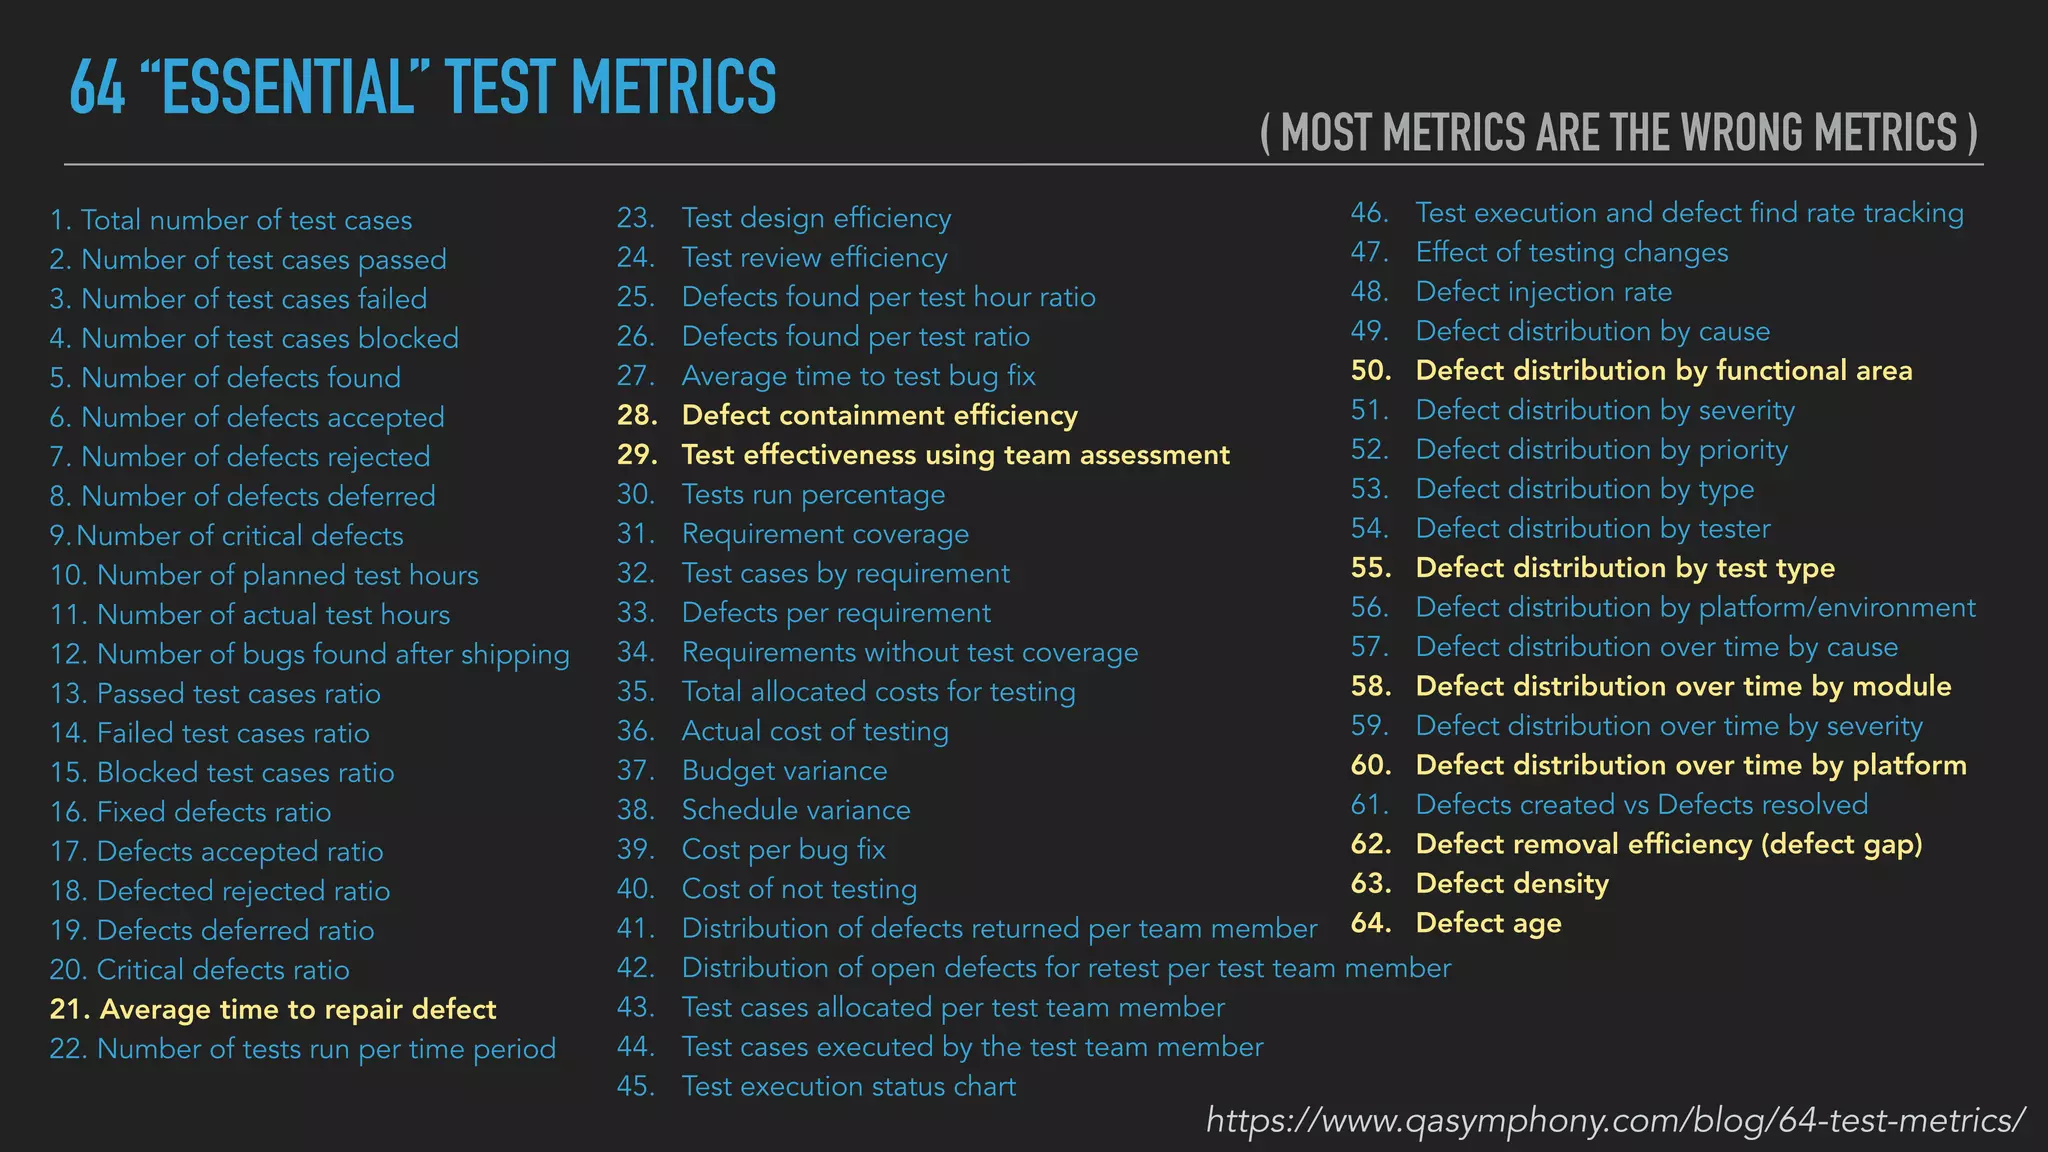

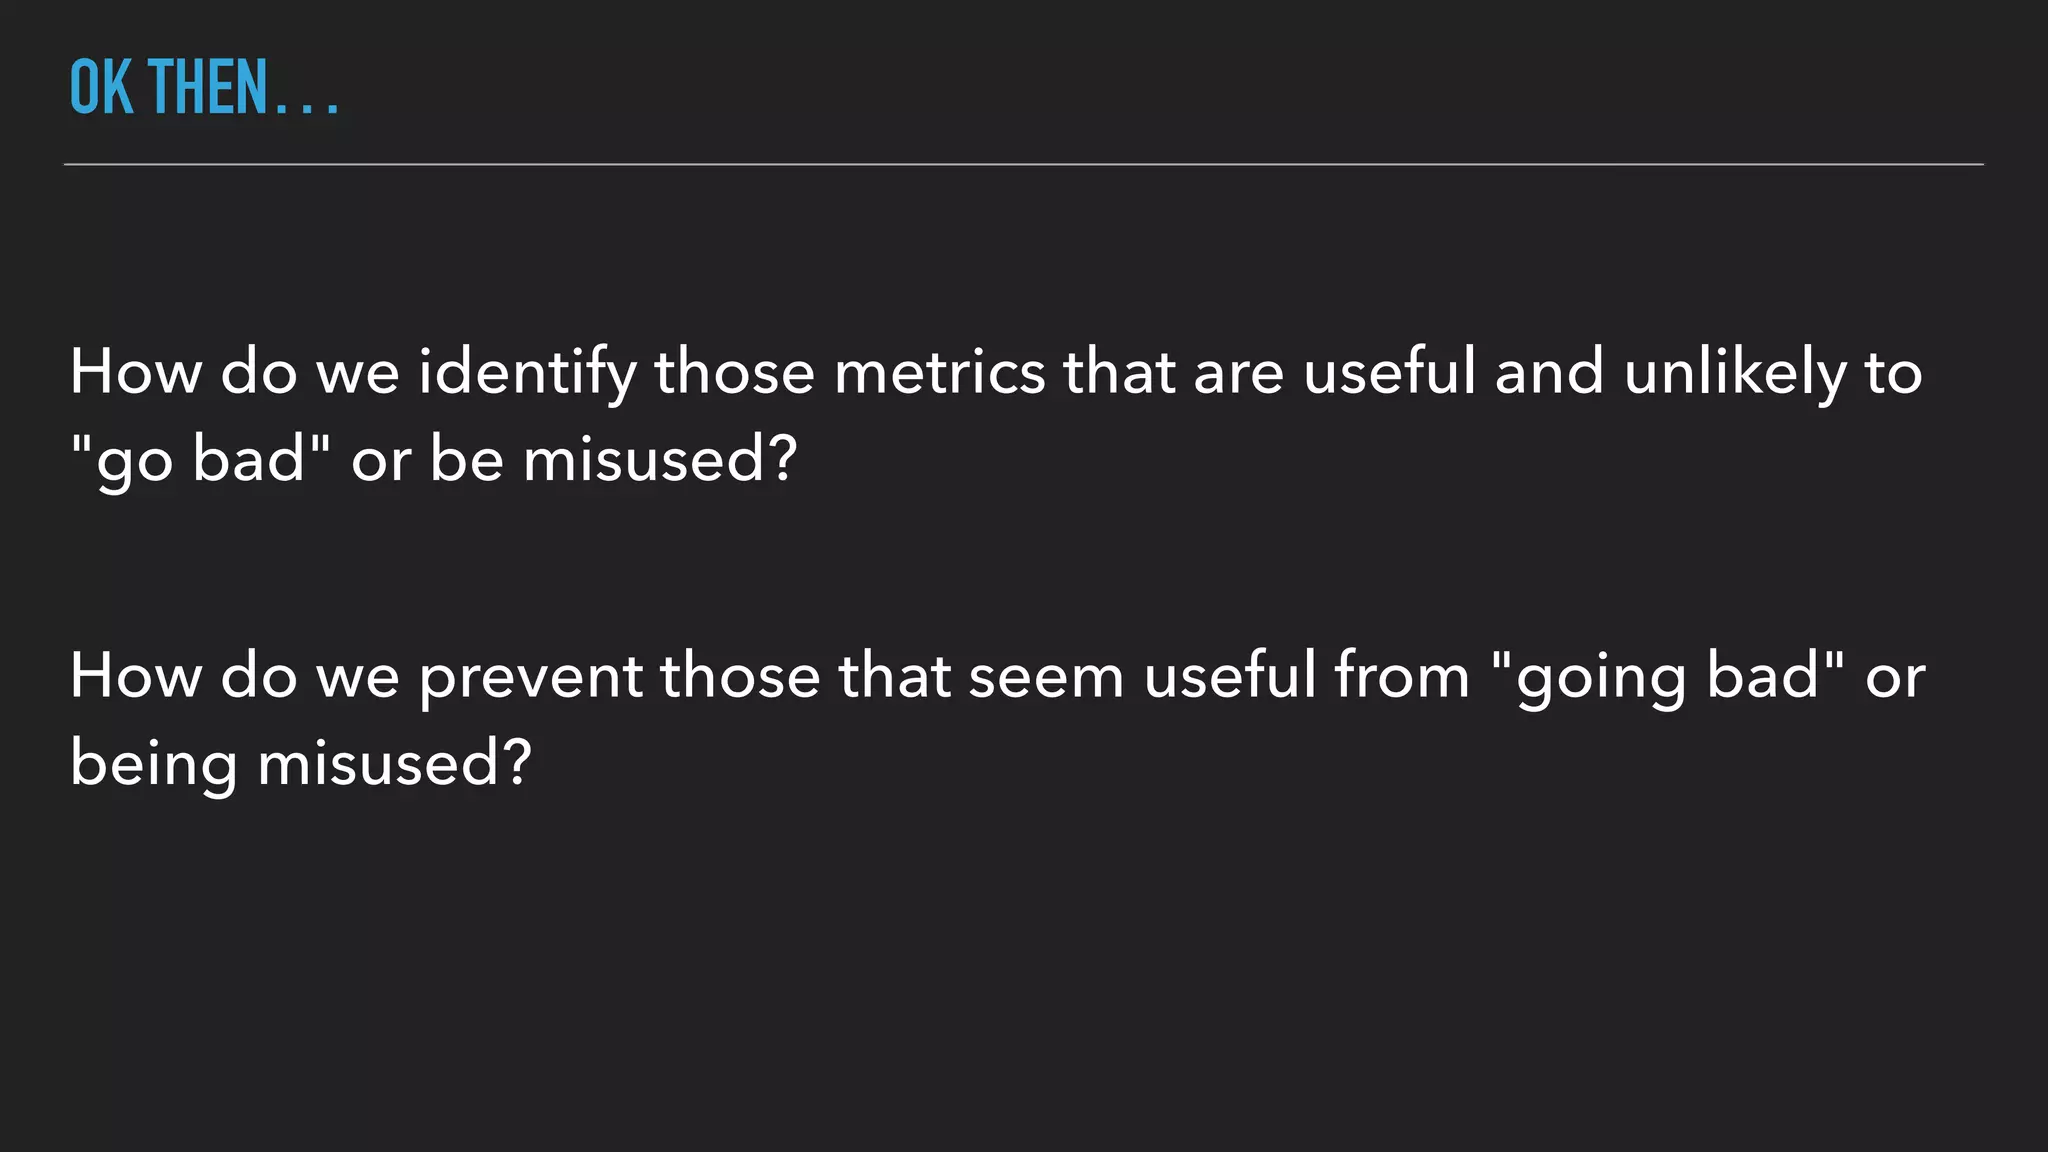
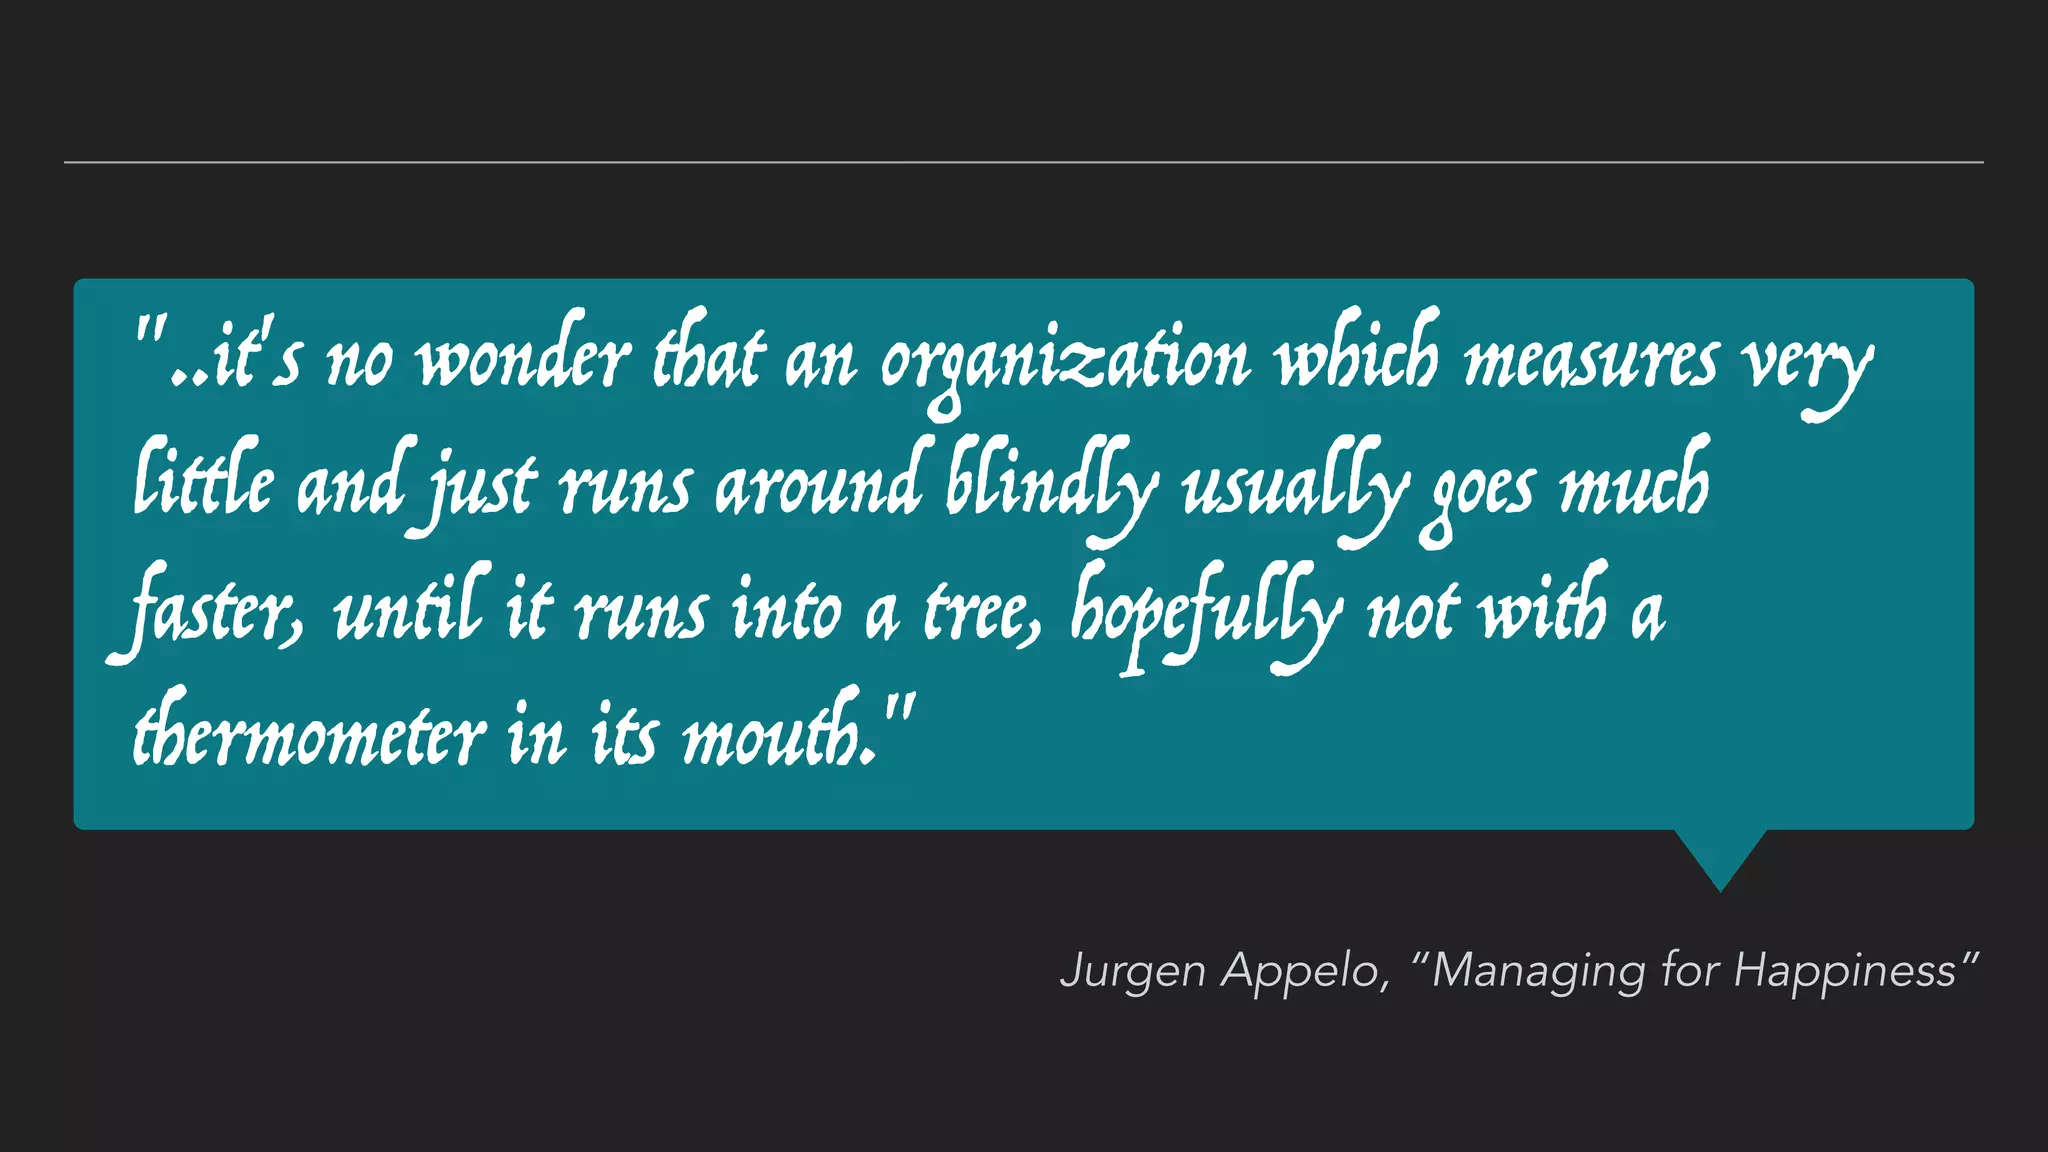
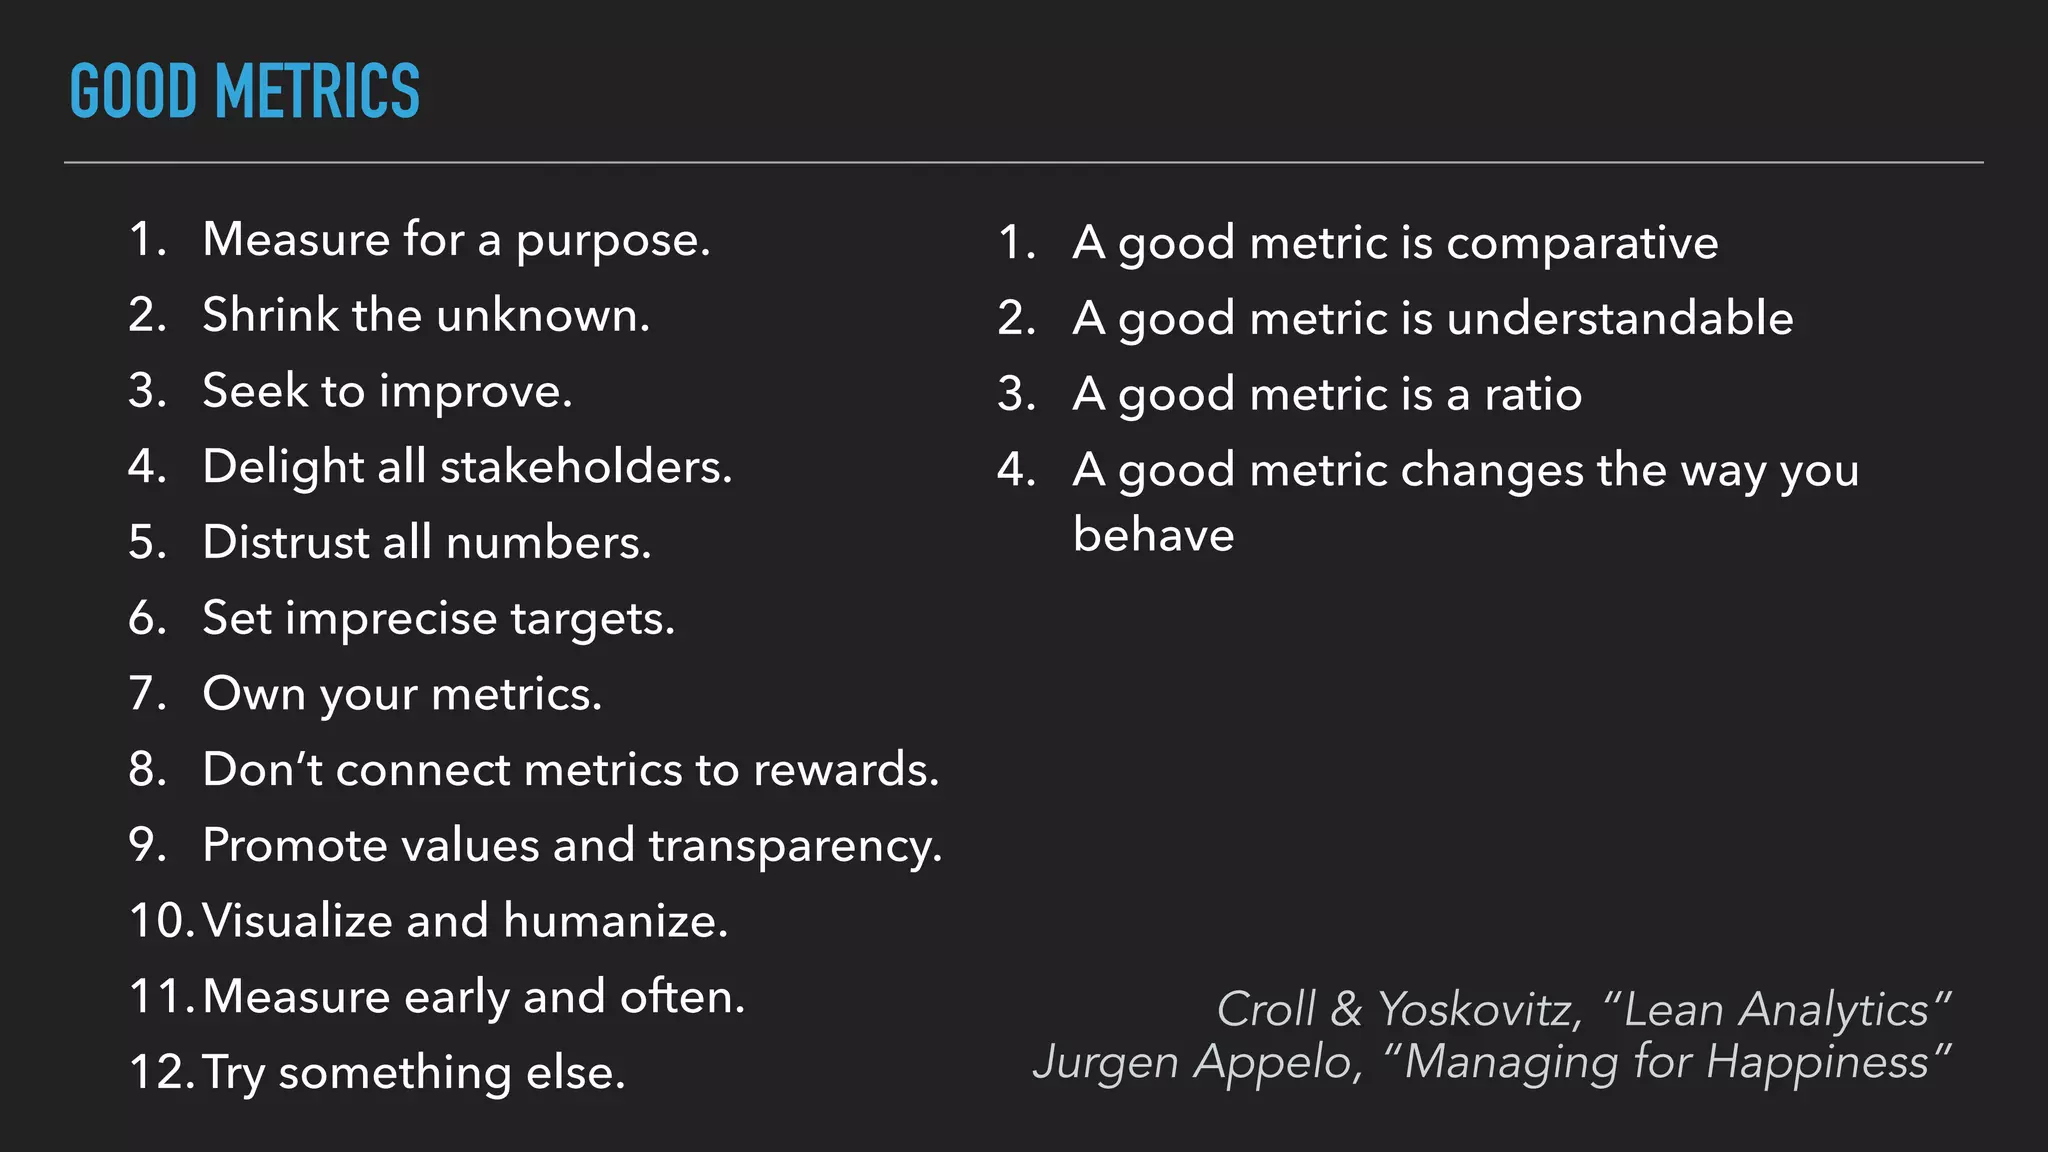
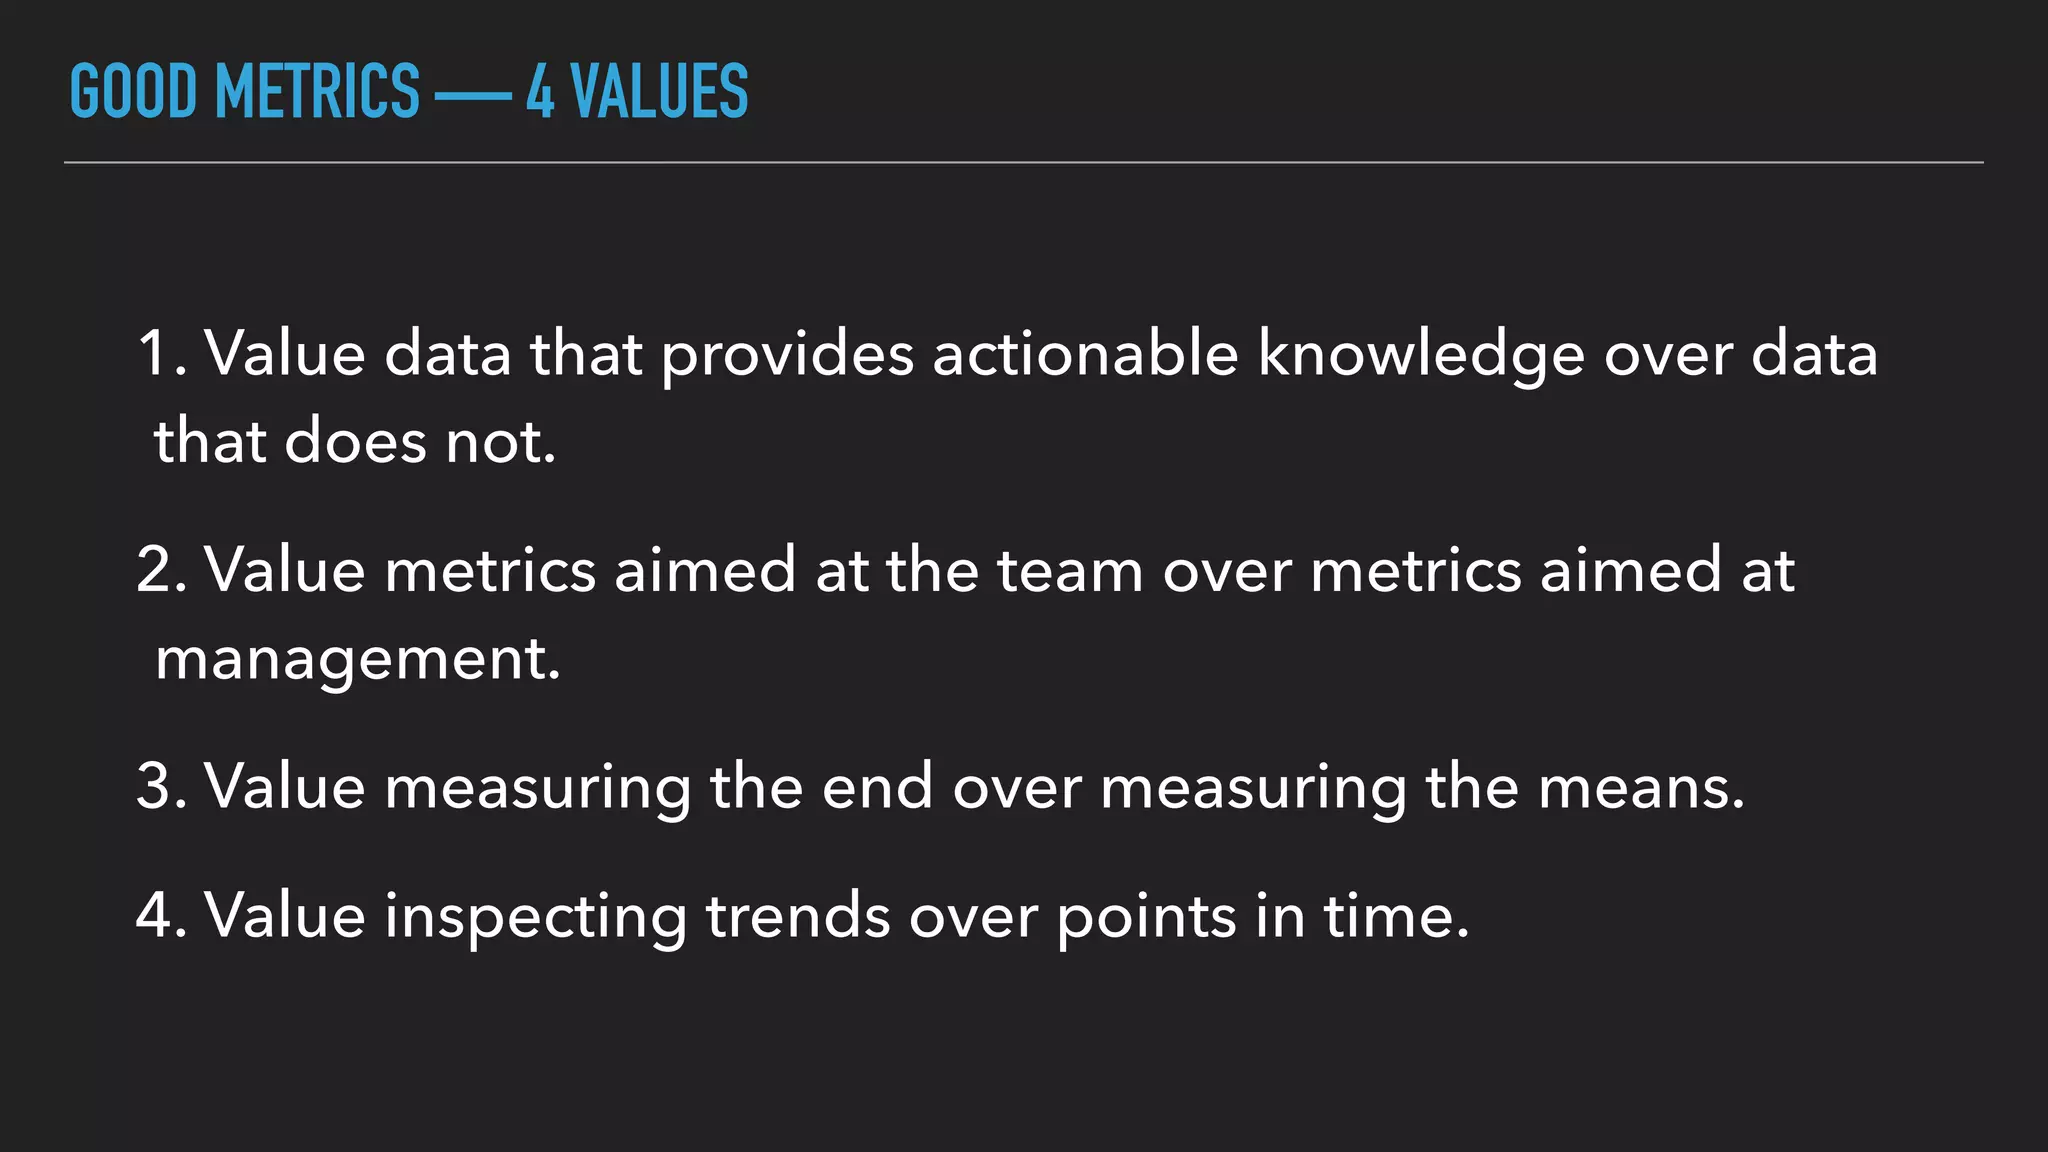
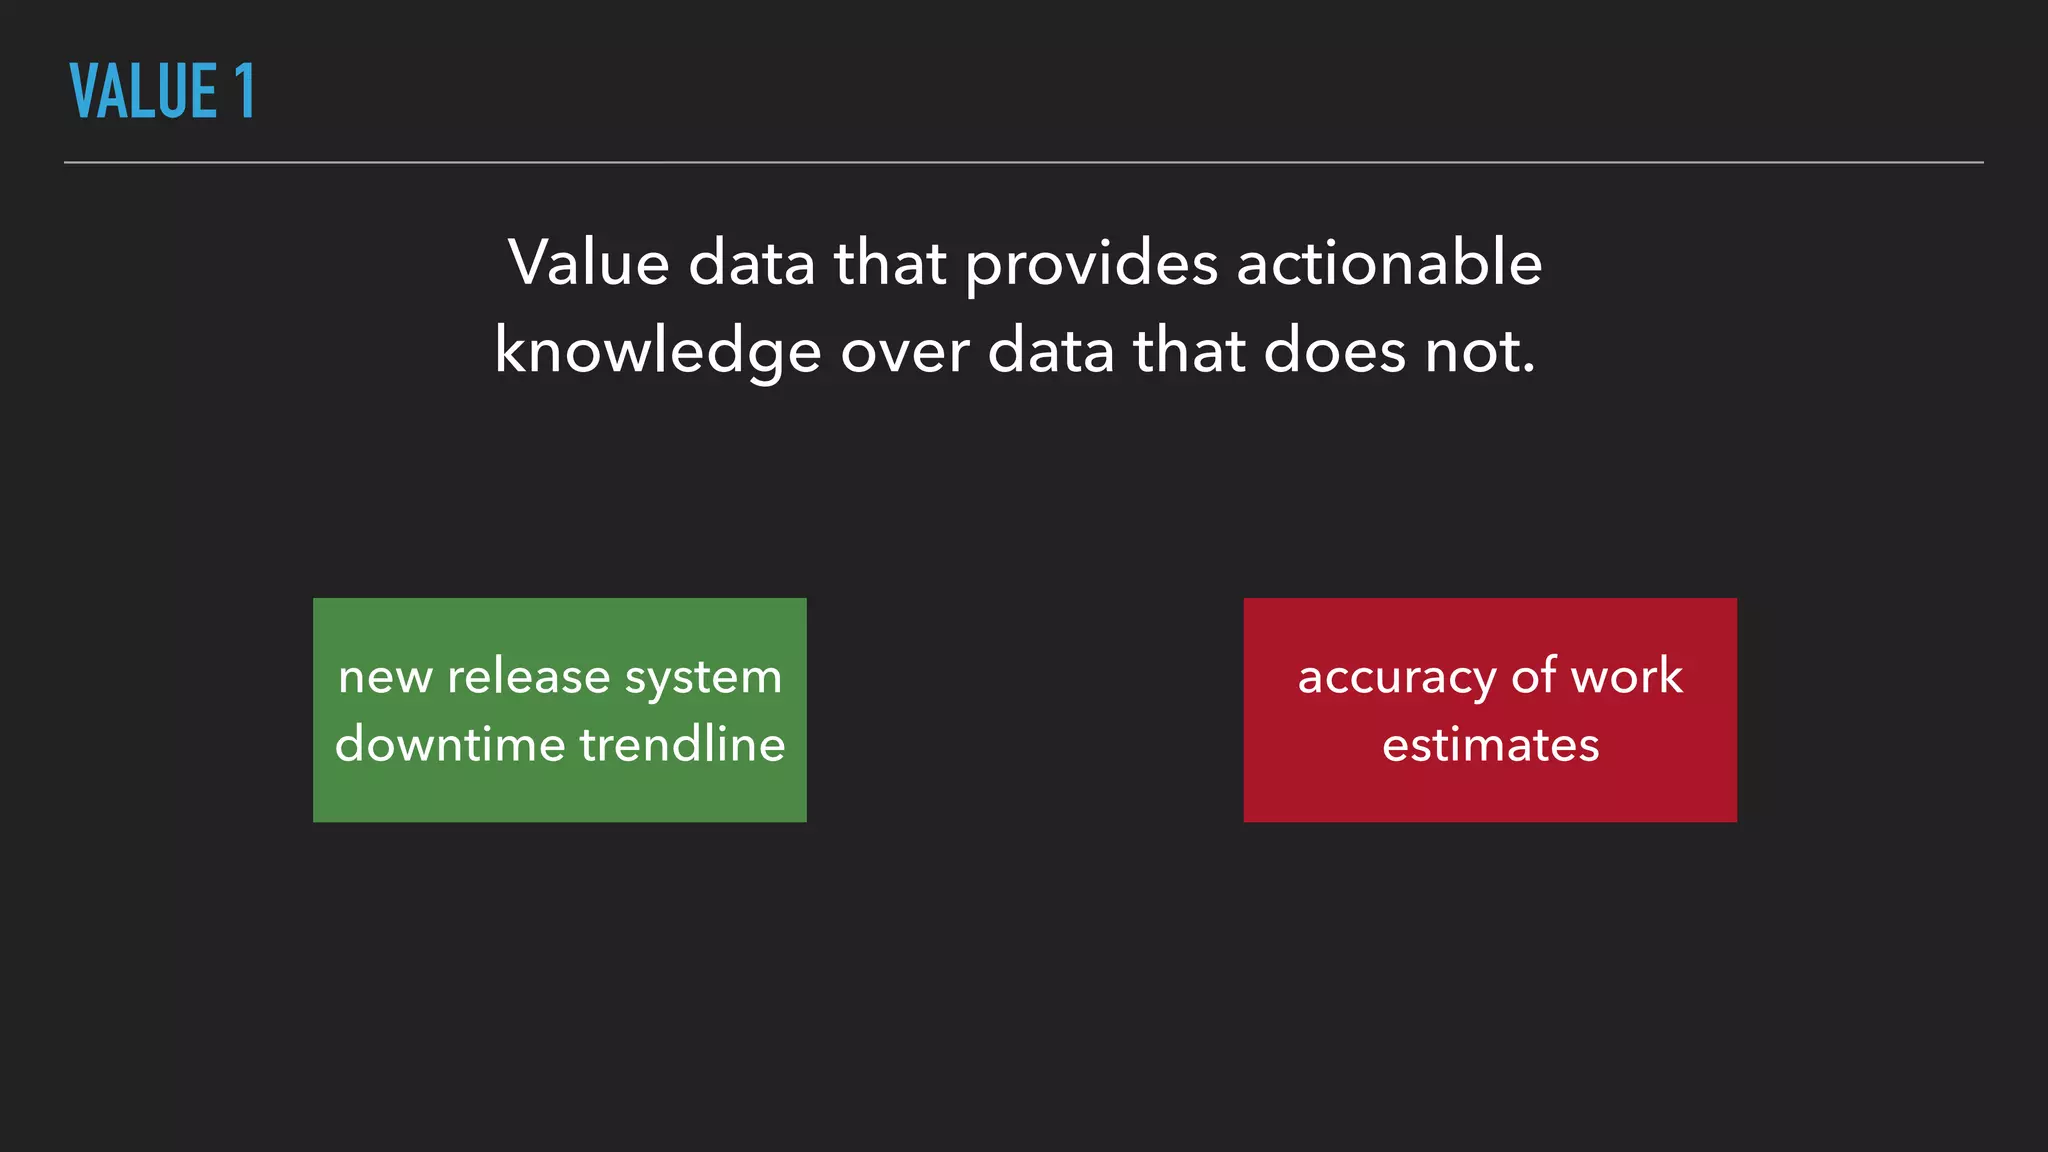
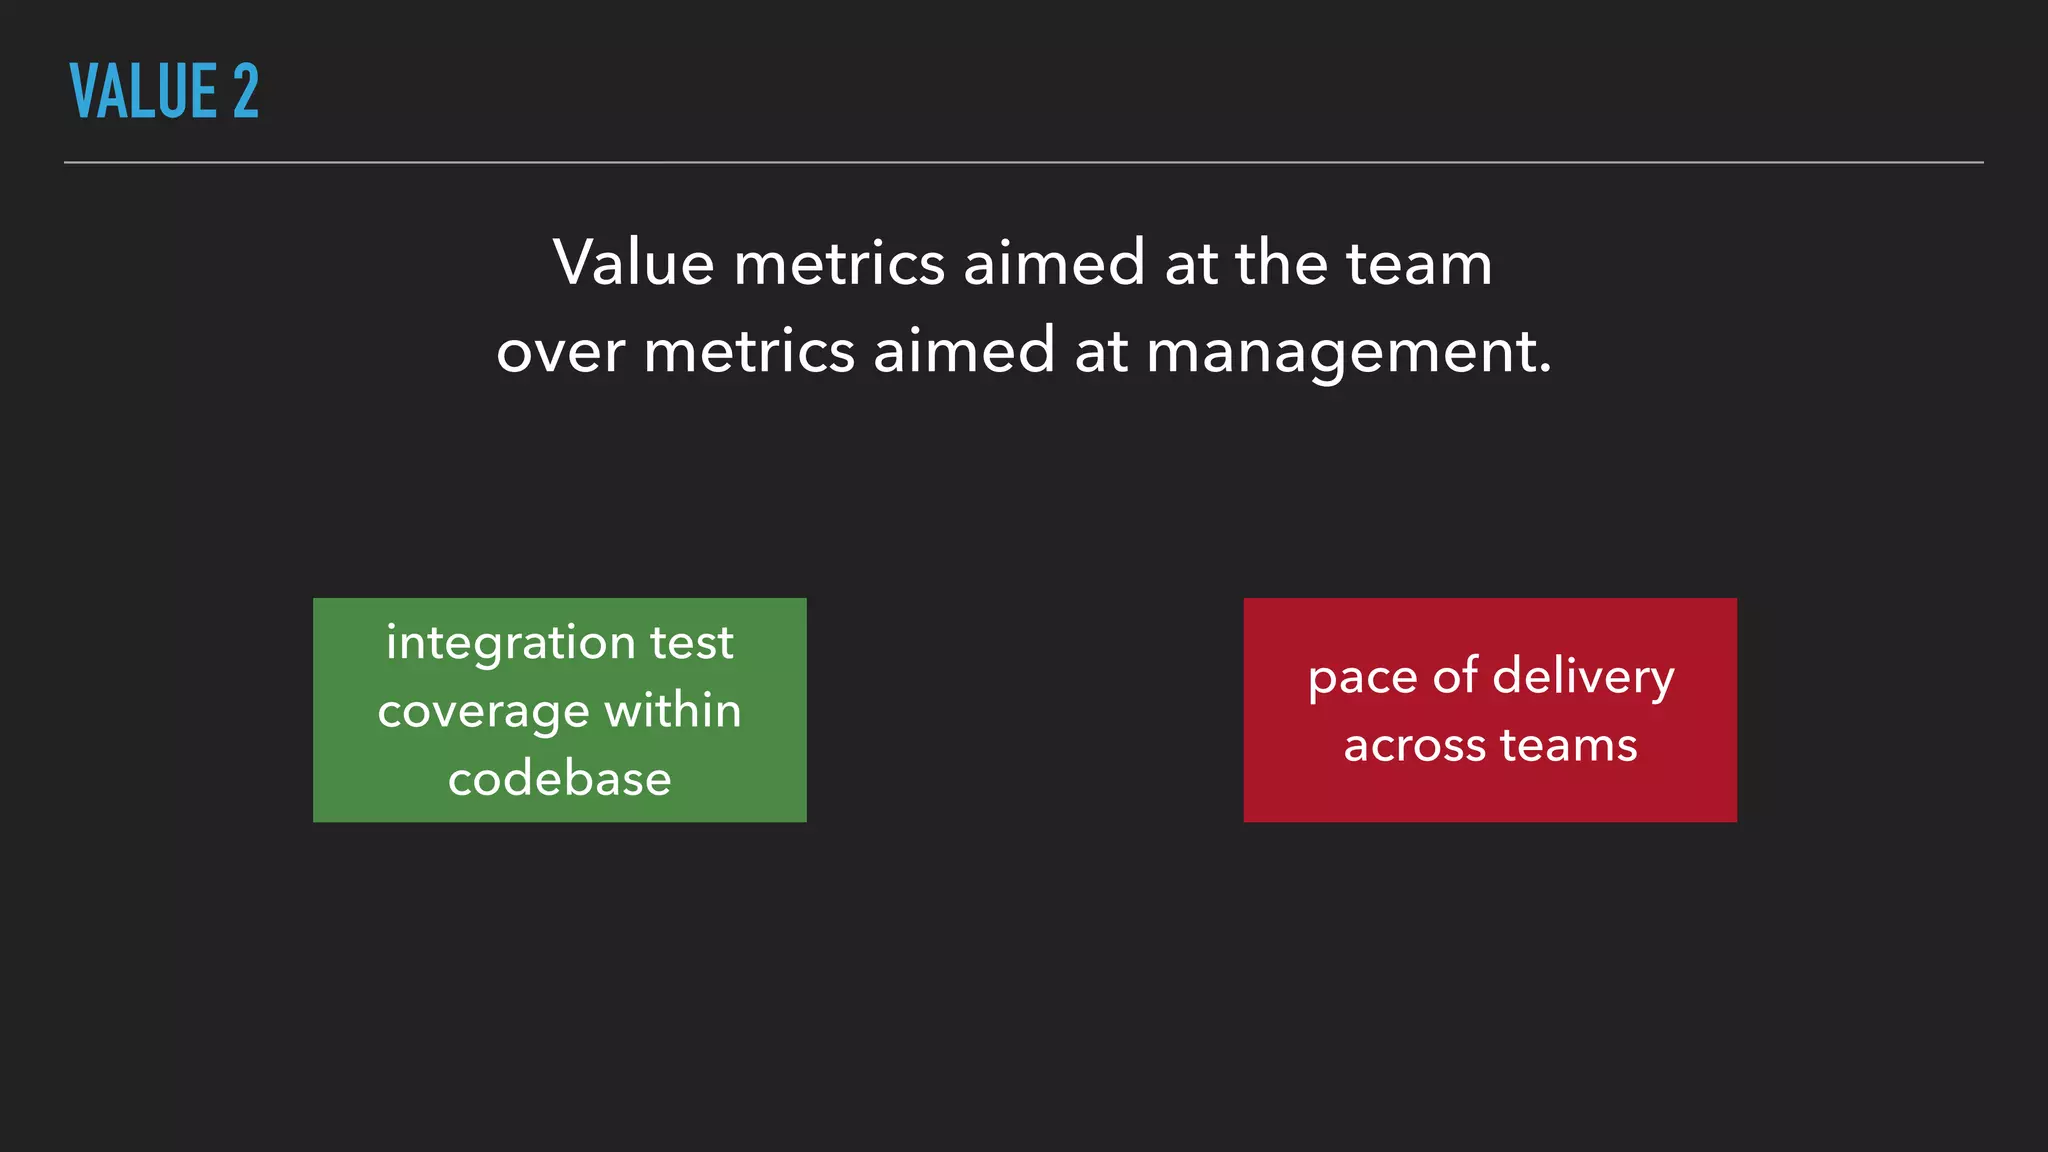
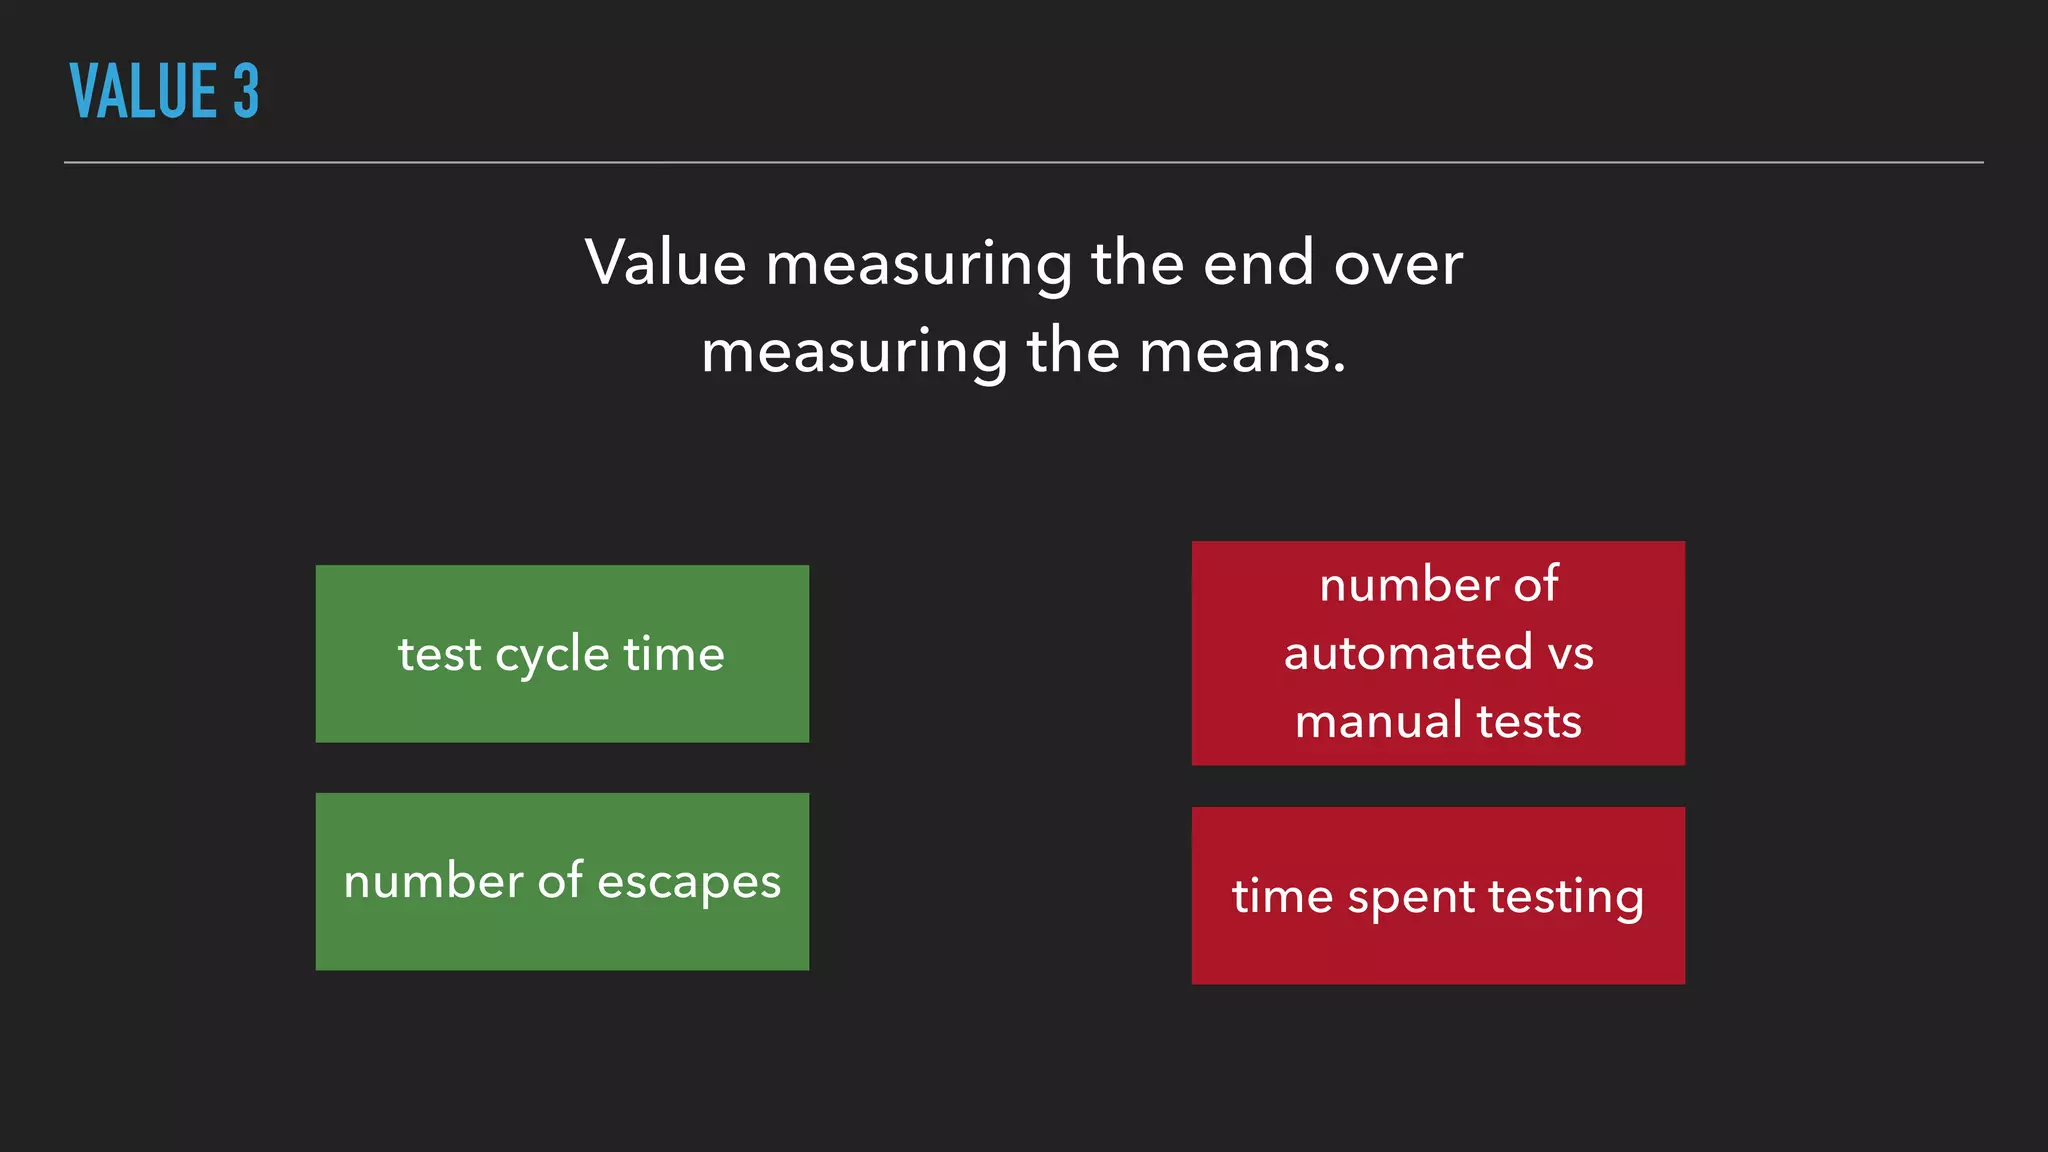
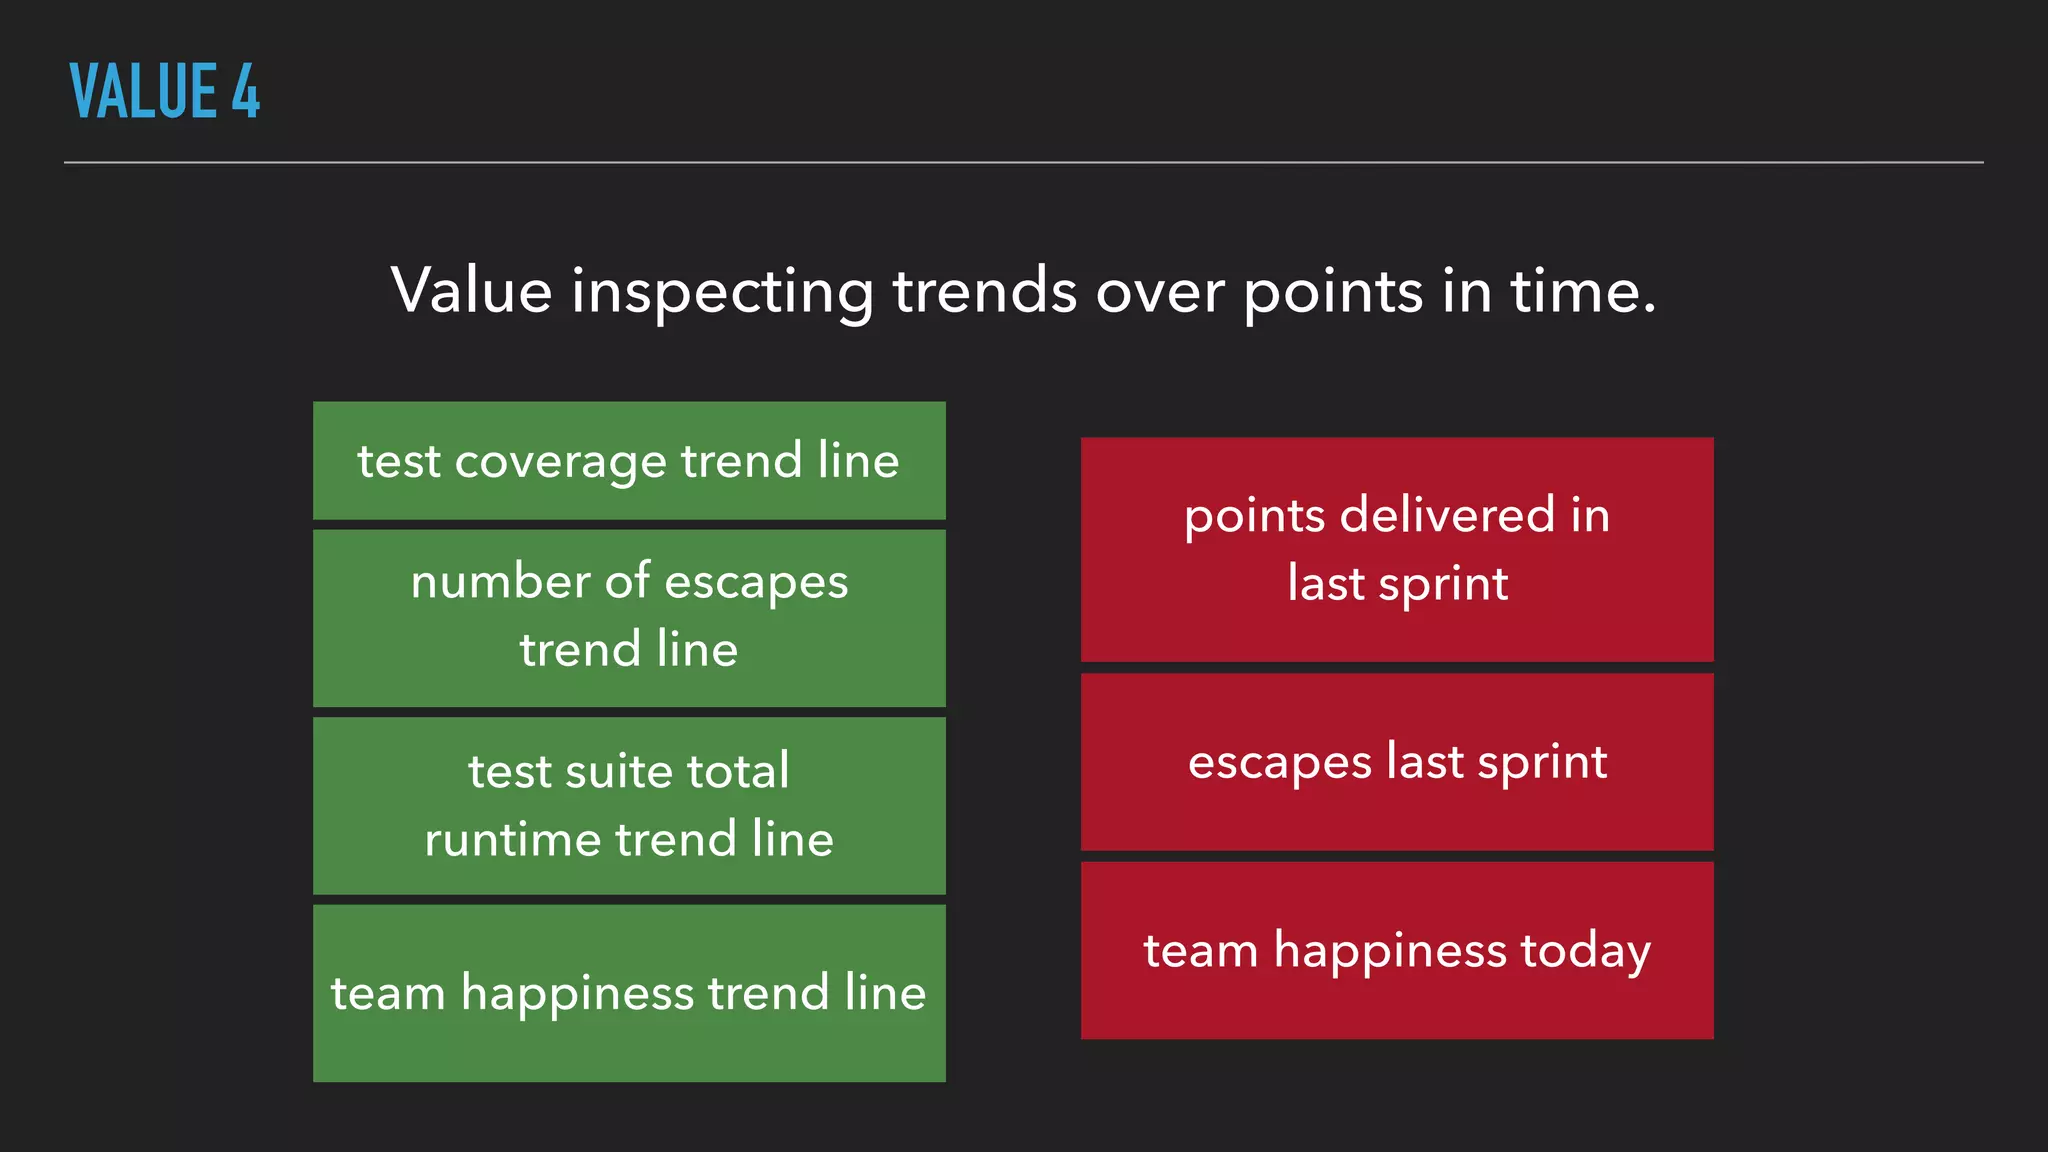
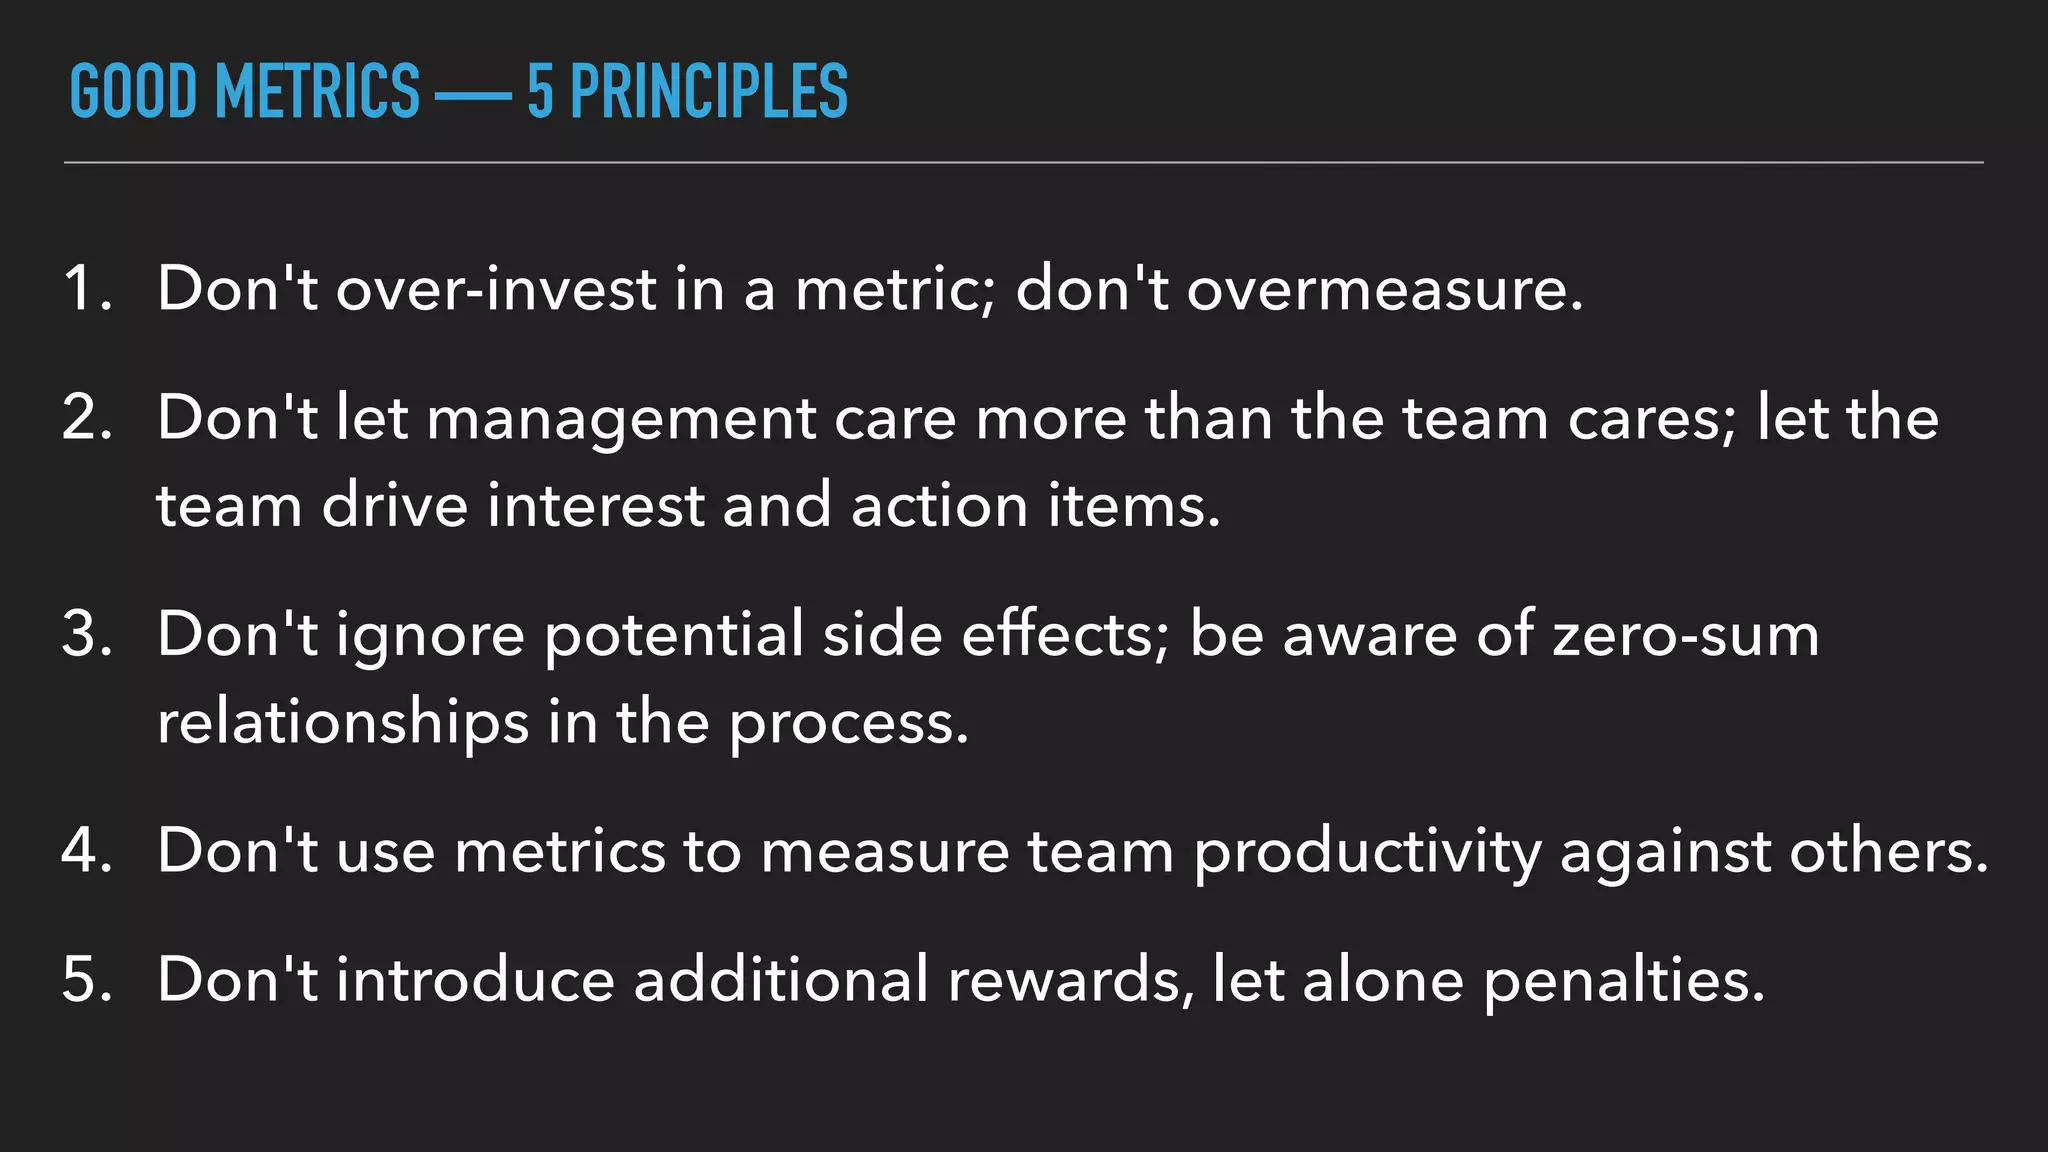
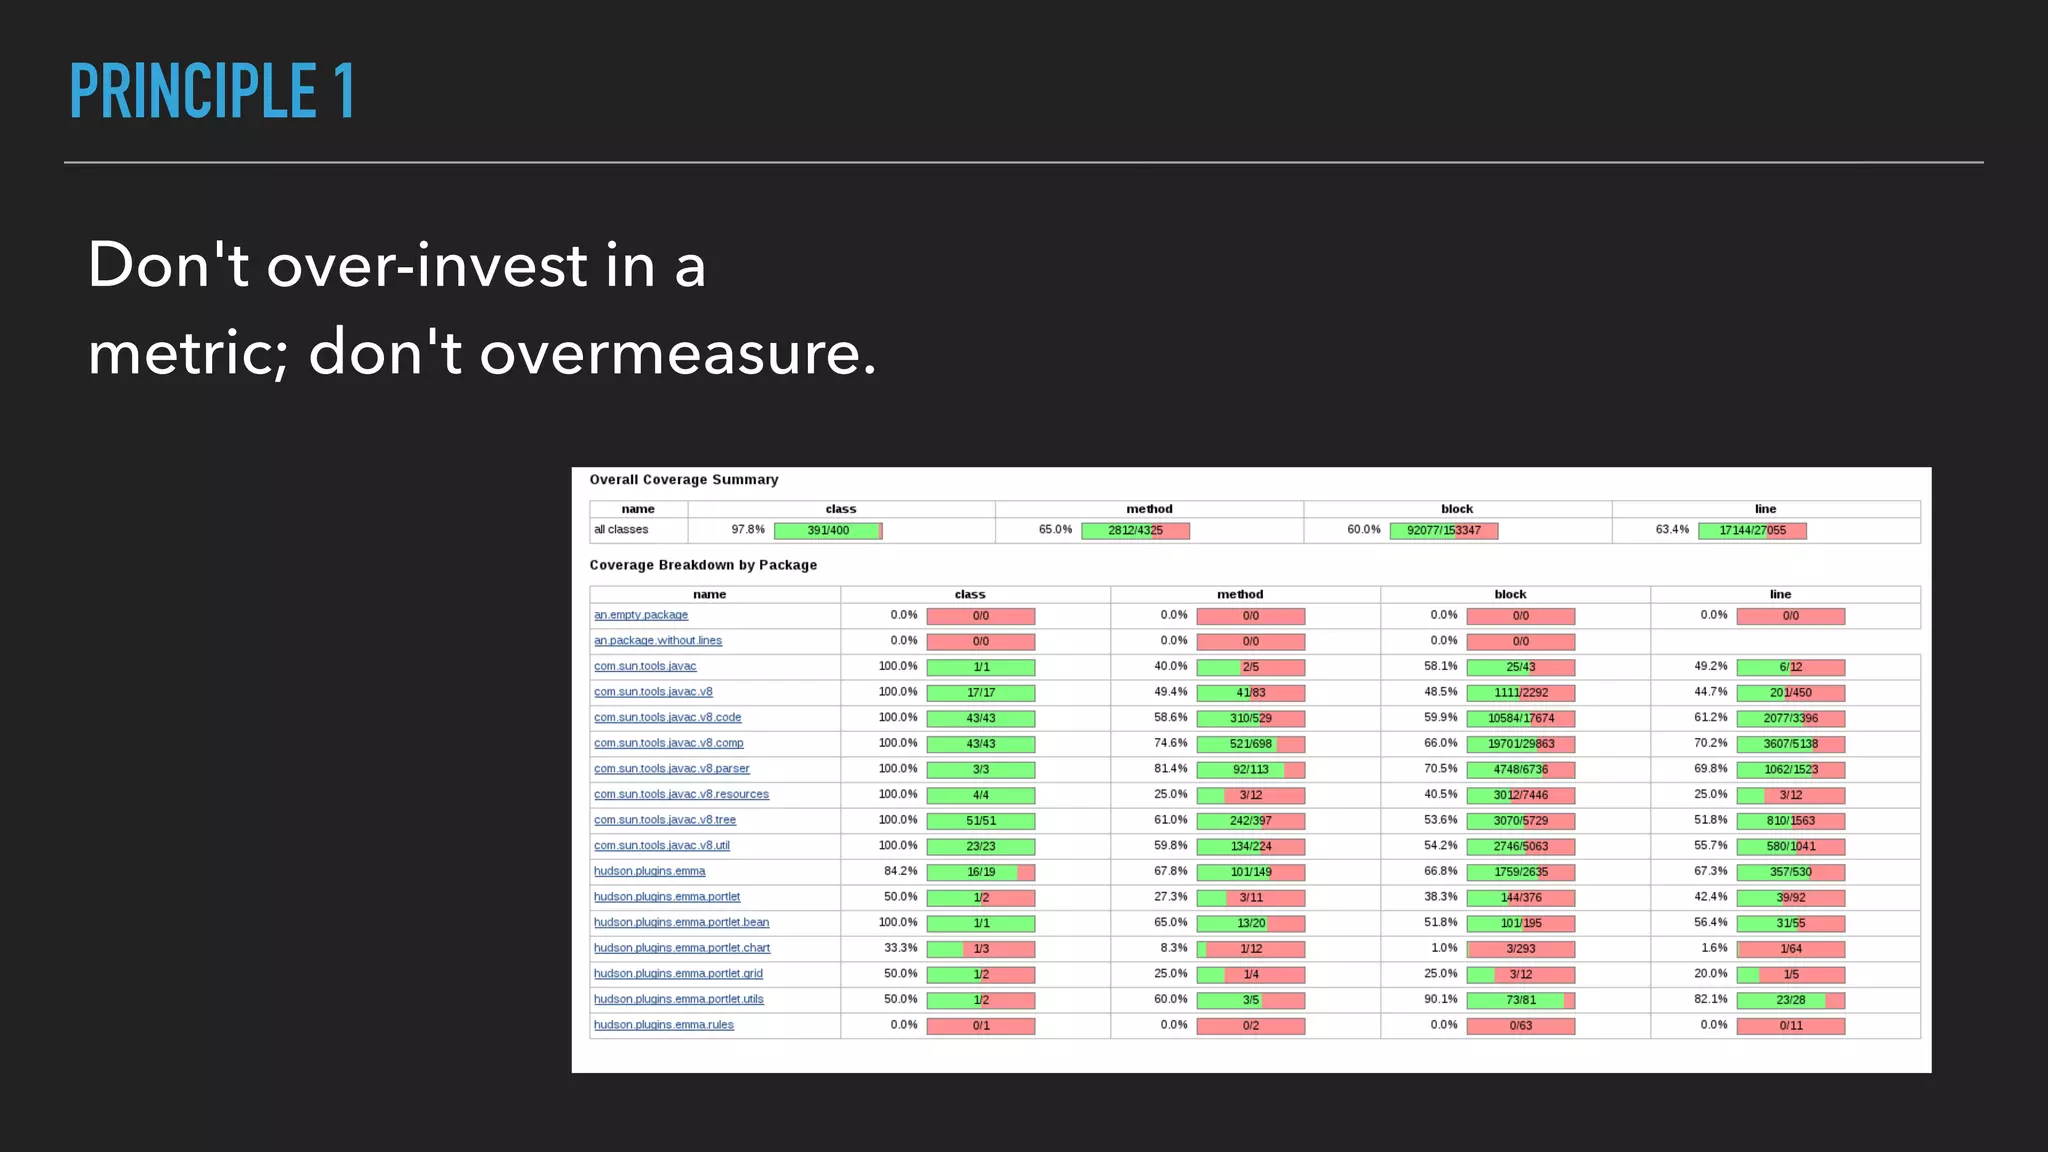
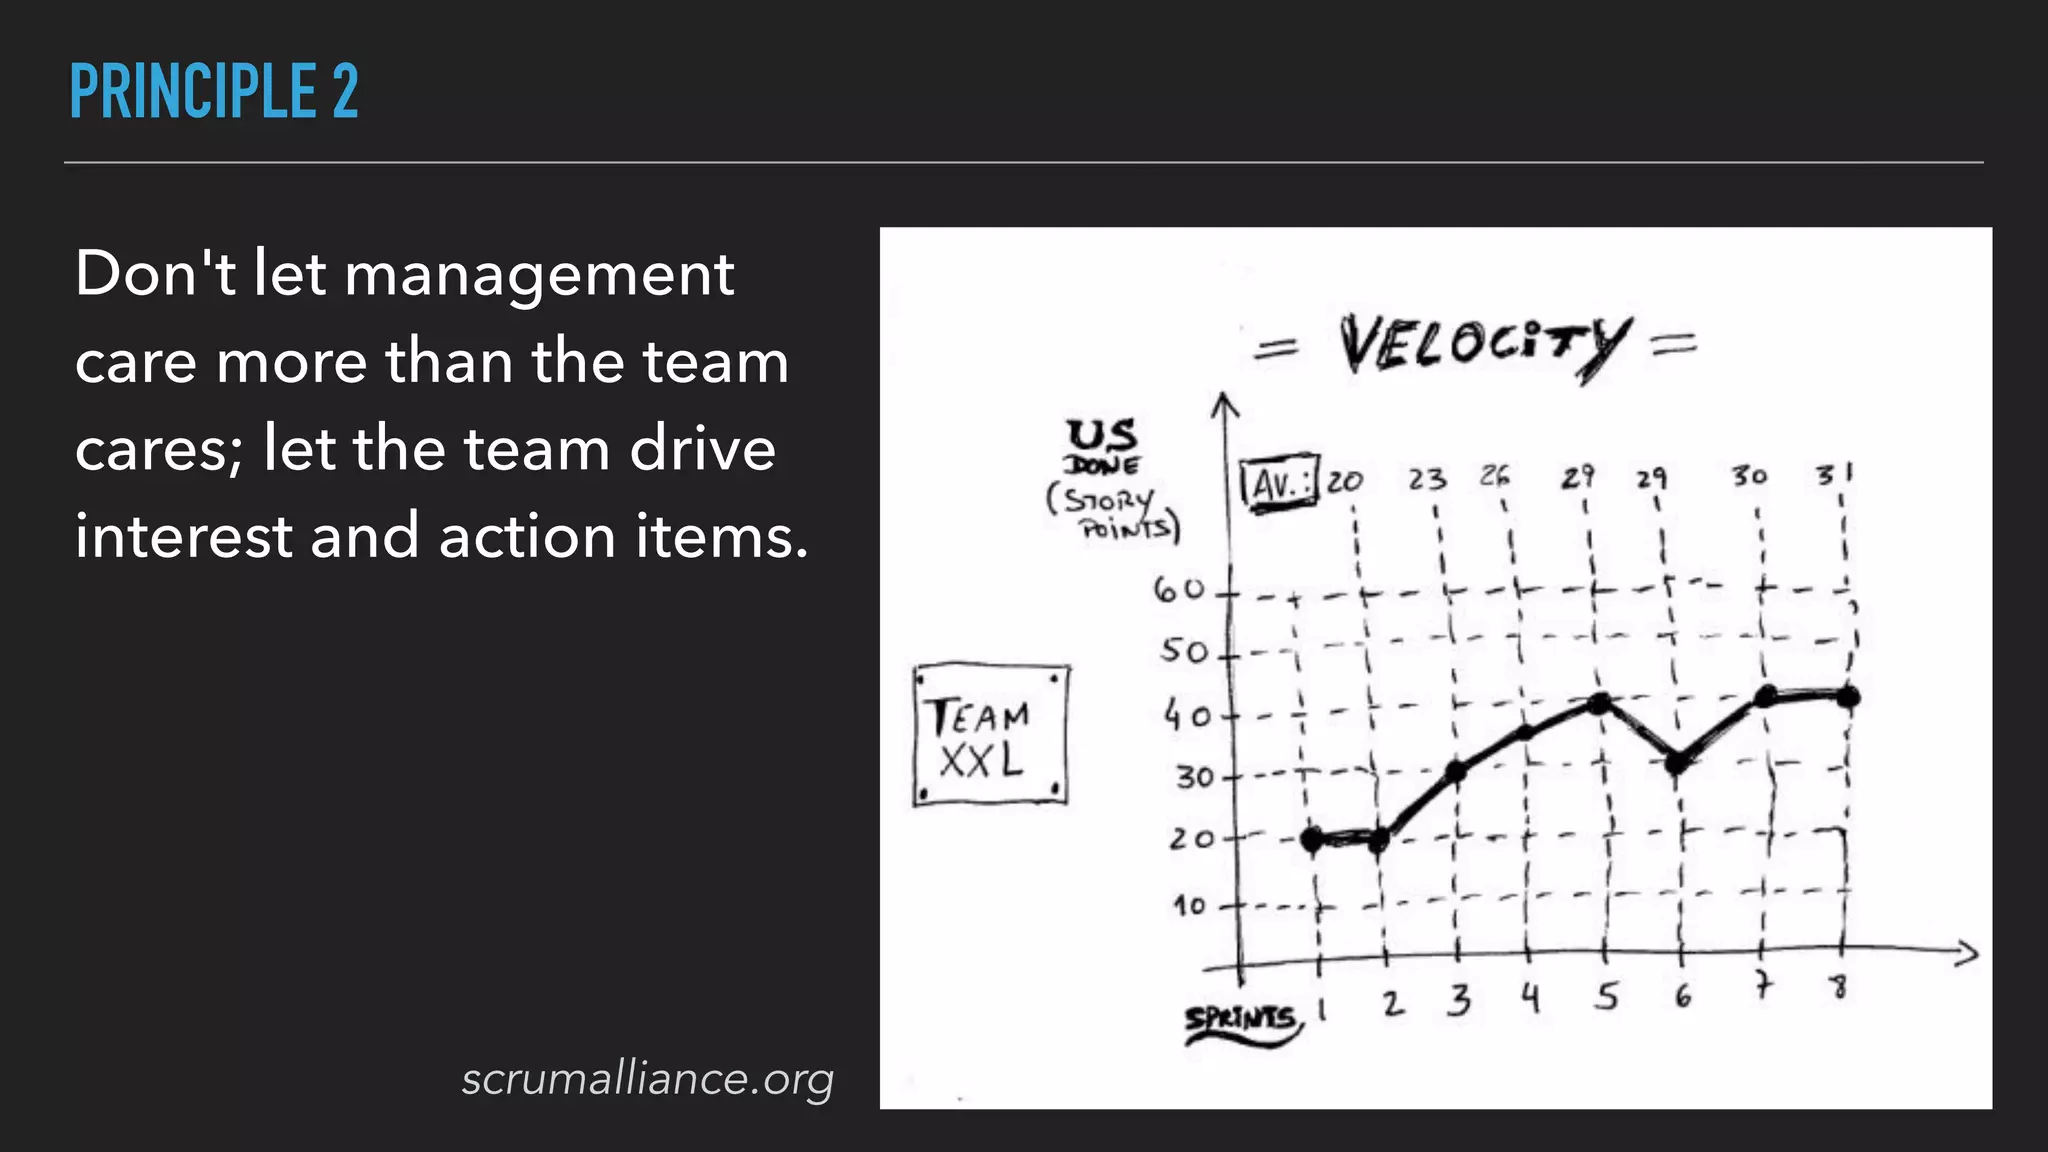


The document discusses the complexities and potential harms of using metrics in organizations, particularly emphasizing that many commonly used metrics can be harmful if they are the wrong ones. It outlines various types of metrics and essential test metrics while proposing rules for identifying good metrics that promote positive behavior without creating undue pressure. The importance of thoughtful metric application is highlighted, along with principles to ensure metrics serve their intended purpose without leading to negative consequences.


![[HCMC STC Jan 2015] How To Work Effectively As a Tester in Agile Teams](https://cdn.slidesharecdn.com/ss_thumbnails/anlehowtoworkeffectivelyasatesterinagileteams-150208211133-conversion-gate01-thumbnail.jpg?width=640&height=640&fit=bounds)


![[DSC Europe 25] Dusan Nesic - Securing Tomorrow’s Infrastructure: Why Cyber-P...](https://cdn.slidesharecdn.com/ss_thumbnails/qikbszfftyowjm2q6duw-1-251211083848-8f2ead6b-thumbnail.jpg?width=640&height=640&fit=bounds)
![[DSC Europe 25] Jon Dajci - Bridging TradFi and DeFi: Building the Future of ...](https://cdn.slidesharecdn.com/ss_thumbnails/fqmhfvlbqhkihjvqvhmu-7-251211083849-6af7e325-thumbnail.jpg?width=640&height=640&fit=bounds)


![[DSC Europe 25] Danica Soc - The Science Behind Marketing: Experimentation me...](https://cdn.slidesharecdn.com/ss_thumbnails/c0nofsggs9gw5ucmallr-3-251216103155-56bd64d1-thumbnail.jpg?width=640&height=640&fit=bounds)

![[DSC Europe 25] Jovan Bogicevic - Legacy to AI-Driven Defense: Transforming D...](https://cdn.slidesharecdn.com/ss_thumbnails/rsarluadt563hntyfc8q-3-251211083849-3e7bc4c0-thumbnail.jpg?width=640&height=640&fit=bounds)

![[DSC Europe 25] Miodrag Pesovic & Vladislav Radonjic - Federated Data Archite...](https://cdn.slidesharecdn.com/ss_thumbnails/gsbe3y5it5uhndi4e08e-1-251212103249-f1008e0c-thumbnail.jpg?width=640&height=640&fit=bounds)

