Download to read offline


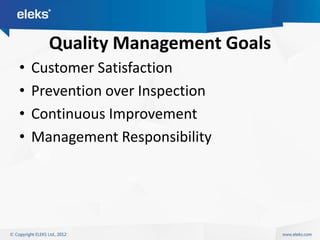


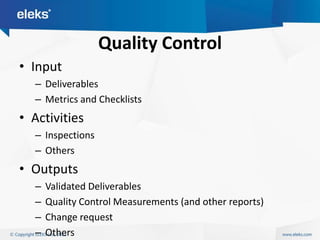


The document discusses quality management for project management. It defines quality, describes quality management goals like customer satisfaction and continuous improvement, and explains key quality management processes like quality planning, quality assurance, and quality control. Quality planning involves activities to develop quality management documentation. Quality assurance ensures processes are adequate, while quality control evaluates work products through inspections and testing to find defects. The document emphasizes the importance of metrics for quality assurance to track testing progress, defects, and determine release readiness.


