INDEX
INTRODUCTION
SPREADSHEET
FEATURES OF MS EXCEL
PURPOSE OF MS EXCEL
HOW TO ADD TABLES IN MS EXCEL?
SYNTAX IN MS EXCEL
SOME SYNTAX IN MS EXCEL
HOW TO INSERT ROWS AND COLUMNS IN MS EXCEL?
HOW TO INSERT CHARTS IN MS EXCEL?
HOW TO INSERT PICTURE IN MS EXCEL?
4.
INTRODUCTION :
Microsoft Excelis a powerful spreadsheet program created by Microsoft in 1985.
It allows you to record, manipulate, and store numeric data. Excel’s customizable
features make it a versatile tool for various tasks, including financial
calculations, data analysis, and graphical representation. If you’re new to Excel,
consider exploring tutorials or courses to learn its basics and enhance your skills.
Microsoft Excel has the basic features of all spreadsheets, using a grid
of cells arranged in numbered rows and letter-named columns to organize data
manipulations like arithmetic operations. It has a battery of supplied functions to
answer statistical, engineering, and financial needs.
5.
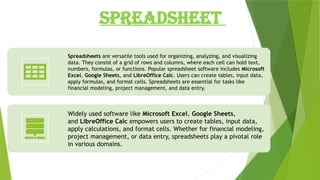
SPREADSHEET
Spreadsheets are versatiletools used for organizing, analyzing, and visualizing
data. They consist of a grid of rows and columns, where each cell can hold text,
numbers, formulas, or functions. Popular spreadsheet software includes Microsoft
Excel, Google Sheets, and LibreOffice Calc. Users can create tables, input data,
apply formulas, and format cells. Spreadsheets are essential for tasks like
financial modeling, project management, and data entry.
Widely used software like Microsoft Excel, Google Sheets,
and LibreOffice Calc empowers users to create tables, input data,
apply calculations, and format cells. Whether for financial modeling,
project management, or data entry, spreadsheets play a pivotal role
in various domains.
7.
FEATURES OF MSEXCEL:
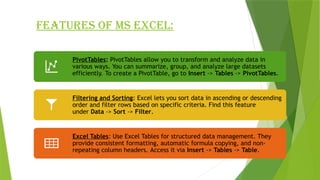
PivotTables: PivotTables allow you to transform and analyze data in
various ways. You can summarize, group, and analyze large datasets
efficiently. To create a PivotTable, go to Insert -> Tables -> PivotTables.
Filtering and Sorting: Excel lets you sort data in ascending or descending
order and filter rows based on specific criteria. Find this feature
under Data -> Sort -> Filter.
Excel Tables: Use Excel Tables for structured data management. They
provide consistent formatting, automatic formula copying, and non-
repeating column headers. Access it via Insert -> Tables -> Table.
9.
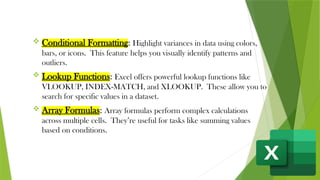
Conditional Formatting:Highlight variances in data using colors,
bars, or icons. This feature helps you visually identify patterns and
outliers.
Lookup Functions: Excel offers powerful lookup functions like
VLOOKUP, INDEX-MATCH, and XLOOKUP. These allow you to
search for specific values in a dataset.
Array Formulas: Array formulas perform complex calculations
across multiple cells. They’re useful for tasks like summing values
based on conditions.
10.
PURPOSE OF MSEXCEL:
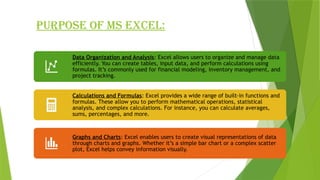
Data Organization and Analysis: Excel allows users to organize and manage data
efficiently. You can create tables, input data, and perform calculations using
formulas. It’s commonly used for financial modeling, inventory management, and
project tracking.
Calculations and Formulas: Excel provides a wide range of built-in functions and
formulas. These allow you to perform mathematical operations, statistical
analysis, and complex calculations. For instance, you can calculate averages,
sums, percentages, and more.
Graphs and Charts: Excel enables users to create visual representations of data
through charts and graphs. Whether it’s a simple bar chart or a complex scatter
plot, Excel helps convey information visually.
11.
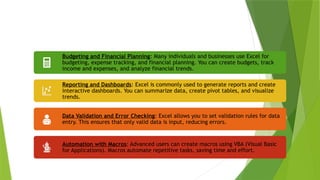
Budgeting and FinancialPlanning: Many individuals and businesses use Excel for
budgeting, expense tracking, and financial planning. You can create budgets, track
income and expenses, and analyze financial trends.
Reporting and Dashboards: Excel is commonly used to generate reports and create
interactive dashboards. You can summarize data, create pivot tables, and visualize
trends.
Data Validation and Error Checking: Excel allows you to set validation rules for data
entry. This ensures that only valid data is input, reducing errors.
Automation with Macros: Advanced users can create macros using VBA (Visual Basic
for Applications). Macros automate repetitive tasks, saving time and effort.
14.
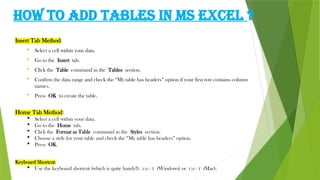
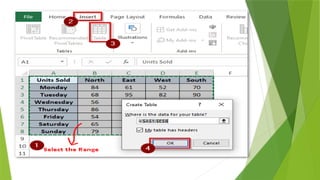
HOW TO ADDTABLES IN MS EXCEL ?
Insert Tab Method:
Select a cell within your data.
Go to the Insert tab.
Click the Table command in the Tables section.
Confirm the data range and check the “My table has headers” option if your first row contains column
names.
Press OK to create the table.
Home Tab Method:
Select a cell within your data.
Go to the Home tab.
Click the Format as Table command in the Styles section.
Choose a style for your table and check the “My table has headers” option.
Press OK.
Keyboard Shortcut:
Use the keyboard shortcut (which is quite handy!): Ctrl + T (Windows) or Ctrl + T (Mac).
16.
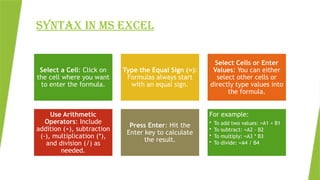
SYNTAX IN MSEXCEL
Select a Cell: Click on
the cell where you want
to enter the formula.
Type the Equal Sign (=):
Formulas always start
with an equal sign.
Select Cells or Enter
Values: You can either
select other cells or
directly type values into
the formula.
Use Arithmetic
Operators: Include
addition (+), subtraction
(-), multiplication (*),
and division (/) as
needed.
Press Enter: Hit the
Enter key to calculate
the result.
For example:
• To add two values: =A1 + B1
• To subtract: =A2 - B2
• To multiply: =A3 * B3
• To divide: =A4 / B4
17.
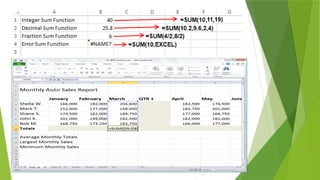
SOME SYNTAX FUNCTION
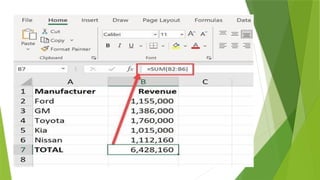
•Adds up a range of numbers.
• Syntax: =SUM(number1, [number2], ...)
• Example: =SUM(A1:A10) calculates the sum of
values in cells A1 to A10.
SUM
Function:
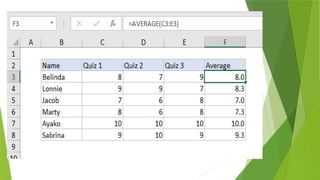
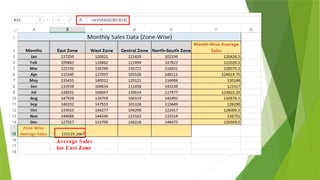
• Calculates the average of a range of numbers.
• Syntax: =AVERAGE(number1, [number2], ...)
• Example: =AVERAGE(B1:B5) computes the
average of values in cells B1 to B5.
AVERAGE
Function:
22.
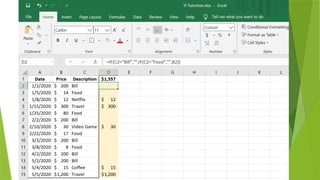
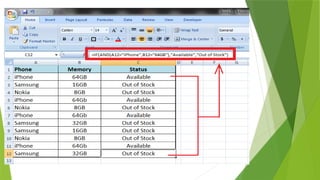
3. IF Function:
•Performs conditional checks and returns different values based on a
condition.
• Syntax: =IF(logical test, value if true, value if false)
• Example: =IF(C1>50, "Pass", "Fail") checks if the value in C1 is
greater than 50 and returns “Pass” or “Fail” accordingly.
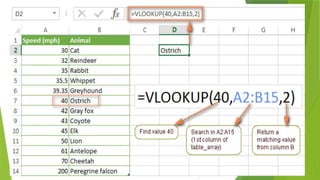
4. VLOOKUP Function:
• Searches for a value in the first column of a table and returns a
corresponding value from another column.
• Syntax: =VLOOKUP(lookup value, table array, col index num,
[range lookup])
• Example: =VLOOKUP(D1, A1:B10, 2, FALSE) looks up the value
in D1 within the range A1:B10 and returns the corresponding value
from the second column.
26.
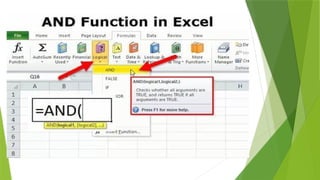
5. AND FUNCTION
•Theformula for the AND function is: =AND(logical1, [logical2], ...).
•logical1 is the first condition to evaluate, and [logical2] (optional) repr
esents additional conditions
2
.
Example:
Suppose you want to check if a value in cell A2 is greater than
1 AND less than 100. You can use: =AND(A2>1, A2<100).
If both conditions are true, it displays TRUE; otherwise, it shows FALSE.
You can also combine AND with other functions, like IF:
=IF(AND(A2<A3, A2<100), A2, "The value is out of range")
28.
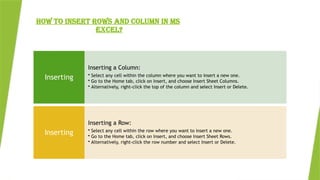
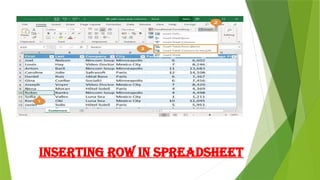
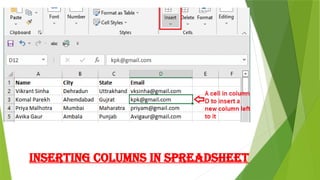
HOW TO INSERTROWS AND COLUMN IN MS
EXCEL?
Inserting a Column:
• Select any cell within the column where you want to insert a new one.
• Go to the Home tab, click on Insert, and choose Insert Sheet Columns.
• Alternatively, right-click the top of the column and select Insert or Delete.
Inserting
Inserting a Row:
• Select any cell within the row where you want to insert a new one.
• Go to the Home tab, click on Insert, and choose Insert Sheet Rows.
• Alternatively, right-click the row number and select Insert or Delete.
Inserting
HOW TO INSERTCHARTS IN MS EXCEL ?
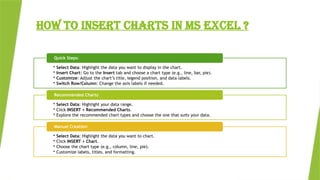
• Select Data: Highlight the data you want to display in the chart.
• Insert Chart: Go to the Insert tab and choose a chart type (e.g., line, bar, pie).
• Customize: Adjust the chart’s title, legend position, and data labels.
• Switch Row/Column: Change the axis labels if needed.
Quick Steps:
• Select Data: Highlight your data range.
• Click INSERT > Recommended Charts.
• Explore the recommended chart types and choose the one that suits your data.
Recommended Charts:
• Select Data: Highlight the data you want to chart.
• Click INSERT > Chart.
• Choose the chart type (e.g., column, line, pie).
• Customize labels, titles, and formatting.
Manual Creation:
33.
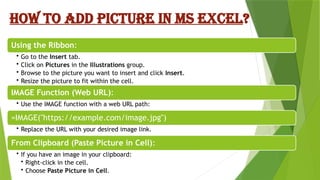
HOW TO ADDPICTURE IN MS EXCEL?
Using the Ribbon:
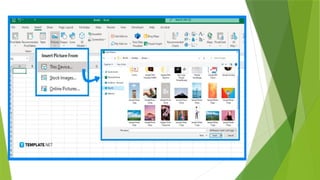
• Go to the Insert tab.
• Click on Pictures in the Illustrations group.
• Browse to the picture you want to insert and click Insert.
• Resize the picture to fit within the cell.
IMAGE Function (Web URL):
• Use the IMAGE function with a web URL path:
=IMAGE("https://example.com/image.jpg")
• Replace the URL with your desired image link.
From Clipboard (Paste Picture in Cell):
• If you have an image in your clipboard:
• Right-click in the cell.
• Choose Paste Picture in Cell.


![SOME SYNTAX FUNCTION
• Adds up a range of numbers.
• Syntax: =SUM(number1, [number2], ...)
• Example: =SUM(A1:A10) calculates the sum of
values in cells A1 to A10.
SUM
Function:
• Calculates the average of a range of numbers.
• Syntax: =AVERAGE(number1, [number2], ...)
• Example: =AVERAGE(B1:B5) computes the
average of values in cells B1 to B5.
AVERAGE
Function:](https://image.slidesharecdn.com/jatinjainexcelppt-260205174114-ecb674bf/85/PRESENTATION-ON-MS-EXCEL-ON-ITT-COURSE-FROM-GHAZIABAD-17-320.jpg)
![3. IF Function:
• Performs conditional checks and returns different values based on a
condition.
• Syntax: =IF(logical test, value if true, value if false)
• Example: =IF(C1>50, "Pass", "Fail") checks if the value in C1 is
greater than 50 and returns “Pass” or “Fail” accordingly.
4. VLOOKUP Function:
• Searches for a value in the first column of a table and returns a
corresponding value from another column.
• Syntax: =VLOOKUP(lookup value, table array, col index num,
[range lookup])
• Example: =VLOOKUP(D1, A1:B10, 2, FALSE) looks up the value
in D1 within the range A1:B10 and returns the corresponding value
from the second column.](https://image.slidesharecdn.com/jatinjainexcelppt-260205174114-ecb674bf/85/PRESENTATION-ON-MS-EXCEL-ON-ITT-COURSE-FROM-GHAZIABAD-22-320.jpg)
![5. AND FUNCTION
•The formula for the AND function is: =AND(logical1, [logical2], ...).
•logical1 is the first condition to evaluate, and [logical2] (optional) repr
esents additional conditions
2
.
Example:
Suppose you want to check if a value in cell A2 is greater than
1 AND less than 100. You can use: =AND(A2>1, A2<100).
If both conditions are true, it displays TRUE; otherwise, it shows FALSE.
You can also combine AND with other functions, like IF:
=IF(AND(A2<A3, A2<100), A2, "The value is out of range")](https://image.slidesharecdn.com/jatinjainexcelppt-260205174114-ecb674bf/85/PRESENTATION-ON-MS-EXCEL-ON-ITT-COURSE-FROM-GHAZIABAD-26-320.jpg)