Download as PDF, PPTX


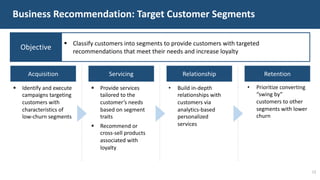


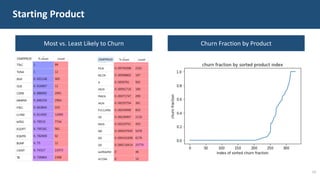

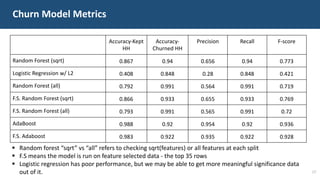
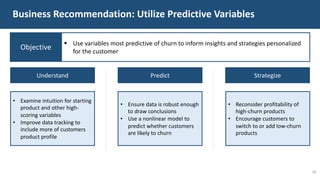

The document details a customer churn analysis and prediction project for Fulton Bank, aiming to segment customers and predict churn using consumer data. It discusses data processing, feature scoring, and various unsupervised learning techniques for segmentation, ultimately providing business recommendations for targeting customers based on their behaviors and traits. The predictive model design and its performance metrics are also outlined, emphasizing personalized strategies to enhance customer retention.