Download as PDF, PPTX
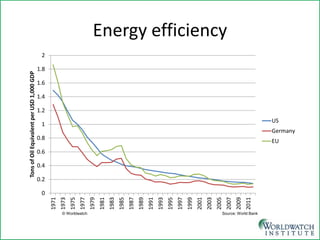
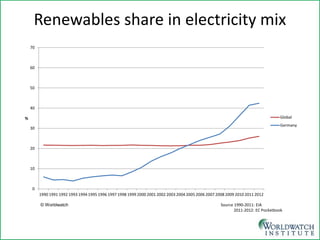
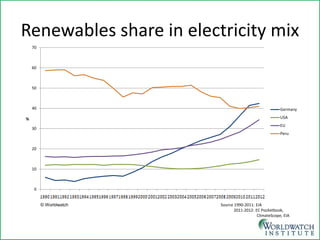
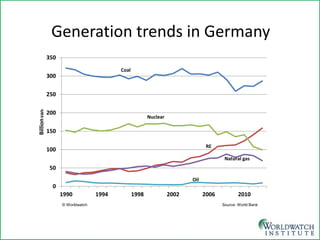

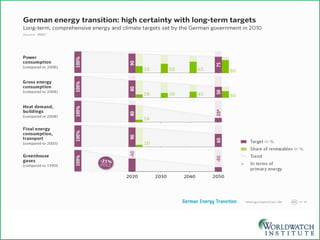
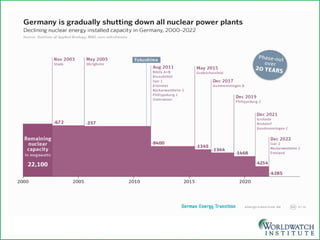
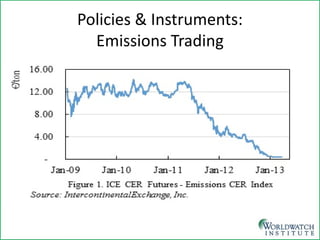
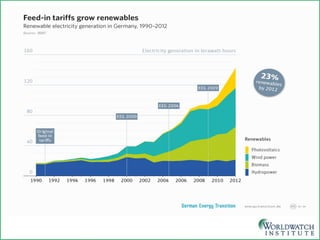
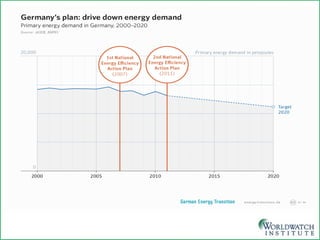
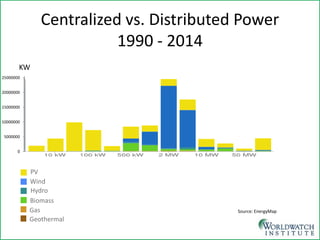
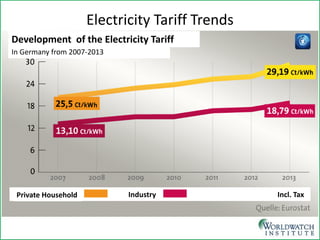
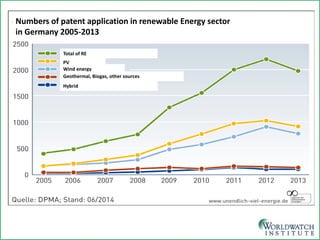
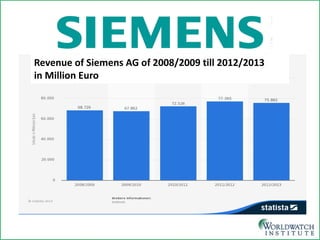
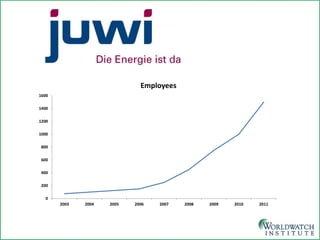


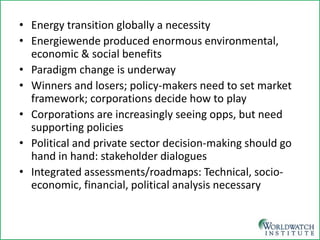


The document discusses Germany's energy transition, highlighting trends, enablers, and impacts of distributed energy systems. Key takeaways include the necessity for global energy transitions, the significant environmental and economic benefits realized, and the need for integrated policies to support this paradigm shift. It also emphasizes the importance of research, stakeholder dialogues, and the development of new business models to ensure sustainable energy practices.


