Download to read offline


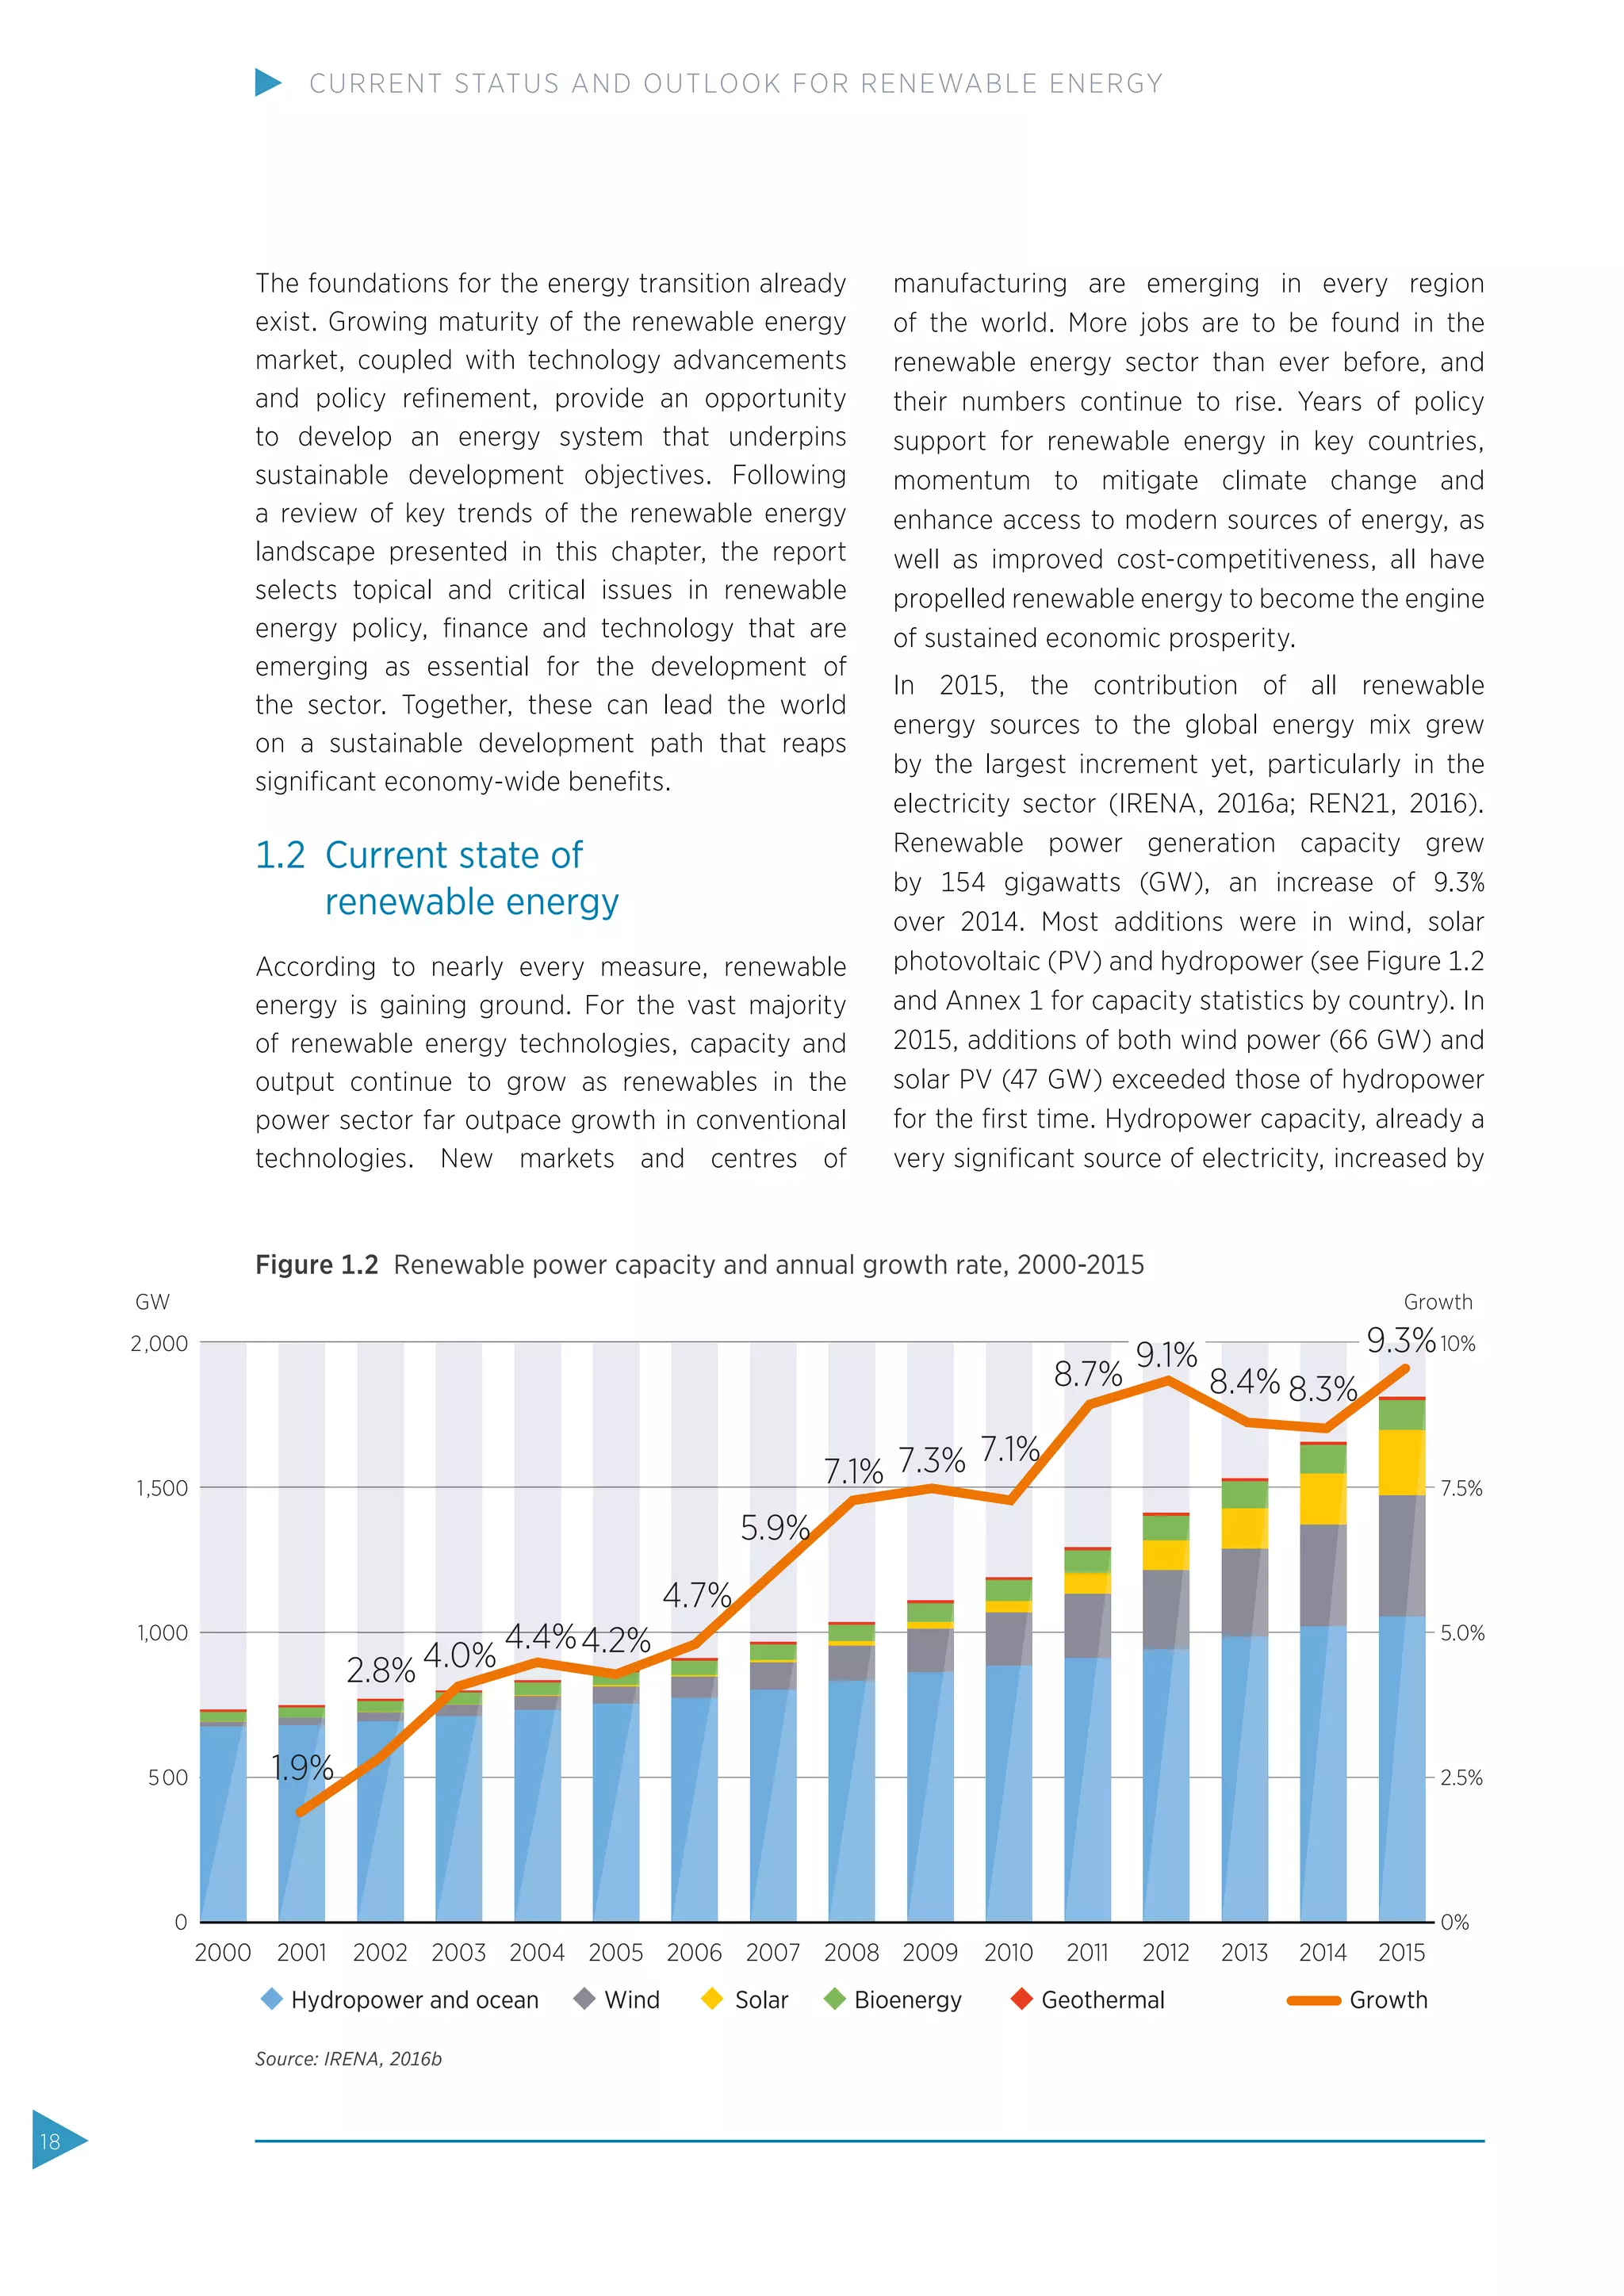
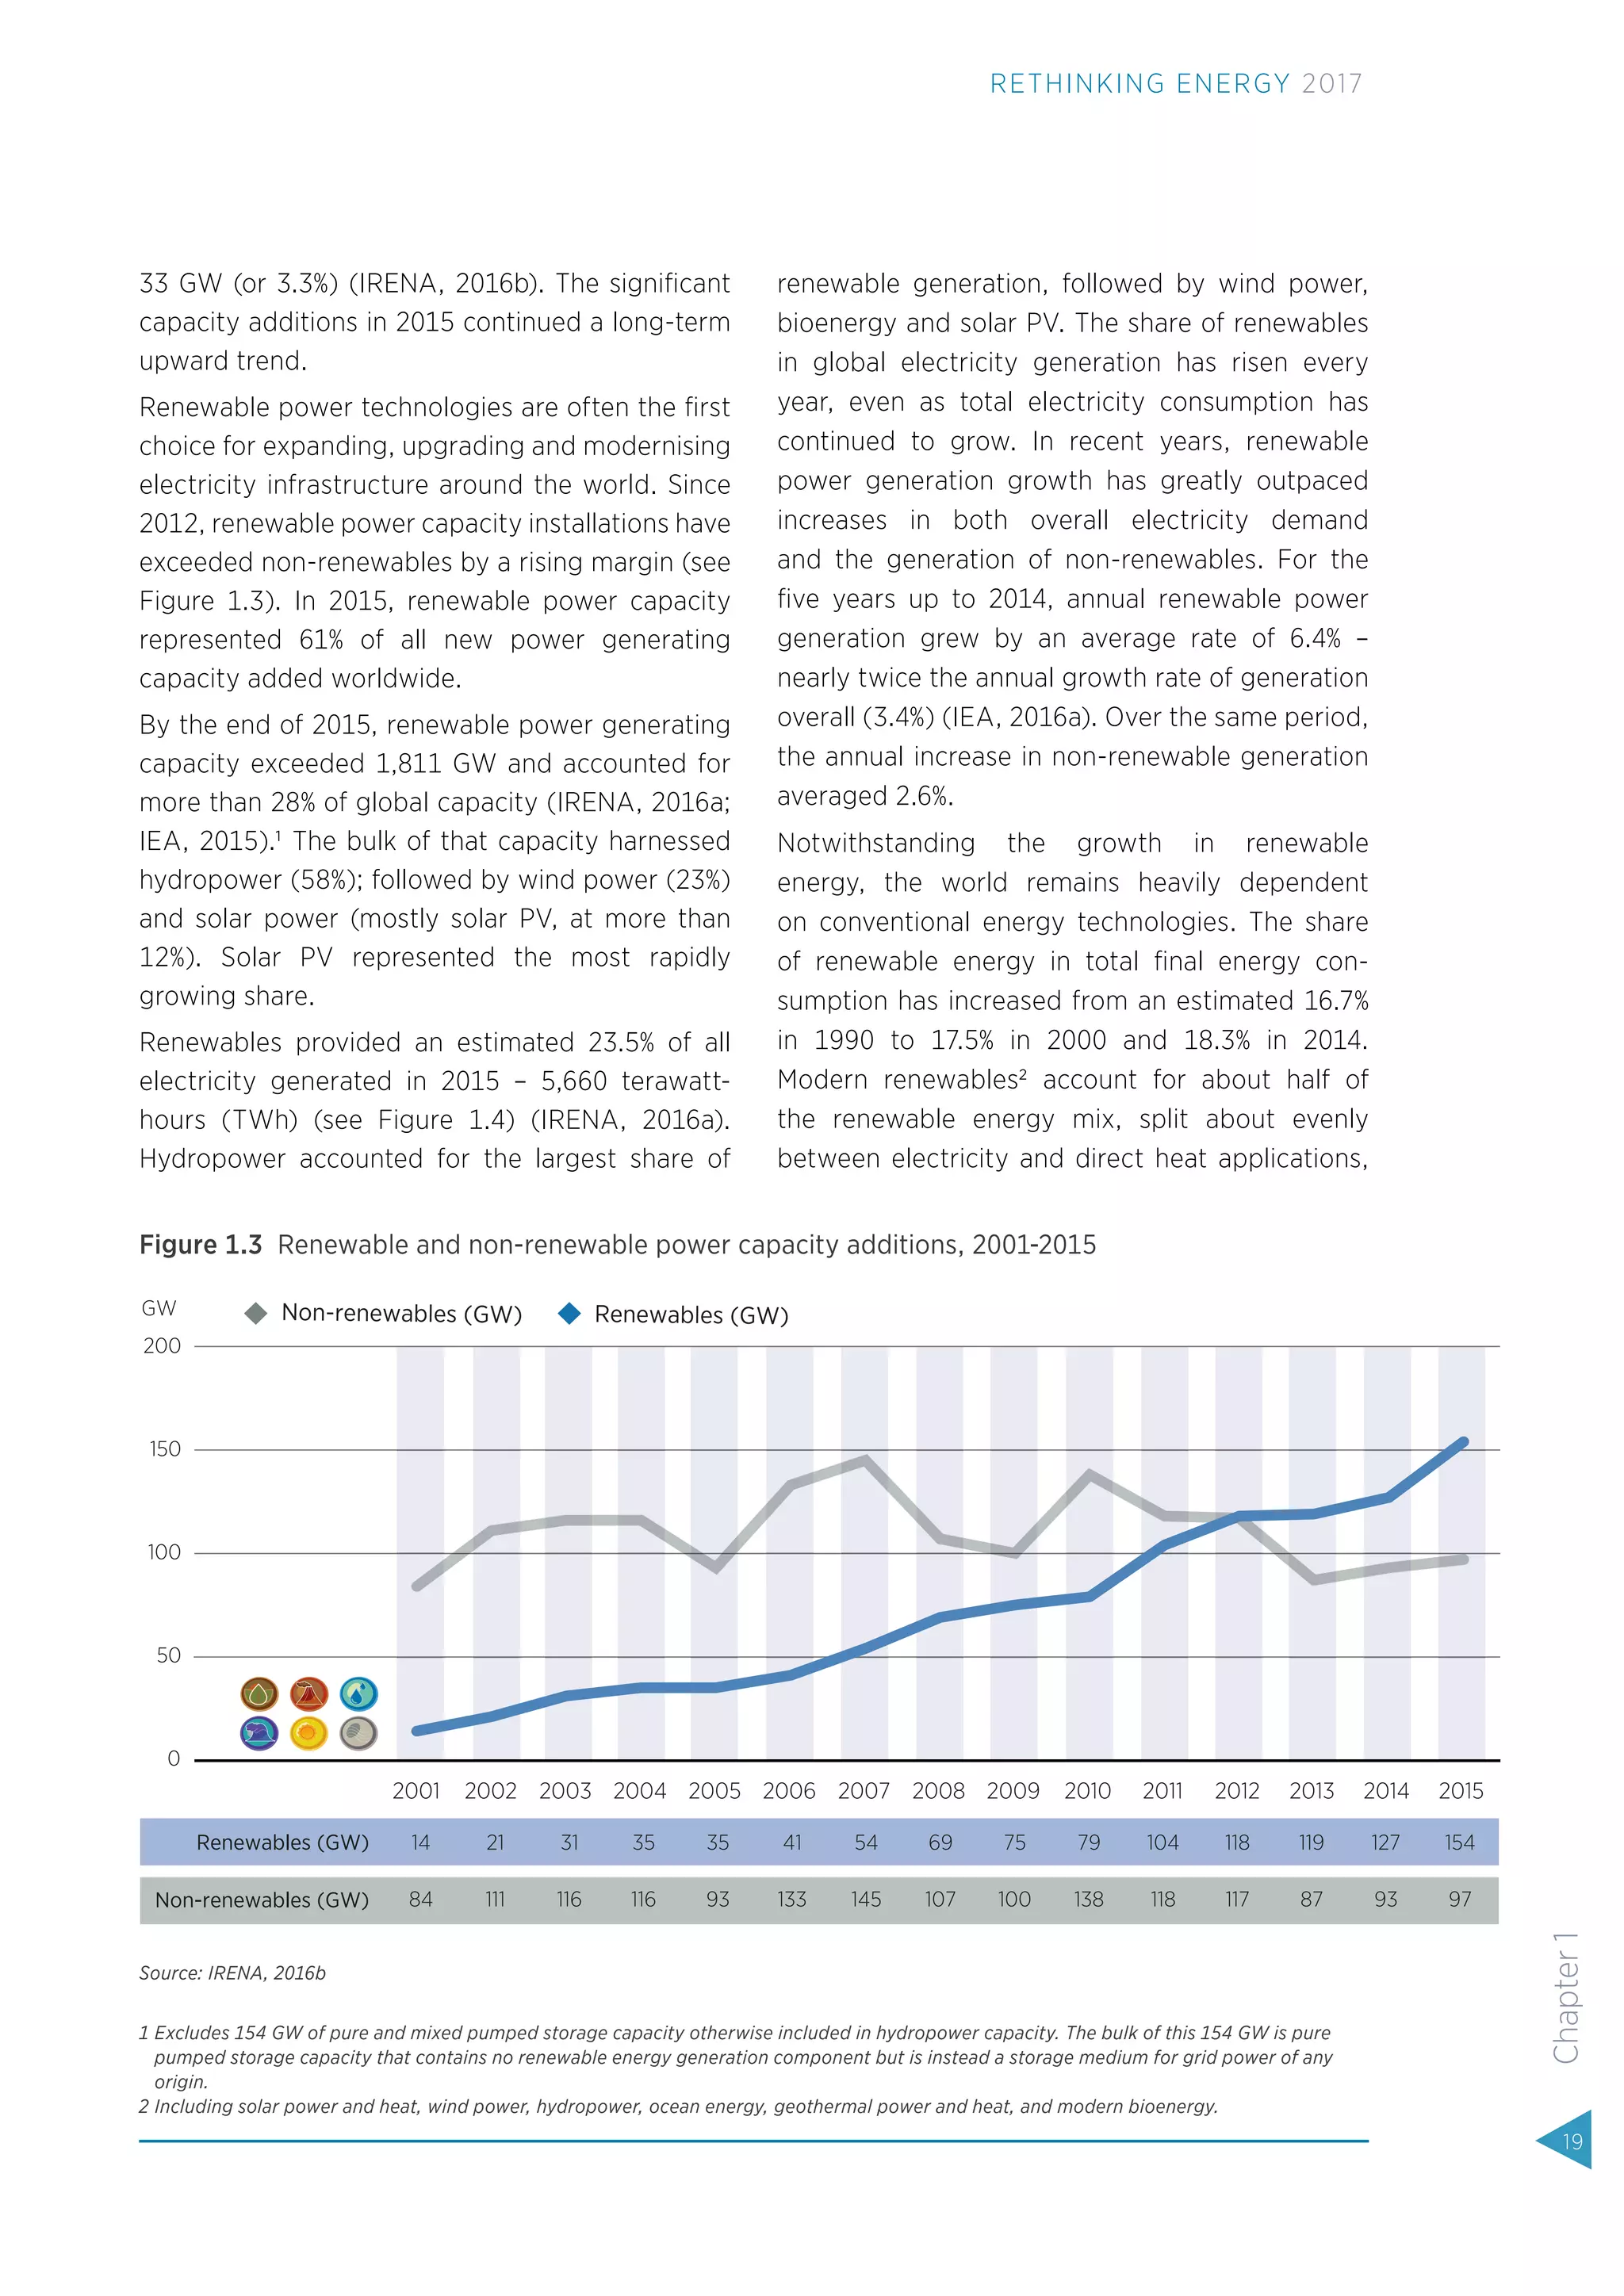
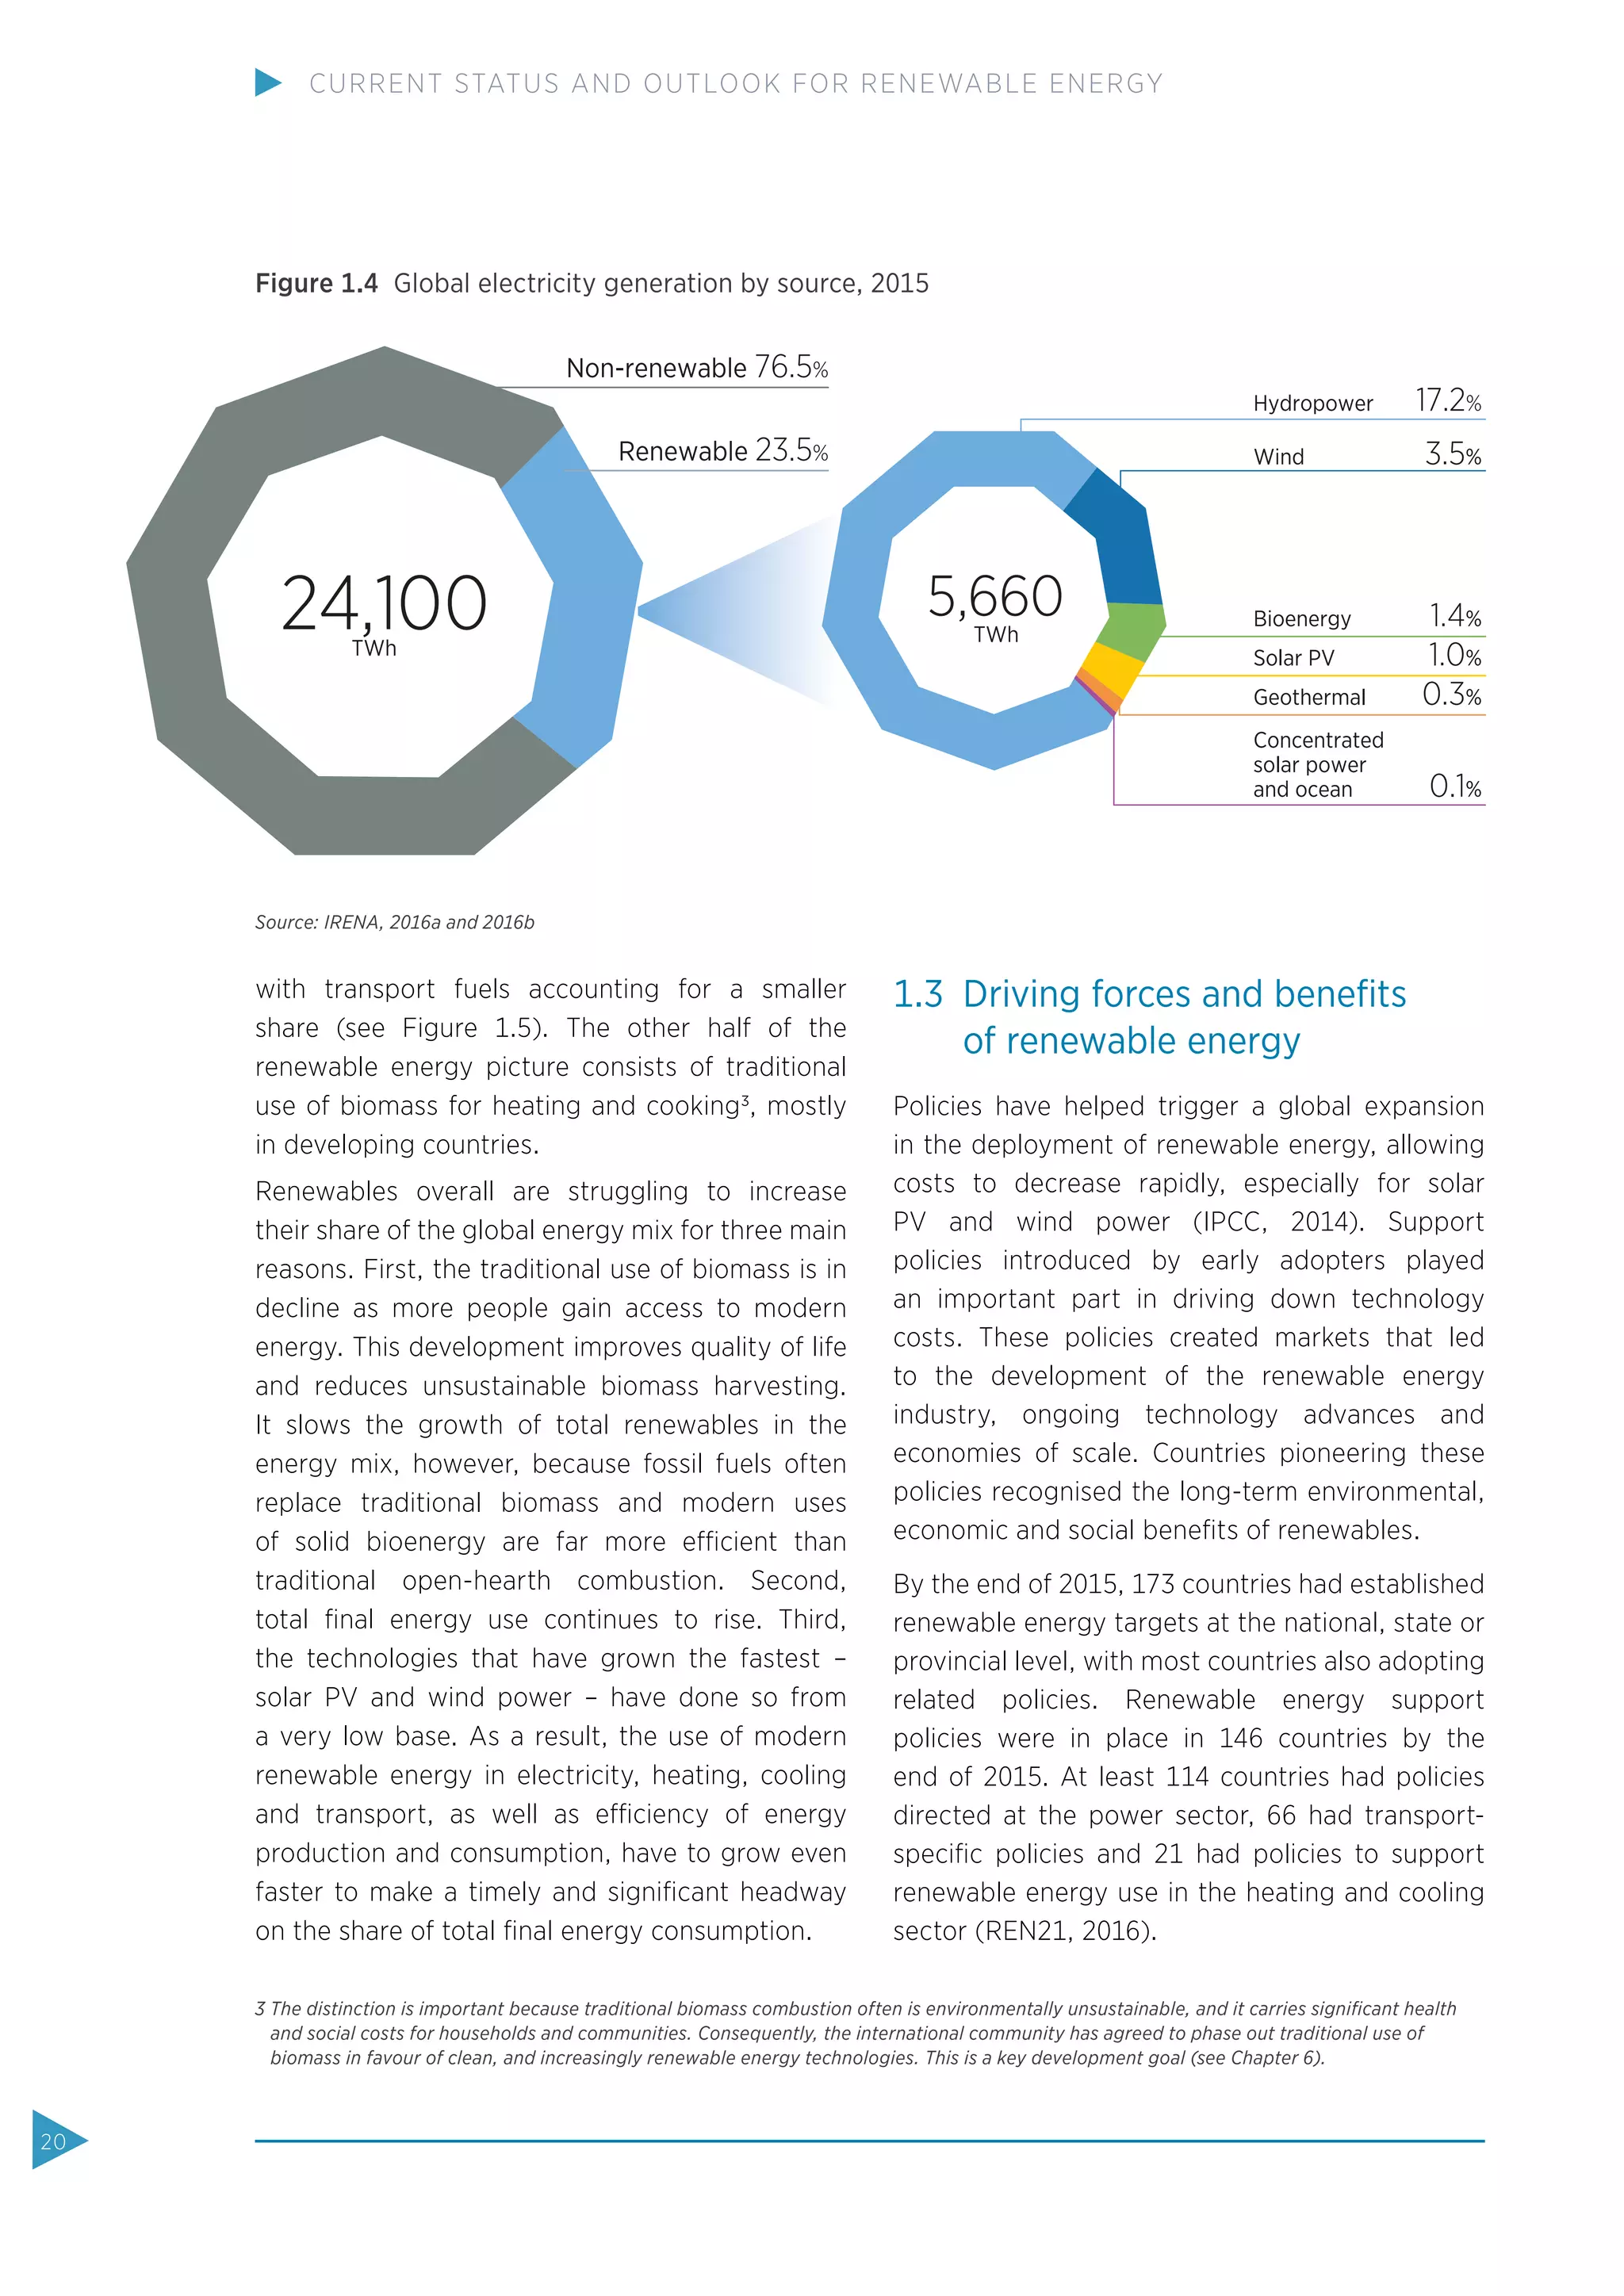
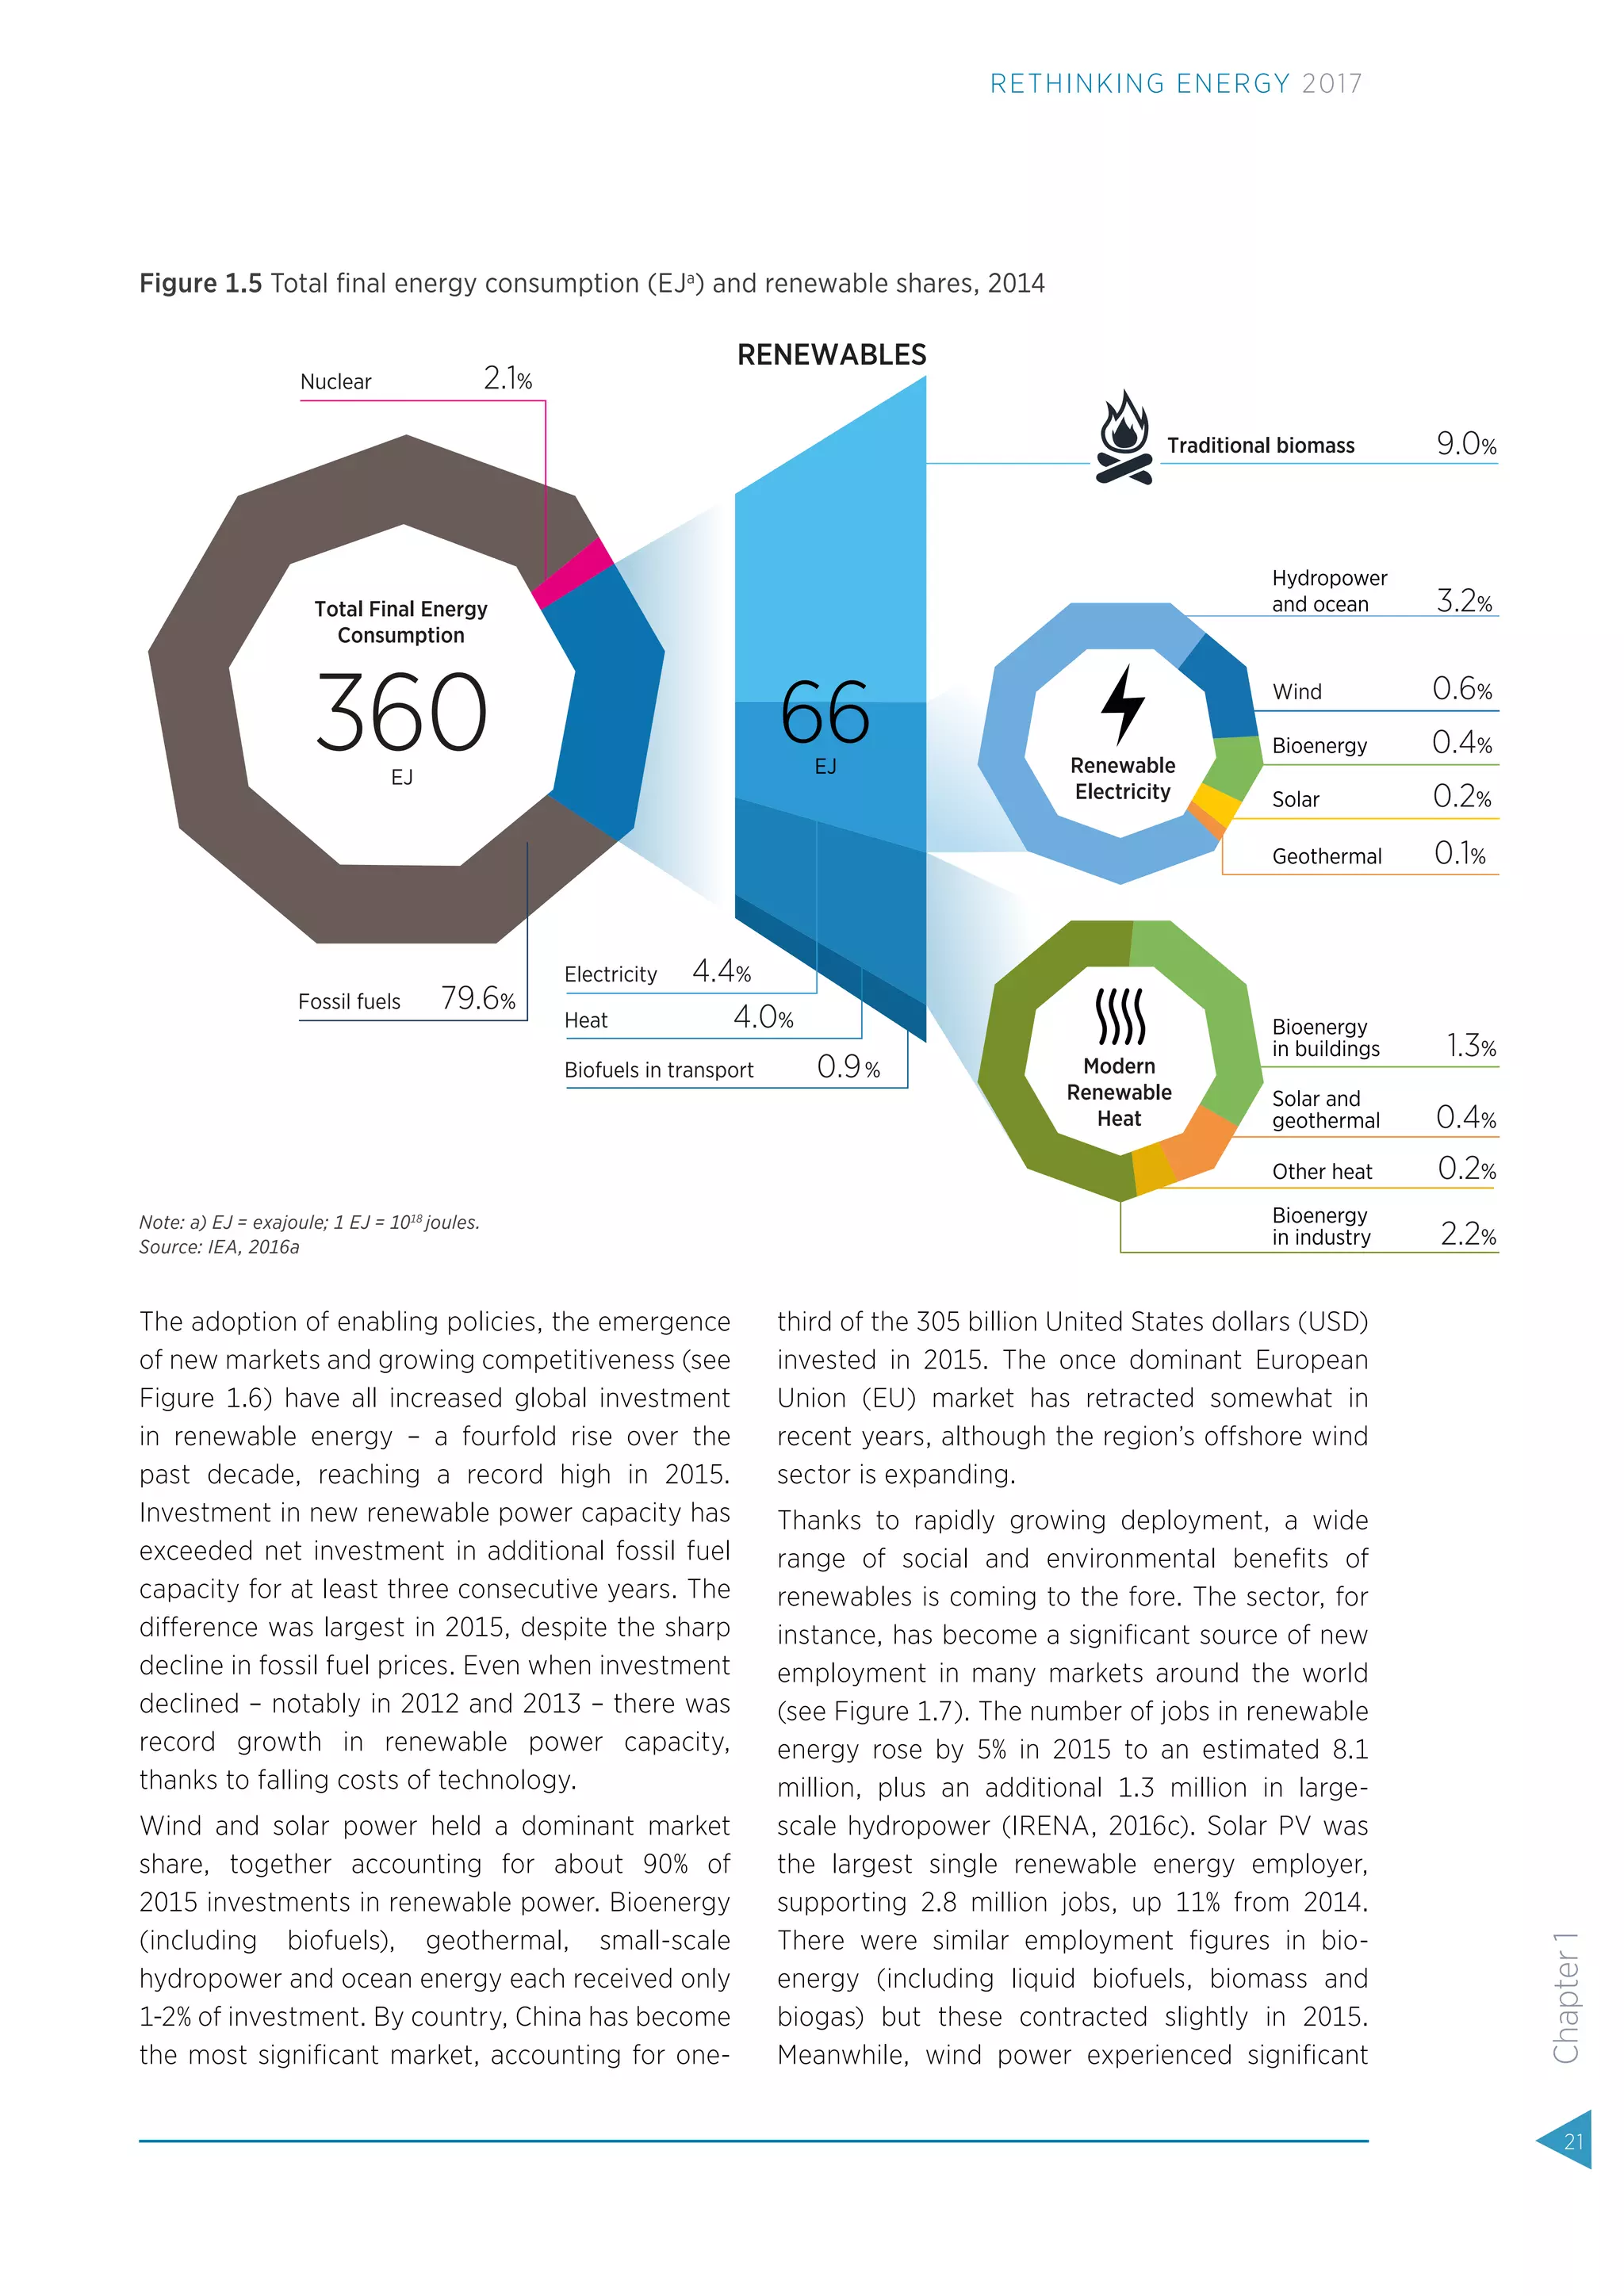


Renewable energy capacity and generation has grown significantly in recent years due to supportive policies, falling technology costs, and environmental and energy security benefits. However, further major increases in renewable energy deployment are needed to meet climate and sustainable development goals. Bridging this gap will require enhanced policy frameworks, financing mechanisms, and continued technology innovation to further reduce costs. Accelerating the global energy transformation through increased renewable energy adoption presents both opportunities and challenges going forward.


