Sanjivani Rural EducationSociety’s
Sanjivani College of Engineering, Kopargaon-423 603
(An Autonomous Institute, Affiliated to Savitribai Phule Pune University, Pune)
NACC ‘A’ Grade Accredited, ISO 9001:2015 Certified
Department of Computer Engineering
(NBA Accredited)
Prof. S.A.Shivarkar
Assistant Professor
Contact No.8275032712
Email- shivarkarsandipcomp@sanjivani.org.in
Subject- Foundation of Data Science (PECO311B)
2.
DEPARTMENT OF COMPUTERENGINEERING, Sanjivani COE, Kopargaon 2
Content
Defining data science and big data, Recognizing the different types
of data, Gaining insight into the data science process, Data Science
Process: Overview, Different steps, Machine Learning Definition and
Relation with Data Science.
STATISTICS AND PROBABILITY FOR DATA SCIENCE: Introduction to
Statistics, Terminologies in Statistics-Statistics for Data Science,
Types of Analysis: Qualitative analysis, Quantitative analysis,
Predictive analysis, Descriptive analysis.
Probability : Dependence and Independence, Conditional
Probability, Bayes’s Theorem, Random Variables: Discrete random
variable, Continuous random variable.
3.
DEPARTMENT OF COMPUTERENGINEERING, Sanjivani COE, Kopargaon 3
Content
MEASURES OF DATA: SCALE, TENDENCY, VARIATION, SHAPE : Data
measurements scale: nominal scale,ordinal scale, interval scale,
ratio scale. Measures of central tendency: mean, median, mode,
Percentile, decile, quartile. Measures of variation: range, inter-
quartile distance, variance and standard deviation. Measures of
shape: skewness and kurtosis.
MATHEMATICAL DISTRIBUTIONS :Normal distribution, Binomial
distribution, Poisson distribution, Exponential distribution,
Sampling and Estimation: Population and sampling, Central Limit
Theorem(CLT)
4.
DEPARTMENT OF COMPUTERENGINEERING, Sanjivani COE, Kopargaon 4
Content
HYPOTHESIS TESTING AND DATA VISUALIZATION : Hypothesis
Testing: Sampling distribution, null hypothesis, alternate
hypothesis, testing of hypothesis, Type I error, Type II error, T-test,
F-test, Chi-square test, Analysis of variance(ANOVA),
Data Visualization: Describing data relationship, Importing and
visualization using Matplotlib/Seaborn python library: Bar charts,
Pie charts, Line plots, Scatter plots, Histograms, Exploratory data
Analysis(EDA) using Pandas library,
5.
DEPARTMENT OF COMPUTERENGINEERING, Sanjivani COE, Kopargaon 5
Why Data Mining
“We are living in the information age” is popular saying, but actually living in the data age.
The Explosive Growth of Data: from terabytes to petabytes pour into computer networks by
www, various data storage devices everyday from business, society, science and engineering,
medicine and almost every other aspect of daily life.
Data collection and data availability
Automated data collection tools, database systems, Web, computerized society
Major sources of abundant data
Business: Web, e-commerce, transactions, stocks, …
Science: Remote sensing, bioinformatics, scientific simulation, …
Society and everyone: news, digital cameras, YouTube
We are drowning in data, but starving for knowledge!
“Necessity is the mother of invention”—Data mining—Automated analysis of massive data sets
6.
DEPARTMENT OF COMPUTERENGINEERING, Sanjivani COE, Kopargaon 6
How Data Mining turns large collection of data into knowledge
A search engine e.g.,Google receives hundreds of millions of queries every day can be viewed as a
transaction where the user describes her or his information need.
What novel and useful knowledge can a search engine learn from such a huge collection of queries
collected from users over time?
Interestingly, some patterns found in user search queries can disclose invaluable knowledge that
cannot be obtained by reading individual data items alone. For example, Google’s Flu Trends uses
specific search terms as indicators of flu activity.
It found a close relationship between the number of people who search for flu-related information
and the number of people who actually have flu symptoms.
A pattern emerges when all of the search queries related to flu are aggregated.
Using aggregated Google search data, Flu Trends can estimate flu activity up to two weeks faster
than traditional systems can.
This example shows how data mining can turn a large collection of data into knowledge that can
help meet a current global challenge.
7.
DEPARTMENT OF COMPUTERENGINEERING, Sanjivani COE, Kopargaon 7
Evolution of Sciences
Before 1600, empirical science
1600-1950s, theoretical science
Each discipline has grown a theoretical component. Theoretical models often motivate experiments and
generalize our understanding.
1950s-1990s, computational science
Over the last 50 years, most disciplines have grown a third, computational branch (e.g. empirical,
theoretical, and computational ecology, or physics, or linguistics.)
Computational Science traditionally meant simulation. It grew out of our inability to find closed-form
solutions for complex mathematical models.
1990-now, data science
The flood of data from new scientific instruments and simulations
The ability to economically store and manage petabytes of data online
The Internet and computing Grid that makes all these archives universally accessible
Scientific info. management, acquisition, organization, query, and visualization tasks scale almost linearly
with data volumes. Data mining is a major new challenge!
Jim Gray and Alex Szalay, The World Wide Telescope: An Archetype for Online Science, Comm. ACM, 45(11):
50-54, Nov. 2002
8.
DEPARTMENT OF COMPUTERENGINEERING, Sanjivani COE, Kopargaon 8
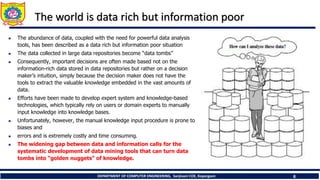
The world is data rich but information poor
The abundance of data, coupled with the need for powerful data analysis
tools, has been described as a data rich but information poor situation
The data collected in large data repositories become “data tombs”
Consequently, important decisions are often made based not on the
information-rich data stored in data repositories but rather on a decision
maker’s intuition, simply because the decision maker does not have the
tools to extract the valuable knowledge embedded in the vast amounts of
data.
Efforts have been made to develop expert system and knowledge-based
technologies, which typically rely on users or domain experts to manually
input knowledge into knowledge bases.
Unfortunately, however, the manual knowledge input procedure is prone to
biases and
errors and is extremely costly and time consuming.
The widening gap between data and information calls for the
systematic development of data mining tools that can turn data
tombs into “golden nuggets” of knowledge.
9.
DEPARTMENT OF COMPUTERENGINEERING, Sanjivani COE, Kopargaon 9
What is Data Mining
Data mining (knowledge discovery from data)
Extraction of interesting (non-trivial, implicit, previously unknown and potentially
useful) patterns or knowledge from huge amount of data
Data mining: a misnomer?
Alternative names
Knowledge discovery (mining) in databases (KDD), knowledge extraction,
data/pattern analysis, data archeology, data dredging, information harvesting,
business intelligence, etc.
Watch out: Is everything “data mining”?
Simple search and query processing
(Deductive) expert systems
10.
DEPARTMENT OF COMPUTERENGINEERING, Sanjivani COE, Kopargaon 10
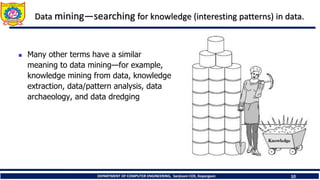
Data mining—searching for knowledge (interesting patterns) in data.
Many other terms have a similar
meaning to data mining—for example,
knowledge mining from data, knowledge
extraction, data/pattern analysis, data
archaeology, and data dredging.
11.
DEPARTMENT OF COMPUTERENGINEERING, Sanjivani COE, Kopargaon 11
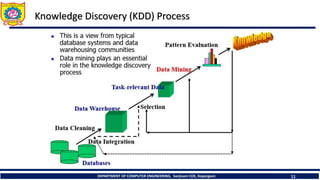
Knowledge Discovery (KDD) Process
12.
DEPARTMENT OF COMPUTERENGINEERING, Sanjivani COE, Kopargaon 12
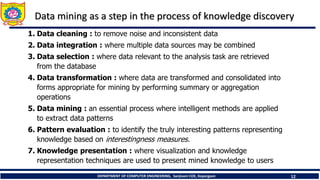
Data mining as a step in the process of knowledge discovery
1. Data cleaning : to remove noise and inconsistent data
2. Data integration : where multiple data sources may be combined
3. Data selection : where data relevant to the analysis task are retrieved
from the database
4. Data transformation : where data are transformed and consolidated into
forms appropriate for mining by performing summary or aggregation
operations
5. Data mining : an essential process where intelligent methods are applied
to extract data patterns
6. Pattern evaluation : to identify the truly interesting patterns representing
knowledge based on interestingness measures.
7. Knowledge presentation : where visualization and knowledge
representation techniques are used to present mined knowledge to users
13.
DEPARTMENT OF COMPUTERENGINEERING, Sanjivani COE, Kopargaon 13
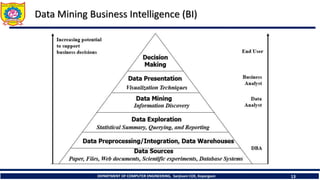
Data Mining Business Intelligence (BI)
DEPARTMENT OF COMPUTERENGINEERING, Sanjivani COE, Kopargaon 15
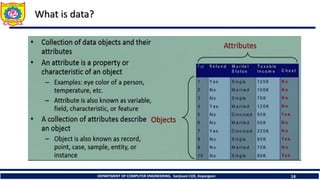
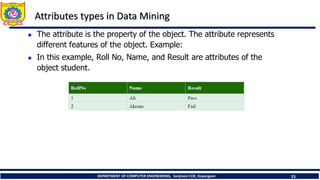
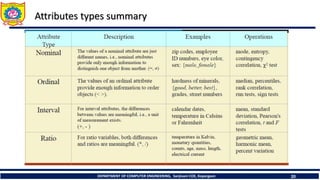
Attributes types in Data Mining
The attribute is the property of the object. The attribute represents
different features of the object. Example:
In this example, Roll No, Name, and Result are attributes of the
object student.
16.
DEPARTMENT OF COMPUTERENGINEERING, Sanjivani COE, Kopargaon 16
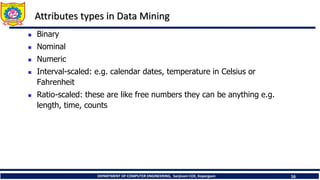
Attributes types in Data Mining
Binary
Nominal
Numeric
Interval-scaled: e.g. calendar dates, temperature in Celsius or
Fahrenheit
Ratio-scaled: these are like free numbers they can be anything e.g.
length, time, counts
17.
DEPARTMENT OF COMPUTERENGINEERING, Sanjivani COE, Kopargaon 17
Attributes types in data mining conti…
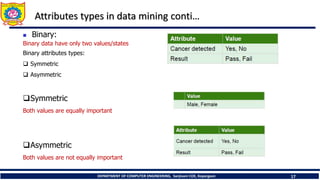
Binary:
Binary data have only two values/states.
Binary attributes types:
Symmetric
Asymmetric
Symmetric
Both values are equally important
Asymmetric
Both values are not equally important
18.
DEPARTMENT OF COMPUTERENGINEERING, Sanjivani COE, Kopargaon 18
Attributes types in data mining conti…
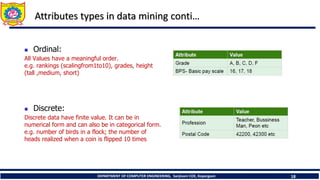
Ordinal:
All Values have a meaningful order.
e.g. rankings (scalingfrom1to10), grades, height
(tall ,medium, short)
Discrete:
Discrete data have finite value. It can be in
numerical form and can also be in categorical form.
e.g. number of birds in a flock; the number of
heads realized when a coin is flipped 10 times
19.
DEPARTMENT OF COMPUTERENGINEERING, Sanjivani COE, Kopargaon 19
Attributes types in data mining conti…
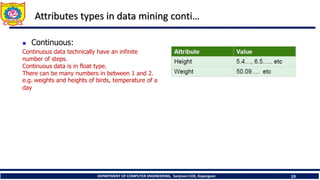
Continuous:
Continuous data technically have an infinite
number of steps.
Continuous data is in float type.
There can be many numbers in between 1 and 2.
e.g. weights and heights of birds, temperature of a
day
21
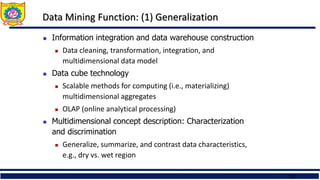
Data Mining Function:(1) Generalization
Information integration and data warehouse construction
Data cleaning, transformation, integration, and
multidimensional data model
Data cube technology
Scalable methods for computing (i.e., materializing)
multidimensional aggregates
OLAP (online analytical processing)
Multidimensional concept description: Characterization
and discrimination
Generalize, summarize, and contrast data characteristics,
e.g., dry vs. wet region
22.
22
Data Mining Function:(2) Association and Correlation Analysis
Frequent patterns (or frequent itemsets)
What items are frequently purchased together in your
Walmart?
Association, correlation vs. causality
A typical association rule
Diaper Beer [0.5%, 75%] (support, confidence)
Are strongly associated items also strongly correlated?
How to mine such patterns and rules efficiently in large
datasets?
How to use such patterns for classification, clustering,
and other applications?
23.
23
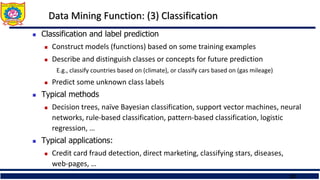
Data Mining Function:(3) Classification
Classification and label prediction
Construct models (functions) based on some training examples
Describe and distinguish classes or concepts for future prediction
E.g., classify countries based on (climate), or classify cars based on (gas mileage)
Predict some unknown class labels
Typical methods
Decision trees, naïve Bayesian classification, support vector machines, neural
networks, rule-based classification, pattern-based classification, logistic
regression, …
Typical applications:
Credit card fraud detection, direct marketing, classifying stars, diseases,
web-pages, …
24.
24
Data Mining Function:(4) Cluster Analysis
Unsupervised learning (i.e., Class label is unknown)
Group data to form new categories (i.e., clusters), e.g.,
cluster houses to find distribution patterns
Principle: Maximizing intra-class similarity & minimizing
interclass similarity
Many methods and applications
25.
25
Data Mining Function:(5) Outlier Analysis
Outlier analysis
Outlier: A data object that does not comply with the general
behavior of the data
Noise or exception? ― One person’s garbage could be
another person’s treasure
Methods: by product of clustering or regression analysis, …
Useful in fraud detection, rare events analysis
29
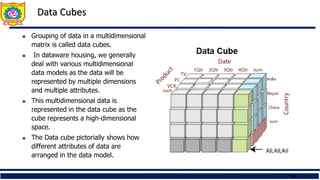
Data Cubes
Groupingof data in a multidimensional
matrix is called data cubes.
In dataware housing, we generally
deal with various multidimensional
data models as the data will be
represented by multiple dimensions
and multiple attributes.
This multidimensional data is
represented in the data cube as the
cube represents a high-dimensional
space.
The Data cube pictorially shows how
different attributes of data are
arranged in the data model.
30.
30
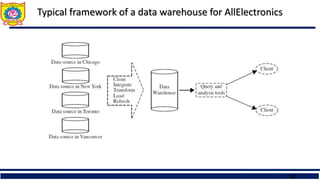
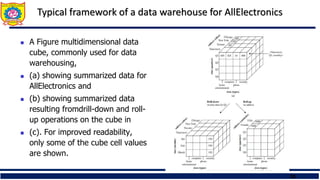
Typical framework ofa data warehouse for AllElectronics
A Figure multidimensional data
cube, commonly used for data
warehousing,
(a) showing summarized data for
AllElectronics and
(b) showing summarized data
resulting fromdrill-down and roll-
up operations on the cube in
(c). For improved readability,
only some of the cube cell values
are shown.
31.
DEPARTMENT OF COMPUTERENGINEERING, Sanjivani COE, Kopargaon 31
Reference
Han, Jiawei Kamber, Micheline Pei and Jian, “Data Mining: Concepts and
Techniques”,Elsevier Publishers, ISBN:9780123814791, 9780123814807.
https://onlinecourses.nptel.ac.in/noc24_cs22

![22
Data Mining Function: (2) Association and Correlation Analysis
Frequent patterns (or frequent itemsets)
What items are frequently purchased together in your
Walmart?
Association, correlation vs. causality
A typical association rule
Diaper Beer [0.5%, 75%] (support, confidence)
Are strongly associated items also strongly correlated?
How to mine such patterns and rules efficiently in large
datasets?
How to use such patterns for classification, clustering,
and other applications?](https://image.slidesharecdn.com/unit1prerquisite-250731103533-4d6f5ae9/85/Prerquisite-for-Data-Sciecne-KDD-Attribute-Type-22-320.jpg)