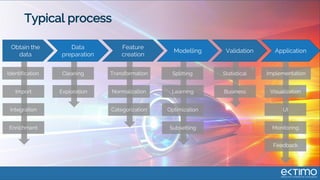
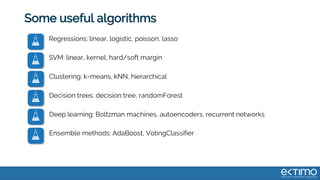
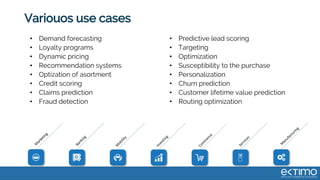
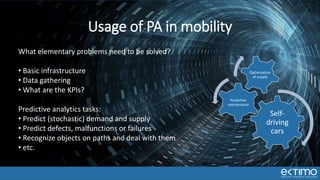
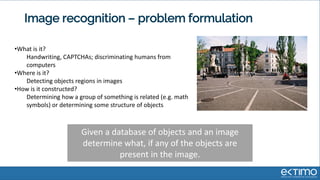
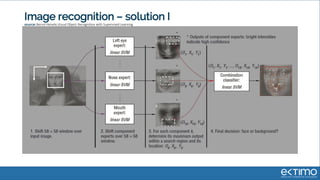
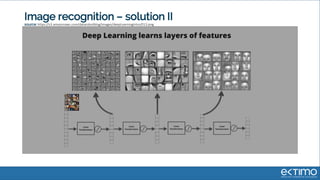
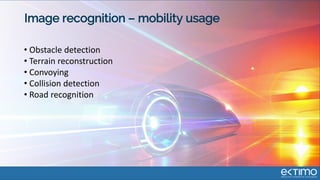
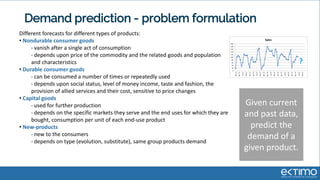
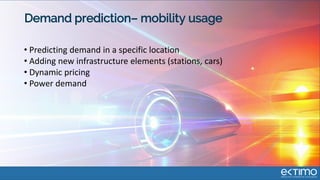
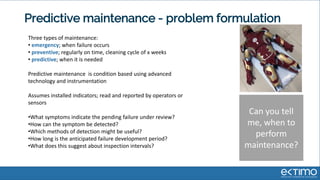
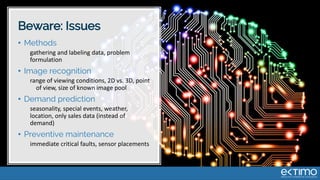
Predictive analytics The next generation
of MaaS
Rok Okorn, Ektimo d.o.o.
Agenda
About predictive analytics
Supervised, unsupervised or reinforcement
Methods
Examples of usage
What is data science?
Data science reveals previously unknown cause and effect
relationships and possibly forecasts future events by a
systematic analysis (of large amounts) of data.
Objective: usage of data for improved business cases.
Better
decisions
Higher
effiecency
Cost
optimization
Improved
experience
New
products
dfsdf
New levels of analytics with a data science
Complexity
Addedvalue
Descriptive
analytics
Diagnostic
analytics
Predictive
analytics
Prescriptive
analytics
What happened?
Why it happened?
What will happen?
Which decision leads
to the best outcome?
Survey results:
Big data use cases 2015,
BARC:
39%
31%
8%
10%
EU companies
perform big data
projects.
companies
implemented predictive
analytics.
increase in income
due to big data
projects..
mean cost
reduction due to
big data projects.
In the center of data
science is artificial
intelligence
These algorithms enable
computers to:
• learn from past data without
explicit programming
• improve with new data.
• effectively recognize patterns in
complex data from a variety of
sources.
Supervised, unsupervised or reinforcement?
Example: object recognition
•Supervised learning:
Learn by examples as to what object it is in terms of structure, color, shape, etc. So
that after several iterations it learns to define an object.
•Unsupervised learning:
There is no desired output that is provided, therefore categorization is done so that
the algorithm differentiates correctly between bikes, cars, houses or people
(clustering of data).
•Reinforcement learning:
The predictions are continuously updated, unlike in the previous types. For
example, when a robot sees an object: first classify it and then go around it and
classify it again on new observed parameters. Alternatively, when the robot learns
that some object is dangerous, it will avoid it, next time
Usable tools
Typical process
Obtain the
data
Data
preparation
Feature
creation
ValidationModelling Application
Identification
Enrichment
Import
Integration
Cleaning
Exploration
Transformation
Normalization
Categorization
Statistical
Business
Splitting
Subsetting
Learning
Optimization
Implementation
Monitoring
Visualization
UI
Feedback
Data preparation
DA
Transactions Products
Demographics
Campains
CallsE-mail
Mobile media
External data
What we knew about person A
up to some date T?
What happened
1 month after T?
Buys new
product
Integration
and
transformation
of data
Features
(predictors)
Response
301.2 1 4.5 1 10.9
Person A’s digital print
D
A
D
D
D
D
D
D
D
Modelling
HistoricaldataCurrentdata
Learning set
Test set
??
Predictive model
Learning/training
Model
validation
Input
(features)
Output
(prediction)
67%
The model predicts a
purchase for person X
with 67% probability
Ensembles – diversification at the level of models
Predictive
models
Input
Prediction
Final prediction based on
some function of the
individual models, e.g. mean
Instead of one single model we train multiple different models.
65%??
90%
10%
55%
Some useful algorithms
Regressions: linear, logistic, poisson, lasso
SVM: linear, kernel, hard/soft margin
Clustering: k-means, kNN, hierarchical
Decision trees: decision tree, randomForest
Deep learning: Boltzman machines, autoencoders, recurrent networks
Ensemble methods: AdaBoost, VotingClassifier
Variouos use cases
• Demand forecasting
• Loyalty programs
• Dynamic pricing
• Recommendation systems
• Optization of asortment
• Credit scoring
• Claims prediction
• Fraud detection
• Predictive lead scoring
• Targeting
• Optimization
• Susceptibility to the purchase
• Personalization
• Churn prediction
• Customer lifetime value prediction
• Routing optimization
Self-
driving
cars
Predictive
maintenance
Optimization
of supply
Usage of PA in mobility
What elementary problems need to be solved?
• Basic infrastructure
• Data gathering
• What are the KPIs?
Predictive analytics tasks:
• Predict (stochastic) demand and supply
• Predict defects, malfunctions or failures
• Recognize objects on paths and deal with them
• etc.
Examples of predictive analytics capabilities
Image recognition – problem formulation
•What is it?
Handwriting, CAPTCHAs; discriminating humans from
computers
•Where is it?
Detecting objects regions in images
•How is it constructed?
Determining how a group of something is related (e.g. math
symbols) or determining some structure of objects
Given a database of objects and an image
determine what, if any of the objects are
present in the image.
Image recognition – solution I
source: Bernd Heisele,Visual Object Recognition with Supervised Learning
Image recognition – solution II
source: https://s3.amazonaws.com/datarobotblog/images/deepLearningIntro/013.png
Image recognition – mobility usage
• Obstacle detection
• Terrain reconstruction
• Convoying
• Collision detection
• Road recognition
Demand prediction - problem formulation
Different forecasts for different types of products:
• Nondurable consumer goods
• vanish after a single act of consumption
• depends upon price of the commodity and the related goods and population
and characteristics
• Durable consumer goods
• can be consumed a number of times or repeatedly used
• depends upon social status, level of money income, taste and fashion, the
provision of allied services and their cost, sensitive to price changes
• Capital goods
• used for further production
• depends on the specific markets they serve and the end uses for which they are
bought, consumption per unit of each end-use product
• New-products
• new to the consumers
• depends on type (evolution, substitute), same group products demand
Given current
and past data,
predict the
demand of a
given product.
Demand prediction – solution I
Classical time series approach
• Seasonality
• Trend
• ARIMA, GARCH
Demand prediction – solution II
Machine learning methods
source: Application of machine learning techniques for supply chain demand forecasting Original Research Article,
European Journal of Operational Research, Volume 184, Issue 3, 1 February 2008
Demand prediction– mobility usage
• Predicting demand in a specific location
• Adding new infrastructure elements (stations, cars)
• Dynamic pricing
• Power demand
Predictive maintenance - problem formulation
Can you tell
me, when to
perform
maintenance?
Three types of maintenance:
• emergency; when failure occurs
• preventive; regularly on time, cleaning cycle of x weeks
• predictive; when it is needed
Predictive maintenance is condition based using advanced
technology and instrumentation
Assumes installed indicators; read and reported by operators or
sensors
•What symptoms indicate the pending failure under review?
•How can the symptom be detected?
•Which methods of detection might be useful?
•How long is the anticipated failure development period?
•What does this suggest about inspection intervals?
Predictive maintenance – solution I
source: Architecture diagram: Solution Template for predictive maintenance
Predictive maintenance – solution II
source: http://revolution-computing.typepad.com/.a/6a010534b1db25970b01bb08cba61c970d-800wi
Predictive maintenance – mobility usage
• Safety, motor breakdowns
• Infrastructure faults
• Electric component failures
• Battery performance / failure
Beware: Issues
• Methods
gathering and labeling data, problem
formulation
• Image recognition
range of viewing conditions, 2D vs. 3D, point
of view, size of known image pool
• Demand prediction
seasonality, special events, weather,
location, only sales data (instead of
demand)
• Preventive maintenance
immediate critical faults, sensor placements
Thank you for your attention!
&
Q&A

Predictive analytics in mobility

  • 1.
    Predictive analytics Thenext generation of MaaS Rok Okorn, Ektimo d.o.o.
  • 2.
    Agenda About predictive analytics Supervised,unsupervised or reinforcement Methods Examples of usage
  • 3.
    What is datascience? Data science reveals previously unknown cause and effect relationships and possibly forecasts future events by a systematic analysis (of large amounts) of data. Objective: usage of data for improved business cases. Better decisions Higher effiecency Cost optimization Improved experience New products
  • 4.
    dfsdf New levels ofanalytics with a data science Complexity Addedvalue Descriptive analytics Diagnostic analytics Predictive analytics Prescriptive analytics What happened? Why it happened? What will happen? Which decision leads to the best outcome? Survey results: Big data use cases 2015, BARC: 39% 31% 8% 10% EU companies perform big data projects. companies implemented predictive analytics. increase in income due to big data projects.. mean cost reduction due to big data projects.
  • 5.
    In the centerof data science is artificial intelligence These algorithms enable computers to: • learn from past data without explicit programming • improve with new data. • effectively recognize patterns in complex data from a variety of sources.
  • 6.
    Supervised, unsupervised orreinforcement? Example: object recognition •Supervised learning: Learn by examples as to what object it is in terms of structure, color, shape, etc. So that after several iterations it learns to define an object. •Unsupervised learning: There is no desired output that is provided, therefore categorization is done so that the algorithm differentiates correctly between bikes, cars, houses or people (clustering of data). •Reinforcement learning: The predictions are continuously updated, unlike in the previous types. For example, when a robot sees an object: first classify it and then go around it and classify it again on new observed parameters. Alternatively, when the robot learns that some object is dangerous, it will avoid it, next time
  • 7.
  • 8.
    Typical process Obtain the data Data preparation Feature creation ValidationModellingApplication Identification Enrichment Import Integration Cleaning Exploration Transformation Normalization Categorization Statistical Business Splitting Subsetting Learning Optimization Implementation Monitoring Visualization UI Feedback
  • 9.
    Data preparation DA Transactions Products Demographics Campains CallsE-mail Mobilemedia External data What we knew about person A up to some date T? What happened 1 month after T? Buys new product Integration and transformation of data Features (predictors) Response 301.2 1 4.5 1 10.9 Person A’s digital print
  • 10.
    D A D D D D D D D Modelling HistoricaldataCurrentdata Learning set Test set ?? Predictivemodel Learning/training Model validation Input (features) Output (prediction) 67% The model predicts a purchase for person X with 67% probability
  • 11.
    Ensembles – diversificationat the level of models Predictive models Input Prediction Final prediction based on some function of the individual models, e.g. mean Instead of one single model we train multiple different models. 65%?? 90% 10% 55%
  • 12.
    Some useful algorithms Regressions:linear, logistic, poisson, lasso SVM: linear, kernel, hard/soft margin Clustering: k-means, kNN, hierarchical Decision trees: decision tree, randomForest Deep learning: Boltzman machines, autoencoders, recurrent networks Ensemble methods: AdaBoost, VotingClassifier
  • 13.
    Variouos use cases •Demand forecasting • Loyalty programs • Dynamic pricing • Recommendation systems • Optization of asortment • Credit scoring • Claims prediction • Fraud detection • Predictive lead scoring • Targeting • Optimization • Susceptibility to the purchase • Personalization • Churn prediction • Customer lifetime value prediction • Routing optimization
  • 14.
    Self- driving cars Predictive maintenance Optimization of supply Usage ofPA in mobility What elementary problems need to be solved? • Basic infrastructure • Data gathering • What are the KPIs? Predictive analytics tasks: • Predict (stochastic) demand and supply • Predict defects, malfunctions or failures • Recognize objects on paths and deal with them • etc.
  • 15.
    Examples of predictiveanalytics capabilities
  • 16.
    Image recognition –problem formulation •What is it? Handwriting, CAPTCHAs; discriminating humans from computers •Where is it? Detecting objects regions in images •How is it constructed? Determining how a group of something is related (e.g. math symbols) or determining some structure of objects Given a database of objects and an image determine what, if any of the objects are present in the image.
  • 17.
    Image recognition –solution I source: Bernd Heisele,Visual Object Recognition with Supervised Learning
  • 18.
    Image recognition –solution II source: https://s3.amazonaws.com/datarobotblog/images/deepLearningIntro/013.png
  • 19.
    Image recognition –mobility usage • Obstacle detection • Terrain reconstruction • Convoying • Collision detection • Road recognition
  • 20.
    Demand prediction -problem formulation Different forecasts for different types of products: • Nondurable consumer goods • vanish after a single act of consumption • depends upon price of the commodity and the related goods and population and characteristics • Durable consumer goods • can be consumed a number of times or repeatedly used • depends upon social status, level of money income, taste and fashion, the provision of allied services and their cost, sensitive to price changes • Capital goods • used for further production • depends on the specific markets they serve and the end uses for which they are bought, consumption per unit of each end-use product • New-products • new to the consumers • depends on type (evolution, substitute), same group products demand Given current and past data, predict the demand of a given product.
  • 21.
    Demand prediction –solution I Classical time series approach • Seasonality • Trend • ARIMA, GARCH
  • 22.
    Demand prediction –solution II Machine learning methods source: Application of machine learning techniques for supply chain demand forecasting Original Research Article, European Journal of Operational Research, Volume 184, Issue 3, 1 February 2008
  • 23.
    Demand prediction– mobilityusage • Predicting demand in a specific location • Adding new infrastructure elements (stations, cars) • Dynamic pricing • Power demand
  • 24.
    Predictive maintenance -problem formulation Can you tell me, when to perform maintenance? Three types of maintenance: • emergency; when failure occurs • preventive; regularly on time, cleaning cycle of x weeks • predictive; when it is needed Predictive maintenance is condition based using advanced technology and instrumentation Assumes installed indicators; read and reported by operators or sensors •What symptoms indicate the pending failure under review? •How can the symptom be detected? •Which methods of detection might be useful? •How long is the anticipated failure development period? •What does this suggest about inspection intervals?
  • 25.
    Predictive maintenance –solution I source: Architecture diagram: Solution Template for predictive maintenance
  • 26.
    Predictive maintenance –solution II source: http://revolution-computing.typepad.com/.a/6a010534b1db25970b01bb08cba61c970d-800wi
  • 27.
    Predictive maintenance –mobility usage • Safety, motor breakdowns • Infrastructure faults • Electric component failures • Battery performance / failure
  • 28.
    Beware: Issues • Methods gatheringand labeling data, problem formulation • Image recognition range of viewing conditions, 2D vs. 3D, point of view, size of known image pool • Demand prediction seasonality, special events, weather, location, only sales data (instead of demand) • Preventive maintenance immediate critical faults, sensor placements
  • 29.
    Thank you foryour attention! & Q&A