SlideShare a Scribd company logo
1 of 19
Download to read offline
Eleventh International Colloquium on ‫للھندسة‬ ‫عشر‬ ‫الحادى‬ ‫الدولى‬ ‫المؤتمر‬
Structural & Geotechnical Engineering ‫الجيوتقنية‬ ‫و‬ ‫االنشائية‬
17-19 May 2005 17-19‫مايو‬2005
Ain Shams University – Cairo ‫شمس‬ ‫عين‬ ‫جامعة‬-‫القاھرة‬
Prediction of Uplift Capacity
For Shallow Foundations
Using Genetic Programming
Ezzat A. Fattah1
, Hossam E.A. Ali2
, Ahmed M. Ebid3
ABSTRACT
In most geotechnical problems, it is too difficult to predict soil and structural behavior
accurately, because of the large variation in soil parameters and the assumptions of numerical
solutions. But recently many geotechnical problems are solved using Artificial Intelligence
(AI) techniques, by presenting new solutions or developing existing ones. Genetic
Programming, (GP), is one of the most recently developed (AI) techniques based on Genetic
Algorithm (GA) technique.
In this research, GP technique is utilized to develop prediction criteria for uplift capacity of
shallow foundations using collected historical records. The uplift capacity formula is
developed using special software written by the authors in “Visual C++” language. The
accuracy of the developed formula was also compared with earlier prediction methods.
Keywords: Uplift Capacity, GA, GP, and AI
INTRODUCTION
Shallow footing ( Pad & Chimney ) is the most common type of uplift foundation. For wide
range of soil types, it is the easiest, preferred and most economic type of uplift foundation.
There are several methods to design the pad & chimney footing, these methods can be
classified into four groups based on the concept of design, these groups are Soil Load
Methods, Earth Pressure Methods, Shearing Methods and Constitutive Laws Methods
Soil load methods
In these methods the soil resistance to foundation extraction is represented by means of the
weight of a resisting mass for which it is assumed that it moves together with the foundation
due to the action of the pulling force. The shape and magnitude of the resisting soil mass have
been determined for calculation by the shape of foundation slab and soil characteristics. The
problem of determination of rupture force with this method is reduced to the selection rupture
surface shape. This shape is usually given as a function of the type and characteristics of the
soil such as shear characteristics, density, consistency,…etc.
Earth cone method (1958): This is the most common method which has been adopted for
design. In Japan the standard specification for design which was published in 1958 by JEC (
Japanese Electrotechnical Committee ) specified the earth cone method for the calculation of
the uplift resistance.
In this method the ultimate uplift resistance is assumed to be equal to the sum of the dead
weight of the footing and the soil mass contained the truncated pyramid or cone with the
bottom of footing slab as base, the rupture surface is considered as straight line inclines with
the vertical by certain angle (β). In this method the knowledge of soil mechanics is not taken
1
Prof. of soil mechanics, Ain Shams University, Cairo, Egypt
2
Teacher of soil mechanics, Ain Shams University, Cairo, Egypt
3
Graduate student, Ain Shams University, Cairo, Egypt
Eleventh International Colloquium on ‫للھندسة‬ ‫عشر‬ ‫الحادى‬ ‫الدولى‬ ‫المؤتمر‬
Structural & Geotechnical Engineering ‫الجيوتقنية‬ ‫و‬ ‫االنشائية‬
17-19 May 2005 17-19‫مايو‬2005
Ain Shams University – Cairo ‫شمس‬ ‫عين‬ ‫جامعة‬-‫القاھرة‬
into consideration and therefore the actual important phenomenon of shear failure in earth
body is neglected.
Earth pressure methods
In earth pressure methods it is assumed that the rupture surfaces are vertical , i.e. the soil
mass which is pulling together with the foundation has the shape of upright prism or cylinder
whose cross section is the same as the foundation slab. The pulling force is determined by the
weight of foundation and soil mass and by the friction along its lateral area. Friction forces
depend on lateral pressure, so the determination of the intensity of lateral pressure ( for which
it is assumed that they vary linearly depending on the depth ) is one of the basic problems.
Mors Method (1959): In 1959, Mors suggested that the lateral pressure at the anchor slab
level has the value of a passive earth pressure in accordance with the Ranking equilibrium
theory. The value of the earth pressure in the region between the ground surface and the
anchor slab is varying linearly with the depth. The fundamental defects of the earth pressure
methods ( alike the soil load methods ) are that the shear failure in soil mass is not taken into
consideration and the effect of cohesion is not considered in the design.
Shearing strength methods
These Methods were developed on the basis of experimental and theoretical results.
According to the concept of these methods the ultimate uplift capacity of the foundation is
determined by the weight of foundation and soil mass within the rupture surface and by the
shearing force (including the friction and cohesion) along that rupture surface. The shape of
the rupture surface is varied from one method to another according to the experimental and
theoretical bases of the method. Some methods simply assumed the rupture surface as straight
line like Shichiri (1943), and Modified Morse (1959), methods. On the other hand some
methods are very complicated such as Matsuo (1968), Method which assume that the rupture
surface is a combination of logarithmic spiral curve and straight line.
Shichiri Method (1943): In 1943, Shichiri developed a method to estimate the uplift capacity
of foundation based on experimental and theoretical results. He suggested a shearing force
acting along a vertical rupture surface. This force expressed in terms of soil cohesion, angle of
internal friction and coefficient of earth pressure at rest.
Sarac method (1961): The method of Sarac is based on a series of pullout tests in different
soils and variable depths using a circular anchor plate. Sarac noted that the rupture surface
had the shape of convex curve whose tangent at the contact point with the anchor slab was
approximately vertical while it crossed the ground surface with an angle of (45-ϕ/2) . He
approximated the rupture surface by means of a logarithmic spiral in general form. The
ultimate uplift resistance is calculated as the some of the dead weights of the footing and the
soil enclosed with the rupture surface and the vertical component of the shear resistance
along that surface.
Matsuo method (1967,1968): In 1967, Matsuo developed his method assuming that the
rupture surface consists of a logarithmic spiral curve and its tangential straight line . He
based his assumption on a series of experimental tests on a circular plate anchor model. For
practical design, this method is very complicated to be applied, so based on the request of
IEEJ ( Institute of Electrical Engineering of Japan ) Matsuo simplified his method in
1968.
The estimated loss of accuracy due to this simplification is about 3% of the ultimate uplift
capacity. To apply his method on the square foots Matsuo suggested to use the equivalent area
concept which means to replace the square footing with circular foot having the same area
taking into consideration that the perimeter of the square foot is about 10% greater than the
Eleventh International Colloquium on ‫للھندسة‬ ‫عشر‬ ‫الحادى‬ ‫الدولى‬ ‫المؤتمر‬
Structural & Geotechnical Engineering ‫الجيوتقنية‬ ‫و‬ ‫االنشائية‬
17-19 May 2005 17-19‫مايو‬2005
Ain Shams University – Cairo ‫شمس‬ ‫عين‬ ‫جامعة‬-‫القاھرة‬
perimeter of its equivalent circular foot. So he increases the uplift capacity by 10%. A series
of field tests done by Matsuo during a 66 kV transmission power line using a square foots
proved that the equivalent area concept is valid to be used with his method.
Constitutive laws methods
Gopal and Saran method (1987): In 1987, Gopal and Sararn developed an analytical
method to predict the Uplift-Displacement characteristic of shallow foundation in (C-ϕ) soil
using non-linear constitutive laws. The method based on assumption that the foundation is
rigid and having a negligible weight, and buried at shallow depth in homogeneous isotropic
medium of semi-infinite extent ( plan strain model ). In this method the Uplift - displacement
curve is divided into four stages:
Stage (1): (Applied load less than Critical load )
The shear parameters (C,ϕ) are considered fully mobilized at the footing base and have
zero value at some level below the ground surface in linear relationship.
Stage (2): (Applied load equal to Critical load )
The shear parameters (C,ϕ) are considered fully mobilized at the footing base and have
zero value at the ground surface level in linear relationship.
Stage (3): (Applied load more than Critical load and less than the pullout load )
The shear parameters (C,ϕ) are considered fully mobilized at the footing base and
partially mobilized at ground surface level in linear relationship.
Stage (4): (Applied load equal to the pullout load )
The shear parameters (C,ϕ) are considered fully mobilized at the footing base and fully
mobilized at ground surface level in linear relationship.
The physical meaning of the developed equation is similar to Shichiri method but the Ko
(Lateral coefficient at rest) factor is replaced by (1.0).
GENETIC ALGORITHM (GA)
The Genetic Algorithm (GA) is an Artificial Intelligence (AI) technique, based on simulating
the natural reproduction process, following the well-known Darwin's rule "The fittest
survive". The natural selection theory for Darwin assumes that, for a certain population, there
is always some differences between its members. These differences make some members
more suitable for the surrounding conditions than the others. Accordingly, they have better
chances to survive and reproduce a next generation with enhanced properties. Generation after
generation most of the population will have these suitable properties, meanwhile the
unsuitable members will eventually be diminished. In other words, during the reproduction
process, the natural selection increases the fitness of the population, which means that this
population is developed to suite the surrounding conditions. In the natural reproduction
process, certain sequence of (DNA) characters represent properties of members, each
character is called "Gene", and every set of genes is called "Chromosome" (Michalewicz,
1992).
The theory of biological reproduction process was first simulated mathematically by John
Holland, 1975, where genes and chromosomes are replaced by a parameters and solutions
respectively, and the surrounding conditions are represented by a fitting function. Hence,
according to Darwin's rule, during the reproduction process the population is developed to
suite the fitting function (Holland 1975).
The most important advantage of GA technique is its generality and its applicability to very
wide range of engineering problems. This is because GA technique is not depending on type
of data. Encoding the problem parameters in genetic form is the first and the most important
step in the GA solution.
Eleventh
Structura
Ain Sh
The stan
populati
fitting f
accordin
destroye
crossov
cycle st
accurac
GENET
GP is on
to the G
concept
GP tech
First, fi
surface
minimiz
SS
International
al & Geotechn
17-19 May 20
hams Univers
ndard GA p
ion of solut
function, an
ng to there
ed. Finally,
ver operator
tarted again
y is accepte
TIC PROG
ne of the mo
GA, which c
t of GP is to
hnique. In or
tness evalu
is represen
zed for best
SE = Σ [ GP
Colloquium o
nical Engineeri
005
sity – Cairo
procedure c
tions are ge
evaluating
e fitness ar
producing
on the surv
n by evaluat
ed (Michale
GRAMMIN
ost recent d
can be defin
o find the be
rder to use G
Fig
uation metho
nted herein
t fitting surf
P prediction
on
ing
consists of f
enerated an
of the fitne
re arranged
new solutio
viving solut
ting the fitn
ewicz 1992)
NG (GP)
developed kn
ned as Mul
est fitting su
GA, the pre
gure 1: Flow
od (function
by the sum
face. The S
n - Target ou
four main s
nd encoded
ess of each
d and the u
ons to keep
tions. Mutat
ness of the n
).
nowledge-b
ltivariable I
urface in hy
evious steps
w chart for
n to be opt
mmation of
SE is calcul
utput ]2
steps as dep
in genetic
solution is
unsuitable (
p the popula
tion operato
new solutio
base techniq
Interpolation
yper-space f
s will be fol
GA procedu
timized) ha
f squared e
lated by
‫للھندسة‬
‫لقاھرة‬
picted in Fig
form. Seco
conducted.
(least quali
ation size co
or may be a
ns and so o
ques and it i
n Procedure
for a certain
lowed, (Ko
ure
s to be dete
errors (SSE
(1)
‫عشر‬ ‫الحادى‬ ‫ولى‬
‫الجيوتقنية‬ ‫و‬ ‫ئية‬
19‫مايو‬2005
‫شمس‬ ‫عين‬ ‫ة‬-‫الق‬
g.1. First, a
ond, using a
Then, the s
ified) solut
onstant by a
applied and
on until the
is next deve
e (MLP). T
n given poin
za, 1994).
ermined. Fi
E), which ha
‫الدو‬ ‫المؤتمر‬
‫االنشائ‬
17-9
‫جامعة‬
a random
a certain
solutions
ions are
applying
then the
solution
elopment
The basic
nts using
itness of
as to be
Eleventh
Structura
Ain Sh
Then, c
(i.e., de
the chro
have to
1. Any
surfaces
2. Any
such as
3. The m
a polyno
4. The f
has one
Therefo
using th
graphica
Using t
complex
represen
As show
Operato
genes. T
genes. T
genes.
After co
operatio
to repla
(in vari
compon
On the
features
were tw
(1996),
two par
operator
same op
International
al & Geotechn
17-19 May 20
hams Univers
conducting
etermination
omosome) t
be consider
set of poi
s with defer
complicated
(=, +, -, x, /
most simple
omial equat
five basic o
input and o
ore, to creat
he aforeme
ally represe
the previous
xity of the f
nting formu
wn in Fig. 3
ors part rep
The variabl
Therefore, t
onducting e
ons (crossov
ace some ran
iables part)
nents of the
e other han
s from their
wo ways to
is called tw
rts of the c
rs part of o
peration wil
Colloquium o
nical Engineeri
005
sity – Cairo
the most
n of number
to represent
red:
ints in cert
rent accurac
d equation
/, sin, cos.…
e case is to
tion.
perators hav
one output.
te a formul
entioned fiv
ented in Fig
s operators,
formula, the
ulas in a tree
Fig
3, each chro
resents all
les part repr
the total nu
encoding o
ver and mut
ndomly sele
). Opposite
two parts o
nd, the new
r parents.
o apply the
wo-point cro
chromosom
ne parent w
ll be applied
on
ing
important
r of genes f
t a formula
ain domain
cy dependin
can be con
…etc. ).
use only th
ve two inpu
la in geneti
ve basic op
. 2.
, any polyn
e more leve
e form is sh
gure 2: The
omosome co
the tree ex
resent only
umber of ge
f chromoso
tation) have
ected genes
ely, the cro
of the chrom
w chromoso
That means
crossover,
ossover. In
me independ
will be swap
d on the var
step in G
for each ch
in genetic f
n of hyper
ng on the co
structed fro
he five basic
uts and one
ic form, a
perators (i.e
nomial can
els of tree a
own in Fig.
five basic o
onsists of tw
xcept the lev
the level 0
enes on eve
ome proced
e to be perf
s with rando
ossover pro
mosome mus
omes gener
s that they
the first m
this techniq
dently. Thu
pped with th
riables part t
GP which i
hromosome,
form. By do
space can
mplexity of
om certain b
c operators
output exce
binary tree
e. =, +, -,
be represen
are needed t
. 3.
operators in
wo parts; op
vel 0 and i
0 of the tree
ery chromo
dure, the pr
formed. Mu
om operator
ocedure is
st not be mi
rated durin
cannot be
method, wh
que, crossov
us, a certai
heir image
too as show
‫للھندسة‬
‫لقاھرة‬
is encoding
, and arrang
oing so, som
be represe
f these surfa
basic functi
(=, +, -, x,
ept the oper
e structure w
x, /). Th
nted in a tr
to represent
GP
perators part
it consists o
e and consi
some is ( 2
rocedures to
utation is ve
r (in operato
not that si
ixed during
ng crossove
generated r
hich is sugg
ver procedu
n number
from the ot
wn in Fig. 4.
‫عشر‬ ‫الحادى‬ ‫ولى‬
‫الجيوتقنية‬ ‫و‬ ‫ئية‬
19‫مايو‬2005
‫شمس‬ ‫عين‬ ‫ة‬-‫الق‬
g of chrom
gement of g
me importan
ented by m
aces.
ons (operat
, /) to const
rator (=) wh
will be con
his tree stru
ree form. T
t it. An exam
t and variab
of (2 No. of l
ists of (2 No
2 No. of levels
o apply the
ry simple o
ors part) or
imple, beca
crossover.
er must hav
randomly.
gested by R
ure is applie
of genes f
ther parent,
‫الدو‬ ‫المؤتمر‬
‫االنشائ‬
17-9
‫جامعة‬
mosomes
genes on
nt points
many
tors)
truct
hich
nstructed
ucture is
he more
mple for
bles part.
levels
- 1)
o. of levels
)
+ 1
- 1)
e genetic
operation
variable
ause the
ve some
So there
Riccardo
ed on the
from the
, and the
Eleventh
Structura
Ain Sh
The sec
generati
survivin
selected
so do th
International
al & Geotechn
17-19 May 20
hams Univers
Figu
cond way to
ion of chro
ng chromos
d randomly
he next gene
Colloquium o
nical Engineeri
005
sity – Cairo
ure 3: Math
Fi
o apply cro
omosomes i
somes. In
from the fir
es. This proc
on
ing
ematical an
gure 4: Two
ossover was
s generated
other word
rst genes of
cess is depi
nd genetic re
o-point cros
s proposed
d by random
ds, the firs
f the whole
icted in Fig.
epresentatio
ssover meth
by the auth
mly selectin
t gene of t
surviving s
. 5 for three
‫للھندسة‬
‫لقاھرة‬
on of binary
hod
hors. In thi
ng each gen
the new ch
et of parent
parents and
‫عشر‬ ‫الحادى‬ ‫ولى‬
‫الجيوتقنية‬ ‫و‬ ‫ئية‬
19‫مايو‬2005
‫شمس‬ ‫عين‬ ‫ة‬-‫الق‬
y tree
is technique
ne from the
hromosome
t chromosom
d one child.
‫الدو‬ ‫المؤتمر‬
‫االنشائ‬
17-9
‫جامعة‬
e, a new
e similar
will be
mes, and
.
Eleventh
Structura
Ain Sh
In rando
can be c
be half
chosen
Practica
from th
minima
convers
After th
generati
SSE). A
minimu
surface
accurac
1996).
PREDI
AI techn
with no
using G
generate
used to
The gen
power
foundat
includes
includes
(C), tan
The eva
diamete
constan
bulk cas
International
al & Geotechn
17-19 May 20
hams Univers
om selection
chosen. On
f of the pop
in this res
ally, the fas
he populatio
a. On other
sion will be
he previou
ion. Genera
After a cert
um SSE). A
for this nu
y of this su
ICTION OF
niques had
oisy and ina
GP techniqu
e the formu
evaluate the
nerating da
transmissio
tion depths
s (C-s
s footing w
ngent of inte
aluation data
er of the fo
nt and equal
se.
Colloquium o
nical Engineeri
005
sity – Cairo
Figure
n crossover
the other h
pulation. Fo
search to c
stest conver
on. For less
r hand, if th
very slow.
s three ste
ation after g
tain number
At this stag
umber of tr
urface is no
F UPLIFT
been wildly
accurate dat
e, the result
ulas, where a
e generated
ata set cons
on line, fou
are ranged
oil, ϕ-soil,
idth (B) and
ernal friction
a set consis
ooting is ran
to (1.00m)
on
ing
e 5: Random
r technique
and, in two
or this reas
carry out th
rsion occur
s number o
he number o
eps, GA ca
generation,
r of genera
ge, the corr
ree levels (w
t enough, l
CAPACIT
y used in ge
ta. In order
ts of (31) p
another set
d formulas.
sists of (31
undation di
between (
C-ϕ soil) i
d depth (D)
n angle (tan
sts of (4) pu
nged betwe
). All the se
m selection
number of
-point cross
son, the ran
he crossove
rs when the
of survivors
of survivors
an be appl
the fitness
ations the fi
responding
which mean
arger numb
TY USING
eotechnical
to predict
pullout tests
of (4) pullo
) pullout fi
imensions
1.05 to 1.80
in both bulk
) beside thre
n(ϕ)) and eff
ullout labora
een (0.40 to
ets had been
crossover m
survivors fr
sover techn
ndom selec
er operation
e number o
s the soluti
s is more th
lied on the
will increas
itness will
chromosom
ns for this
ber of tree l
(GP)
field recent
the uplift c
s carried out
out tests car
ield tests o
are ranged
0m). The s
k and subm
ee soil para
ffective unit
atory tests o
o 1.00m), w
n carried ou
‫للھندسة‬
‫لقاھرة‬
method
from one ge
ique numbe
ction crosso
n in the d
of survivors
on may be
han 50% of
e first and
se (which m
settle at a
mes represe
degree of
levels must
tly because
capacity of
t by (Matsu
rried out by
n square fo
d between
oil conditio
merged case
ameters whi
weight of s
on axi-symm
where the f
ut using the
‫عشر‬ ‫الحادى‬ ‫ولى‬
‫الجيوتقنية‬ ‫و‬ ‫ئية‬
19‫مايو‬2005
‫شمس‬ ‫عين‬ ‫ة‬-‫الق‬
neration to
er of survivo
over techniq
developed s
s equals to
trapped in
f the popula
randomly
means a dec
certain valu
ent the mos
complexity
be used (R
of its abilit
shallow fou
uo, 1967) is
(Sarac, 197
ootings of
(1.20 to 2
on of these
s. Each dat
ich are the c
soil (γ).
metric footin
foundation
e same (C-ϕ
‫الدو‬ ‫المؤتمر‬
‫االنشائ‬
17-9
‫جامعة‬
the next
ors must
que was
software.
30-40%
n a local
ation, the
created
crease in
ue (with
st fitting
y). If the
Riccardo,
ty to dial
undation
s used to
75) were
66 K.V.
2.00m ),
data set
ta record
cohesion
ngs. The
depth is
ϕ soil) in
Eleventh International Colloquium on ‫للھندسة‬ ‫عشر‬ ‫الحادى‬ ‫الدولى‬ ‫المؤتمر‬
Structural & Geotechnical Engineering ‫الجيوتقنية‬ ‫و‬ ‫االنشائية‬
17-19 May 2005 17-19‫مايو‬2005
Ain Shams University – Cairo ‫شمس‬ ‫عين‬ ‫جامعة‬-‫القاھرة‬
In order to compare predicted and experimental capacities, the concept of equivalent area was
used to find the pullout load of the equivalent square footing with a width equal to the
diameter of the axi-symmetric footing.
During adapted research program to predict the uplift capacity of shallow foundation using
GP technique, the research program had been conducted using the last version of GP
software. The complexity of the generating formulas increases gradually from three levels in
the first trial and up to six levels in the last trail. Each trail had been conducted until the
solution error settled at it's minimum value (which corresponding to the maximum accuracy )
or until the solution exceeded the practical limits (when the solution takes too much time).
The first three trails had been conducted using only five variables ( B, D, C, tan(ϕ), γ) which
are footing width in meters, footing depth in meters, soil cohesion in tons per square meters ,
tangent of internal friction angle of soil and effective unit weight of soil in tons per cubic
meters respectively. Where the last two trails had been conducted using additional five
variables with constant values which are (1, 2, 3, 5, 11). A summary of the research program
and its results are shown in table (1).
The generated formula of each trail is represented in two charts, the first chart represent the
relationship between predicted and experimental capacities for both generating and evaluation
data sets, where the second chart shows the effect of shallowness ratio (B/D) and type of soil
on the accuracy of prediction. The average relative error could be calculated from the
following formula:
Average Relative Error % =
P P
P n
caln −
×∑
exp
exp1
100
....... (1)
Accuracy % = 100- Average Relative Error % ....... (2)
Where Pcal , Pexp are the predicted and the experimental uplift capacities respectively. The soil
type is represented by the ratio between cohesion and friction shear strength ( C / γ.D.tan(ϕ)),
for pure (ϕ-soil) this ratio is equal to zero and for pure (C-soil) the ratio yields to infinity.
Trial No. (1): Starting with a simple trail which has only three levels using generating data
set consists of five variables ( B, D, C, tan(ϕ), γ) produced formula (3) which corresponding
to SSE (Summation of Square Error) equals to (634). Applying this formula on the evaluation
data set produced SSE equals to (14). The corresponding accuracy of the formula in case of
generating, evaluation and total data sets are (82.30%) (75.78%) and (81.70%) respectively.
P B C D B D= + + +2 .( ).( .tan( ))γ ϕ ......(3)
The graphical representation of predicated capacities of both generating and evaluation data
sets are shown in fig.(6), the graph shows that the slope of the best fitting line is (0.9858 ≈
1.00) and the coefficient of determination (R2
=0.8198) which indicate the good correlation
between the predicted and experimental capacities. Where the upper chart in fig. (7) shows
that the footing shallowness (B/D) has no significant effect on the prediction accuracy, on the
other hand, the lower chart indicates that the percentage of error in the (ϕ-soil) (up to 40%) is
higher than in (c-soil) (about 20%).
Eleventh International Colloquium on ‫للھندسة‬ ‫عشر‬ ‫الحادى‬ ‫الدولى‬ ‫المؤتمر‬
Structural & Geotechnical Engineering ‫الجيوتقنية‬ ‫و‬ ‫االنشائية‬
17-19 May 2005 17-19‫مايو‬2005
Ain Shams University – Cairo ‫شمس‬ ‫عين‬ ‫جامعة‬-‫القاھرة‬
Trial No. (2): Continuing the research program with the second trail which has four levels
using generating data set consists of five variables ( B, D, C, tan(ϕ), γ) produced formula (4)
which corresponding to SSE (Summation of Square Error) equals to (501). Applying this
formula on the evaluation data set produced SSE equals to (26). The corresponding accuracy
of the formula in case of generating, evaluation and total data sets are (84.26%) (67.00%) and
(83.50%) respectively.
P e C B C D eB D e
= + − + ++( ) tan( )
( ) .( tan( )).2 γ ϕ
ϕ
......(4)
The graphical representation of predicated capacities of both generating and evaluation data
sets are shown in fig.(8), the graph shows that the slope of the best fitting line is (0.9896 ≈
1.00) and the coefficient of determination (R2
=0.8659) which indicate the good correlation
between the predicted and experimental capacities. Where the upper chart in fig. (9) shows
that the footing shallowness (B/D) has no significant effect on the prediction accuracy, on the
other hand, the lower chart indicates that the percentage of error in the (ϕ-soil) (up to 60%) is
higher than in (c-soil) (about 10%).
Trial No. (3): The conducting of the third trail which has five levels using generating data set
consists of five variables ( B, D, C, tan(ϕ), γ) generates formula (5) which corresponding to
SSE (Summation of Square Error) equals to (238). Applying this formula on the evaluation
data set produced SSE equals to (37). The corresponding accuracy of the formula in case of
generating, evaluation and total data sets are (89.16%) (60.57%) and (88.08%) respectively.
P e D C B C B
B Ln B B C
Ln
B D C
B D
= + + + −
+ −+( )
.
. . . .tan( ).( )
( .tan( )) .( ( ) )
( )
2 2
2
2
γ ϕ
ϕ
γ
.... (5)
The graphical representation of predicated capacities of both generating and evaluation data
sets are shown in fig.(10), the graph shows that the slope of the best fitting line is (1.0045 ≈
1.00) and the coefficient of determination (R2
=0.9415) which indicate the very good
correlation between the predicted and experimental capacities. Where the upper chart in
fig.(11) shows that the prediction accuracy of deep footings is worst than shallow ones , on
the other hand, the lower chart indicates that the percentage of error in the (ϕ-soil) (up to
30%) is higher than in (c-soil) (about 10%).
Trial No. (4): The forth trail five levels just like the third one but using generating data set
consists of ten variables ( B, D, C, tan(ϕ), γ,1,2,3,5,11). Conducting of this trial produced
formula (6) which corresponding to SSE (Summation of Square Error) equals to (226).
Applying this formula on the evaluation data set produced SSE equals to (35). The
corresponding accuracy of the formula in case of generating, evaluation and total data sets are
(89.44%) (61.57%) and (88.38%) respectively.
P e D C B C B
B B D C
Ln
B D C
B D
= + + + −
− −+( )
.
. . . .tan( ).( )
( .tan( )) .( )
( )
2 2
2
2
2
γ ϕ
ϕ
γ
........ (6)
The graphical representation of predicated capacities of both generating and evaluation data
sets are shown in fig.(12), the graph shows that the slope of the best fitting line is (1.0033 ≈
1.00) and the coefficient of determination (R2
=0.9445) which indicate the very good
correlation between the predicted and experimental capacities. Where the upper chart in
fig. (13) shows that the prediction accuracy of deep footings is worst than shallow ones , on
the other hand, the lower chart indicates that the percentage of error in the (ϕ-soil) (up to
25%) is higher than in (c-soil) (about 10%).
Eleventh
Structura
Ain Sh
International
al & Geotechn
17-19 May 20
hams Univers
Colloquium o
nical Engineeri
005
sity – Cairo
on
ing
‫للھندسة‬
‫لقاھرة‬
‫عشر‬ ‫الحادى‬ ‫ولى‬
‫الجيوتقنية‬ ‫و‬ ‫ئية‬
19‫مايو‬2005
‫شمس‬ ‫عين‬ ‫ة‬-‫الق‬
‫الدو‬ ‫المؤتمر‬
‫االنشائ‬
17-9
‫جامعة‬
Eleventh International Colloquium on ‫للھندسة‬ ‫عشر‬ ‫الحادى‬ ‫الدولى‬ ‫المؤتمر‬
Structural & Geotechnical Engineering ‫الجيوتقنية‬ ‫و‬ ‫االنشائية‬
17-19 May 2005 17-19‫مايو‬2005
Ain Shams University – Cairo ‫شمس‬ ‫عين‬ ‫جامعة‬-‫القاھرة‬
Trial No. (5): The last trial in the research program has six levels using generating data set
consists of ten variables ( B, D, C, tan(ϕ), γ,1,2,3,5,11). Conducting of this trial generated
formula (7) which corresponding to SSE (Summation of Square Error) equals to (184).
Applying this formula on the evaluation data set produced SSE equals to (4). The
corresponding accuracy of the formula in case of generating, evaluation and total data sets are
(90.46%) (87.24%) and (90.15%) respectively.
P B D C B D D C D D B
B D
= + + + + + + + +
−
+( . tan( )).( . ) ( )
( )
ϕ
γ γ
2
2 3
2 3
11
− − + + + + −
⎛
⎝
⎜
⎞
⎠
⎟2 2 2
2
γ γ ϕ γ ϕ γ ϕ γ
γ
B B C B
C
.( tan( )) . . . .tan( ). ( ).tan( ) .... (7)
The graphical representation of predicated capacities of both generating and evaluation data
sets are shown in fig.(14), the graph shows that the slope of the best fitting line is (0.997 ≈
1.00) and the coefficient of determination (R2
=0.9502) which indicate an excellent
correlation between the predicted and experimental capacities. Where the upper chart in fig.
(15) shows that the footing shallowness (B/D) has no significant effect on the prediction
accuracy, on the other hand, the lower chart indicates that the percentage of error in the (ϕ-
soil) (up to 30%) is higher than in (c-soil) (about 5%).
Figure 10: Representation of the generated formula - trial no. (3)
Figure 11: Effect of B/D and type of soil on the prediction accuracy For trail no. (3)
y = 1.0045x
R2
= 0.9415
0
10
20
30
40
50
60
0 10 20 30 40 50 60
Experimental capacity (ton)
Ppredictedcapacity(ton)
Generating set
Validation set
Best Fitting
0
20
40
60
80
0 2 4 6 8 10 12 14 16
C / D.γ .tan(φ )
Error%
Generating set
Validation set
0
20
40
60
80
0.00 0.50 1.00 1.50 2.00
B/D
Error%
Generating set
Validation set
Eleventh
Structura
Ain Sh
International
al & Geotechn
17-19 May 20
hams Univers
Colloquium o
nical Engineeri
005
sity – Cairo
on
ing
‫للھندسة‬
‫لقاھرة‬
‫عشر‬ ‫الحادى‬ ‫ولى‬
‫الجيوتقنية‬ ‫و‬ ‫ئية‬
19‫مايو‬2005
‫شمس‬ ‫عين‬ ‫ة‬-‫الق‬
‫الدو‬ ‫المؤتمر‬
‫االنشائ‬
17-9
‫جامعة‬
Eleventh International Colloquium on ‫للھندسة‬ ‫عشر‬ ‫الحادى‬ ‫الدولى‬ ‫المؤتمر‬
Structural & Geotechnical Engineering ‫الجيوتقنية‬ ‫و‬ ‫االنشائية‬
17-19 May 2005 17-19‫مايو‬2005
Ain Shams University – Cairo ‫شمس‬ ‫عين‬ ‫جامعة‬-‫القاھرة‬
SUMMARY OF RESULTS
The results of the research program are summarized in table (1), which shows each trail with
its the number of levels and input variables, in addition to its accuracy percentage and (SSE)
value in case of generating, validation and total data sets. From the summary table, it could be
noted that:
a ) For the same data set the accuracy of the generated formula increases with its
complexity ( no. of levels ).
b ) Using constants in the data sets saves the extra levels that will be used to create
these constants, hence they make the conversion faster.
c ) For second, third and forth trials, it is noticed that the accuracy of the validation
data set is significantly lower than that of the generating data set, that means that
these trials produced good estimations in case of generating data set and poor
estimations in case of the validation data set. In other words, these three trails
generated a "Memorized" formulas not "Generalized" formulas.
d ) In spite of the simplicity of first trail formula, it produced a good estimations in
both cases, and due to its simplicity, it could be used in preliminary designs or
rough manual checking.
e ) The formula generated during the last trial is accurate enough to be applied in
design, the results indicates its validity in both generating and validation data sets,
hens, its generality and ability to be applied in the mentioned ranges of variables.
COMPARISON WITH EARLIER PREDICTION METHODS
In order to compare the generated formulas with earlier prediction methods, the capacities of
both generating and validation data sets arfe calculated using six well known methods which
are (Earth cone 1958), (Morse 1959), (Shichiri 1943), (Gopal 1987), (Sarac 1961) and
(Matsuo 1967). Figures from (3-23) to (3-27) represent the relationship between predicted and
experimental capacities for both generating and evaluation data sets for each method of these
six methods.
For (Matsuo 1967) method, the chart in Fig.(16) shows that the slope of the best fitting
line is (0.8982) and the coefficient of determination (R2
=0.778) which indicate a good
correlation and also means that the predicted capacities is about 90% the experimental ones.
Where Fig.(17) which represents (Sarac 1961) method and Fig.(18) which represents
(Shichiri 1943) method, indicate a fair correlation and also show that the predicted capacities
is about 60-66% the experimental ones. For (Sarac 1961) the slope of the best fitting line is
(0.6566) and the coefficient of determination (R2
=0.7388) and for (Shichiri 1943) the slope
of the best fitting line is (0.6134) and the coefficient of determination (R2
=0.7402).
For (Gopal 1987) method, the chart in Fig.(19) shows that the slope of the best fitting line is
(0.9863) and the coefficient of determination (R2
=0.3306) which indicate a poor correlation
and also means that the predicted capacities is almost the same as the experimental ones.
Where Fig.(20) which represents (Morse 1959) method and Fig.(21) which represents (Earth
cone 1958) method, indicate no correlation and also show a poor relationship between
predicted and experimental capacities.
Eleventh
Structura
Ain Sh
International
al & Geotechn
17-19 May 20
hams Univers
Colloquium o
nical Engineeri
005
sity – Cairo
on
ing
‫للھندسة‬
‫لقاھرة‬
‫عشر‬ ‫الحادى‬ ‫ولى‬
‫الجيوتقنية‬ ‫و‬ ‫ئية‬
19‫مايو‬2005
‫شمس‬ ‫عين‬ ‫ة‬-‫الق‬
‫الدو‬ ‫المؤتمر‬
‫االنشائ‬
17-9
‫جامعة‬
Eleventh
Structura
Ain Sh
International
al & Geotechn
17-19 May 20
hams Univers
Colloquium o
nical Engineeri
005
sity – Cairo
on
ing
‫للھندسة‬
‫لقاھرة‬
‫عشر‬ ‫الحادى‬ ‫ولى‬
‫الجيوتقنية‬ ‫و‬ ‫ئية‬
19‫مايو‬2005
‫شمس‬ ‫عين‬ ‫ة‬-‫الق‬
‫الدو‬ ‫المؤتمر‬
‫االنشائ‬
17-9
‫جامعة‬
Eleventh International Colloquium on ‫للھندسة‬ ‫عشر‬ ‫الحادى‬ ‫الدولى‬ ‫المؤتمر‬
Structural & Geotechnical Engineering ‫الجيوتقنية‬ ‫و‬ ‫االنشائية‬
17-19 May 2005 17-19‫مايو‬2005
Ain Shams University – Cairo ‫شمس‬ ‫عين‬ ‫جامعة‬-‫القاھرة‬
Figure 20: Representation of Morse formula - 1959
Figure 21: Representation of Earth cone formula - 1958
The results of the comparison are summarized in table (2), which shows the method
with its input variables in addition to its accuracy percentage and (SSE) value in case of
generating, validation and total data sets. From the summary table, it could be noted that:
a ) Earth cone and Morse methods have poor accuracy due to the neglecting the soil
cohesion. where the other earlier predicting methods shows a fair to good accuracy
according to their complexity.
b ) In spite of the simplicity of trail (1) formula, it shows an accuracy better than the
complicated earlier predicting methods.
c ) The best predicting method is trail (5) formula, which shows an excellent
accuracy ( about 90%).
y = 0.6377x
R2
= -0.677
0
10
20
30
40
50
60
0 10 20 30 40 50 60
Experimental capacity (ton)
Ppredictedcapacity(ton)
Generating set
Validation set
Best Fitting
y = 0.2812x
R2
= -0.9362
0
10
20
30
40
50
60
0 10 20 30 40 50 60
Experimental capacity (ton)
Ppredictedcapacity(ton)
Generating set
Validation set
Best Fitting
Eleventh
Structura
Ain Sh
International
al & Geotechn
17-19 May 20
hams Univers
Colloquium o
nical Engineeri
005
sity – Cairo
on
ing
‫للھندسة‬
‫لقاھرة‬
‫عشر‬ ‫الحادى‬ ‫ولى‬
‫الجيوتقنية‬ ‫و‬ ‫ئية‬
19‫مايو‬2005
‫شمس‬ ‫عين‬ ‫ة‬-‫الق‬
‫الدو‬ ‫المؤتمر‬
‫االنشائ‬
17-9
‫جامعة‬
Eleventh International Colloquium on ‫للھندسة‬ ‫عشر‬ ‫الحادى‬ ‫الدولى‬ ‫المؤتمر‬
Structural & Geotechnical Engineering ‫الجيوتقنية‬ ‫و‬ ‫االنشائية‬
17-19 May 2005 17-19‫مايو‬2005
Ain Shams University – Cairo ‫شمس‬ ‫عين‬ ‫جامعة‬-‫القاھرة‬
REFERENCES
1 Ayman Lotfy, (1992). “Uplift Resistance of Shallow Foundation”, M.S. Ain
Shams University.
2 Dzevad Sarac, (1975). “Bearing Capacity of Anchor Foundation as Loaded by
Vertical Force”, institute of geotechnics and Foundation engineering, Sarajevo.
3 Egyptian Ministry of Electricity and Energy, (1981). “Design Standard of
Transmission Steel towers”, Chapters 2, 12.
4 Holland, J. (1975). "Adaptation in Natural and Artificial Systems," Ann Arbor,
MI, University of Michigan Press.
5 Institute of Electrical Engineering of Japan, (1958). “Design Standard of
Transmission Steel towers”, JEC.127, pp. 35.39
6 Koza, J. R., (1994). "Genetic Programming-2," MIT Press, Cambridge, MA.
7 Matsuo M., (1967). “Study on the Uplift Resistance of Footing I”, Soils and
Foundations, Vol. 7, No. 4, pp. 1.37.
8 Matsuo M., (1968). “Study on the Uplift Resistance of Footing II” , Soils and
Foundations, Vol. 8, No. 1, pp. 18.48.
9 Michalewicz, Z. (1992)."Genetic Algorithms+Data Structure = Evaluation
Programs", Springer-Verlag Berlin Heidelberg, New York.
10 Riccardo, P. (1996). "Introduction To Evolutionary Computation," Collection of
Lectures, School of Computer Science, University of Birmingham, UK.
11 Saran S. and Rajan G. (1987). “Soil Anchors and Constitutive Lows “, Journal
of Geotechnical Engineering Division, ASCE, Vol. 112, GT(12), pp. 1084.1099
Prediction of uplift capacity using genetic programming

More Related Content

What's hot

Model Study of Slope Stability in Open Pit by Numerical Modeling Using the Fi...
Model Study of Slope Stability in Open Pit by Numerical Modeling Using the Fi...Model Study of Slope Stability in Open Pit by Numerical Modeling Using the Fi...
Model Study of Slope Stability in Open Pit by Numerical Modeling Using the Fi...CrimsonPublishersAMMS
 
High Resolution Earth's Gravitational Field
High Resolution Earth's Gravitational FieldHigh Resolution Earth's Gravitational Field
High Resolution Earth's Gravitational FieldAli Osman Öncel
 
Dynamic behaviour of double and triple adjacent 2D hills using boundary eleme...
Dynamic behaviour of double and triple adjacent 2D hills using boundary eleme...Dynamic behaviour of double and triple adjacent 2D hills using boundary eleme...
Dynamic behaviour of double and triple adjacent 2D hills using boundary eleme...Mehran Naghizadeh
 
2010 rock slope risk assesment based on geostructural anna
2010 rock slope risk assesment based on geostructural anna2010 rock slope risk assesment based on geostructural anna
2010 rock slope risk assesment based on geostructural annaMasagus Azizi
 
Prediction of tractve performance on soil surface
Prediction of tractve performance on soil surface Prediction of tractve performance on soil surface
Prediction of tractve performance on soil surface yogesh5158
 
ÖNCEL AKADEMİ: İSTANBUL DEPREMİ
ÖNCEL AKADEMİ: İSTANBUL DEPREMİÖNCEL AKADEMİ: İSTANBUL DEPREMİ
ÖNCEL AKADEMİ: İSTANBUL DEPREMİAli Osman Öncel
 
Geological mapping using satellite images.
Geological mapping using satellite images.Geological mapping using satellite images.
Geological mapping using satellite images.Diego Bedoya Gonzalez
 
DEWATERING-AN EFFECTIVE TOOL FOR SLOPE STABILIZATION
DEWATERING-AN EFFECTIVE TOOL FOR SLOPE STABILIZATIONDEWATERING-AN EFFECTIVE TOOL FOR SLOPE STABILIZATION
DEWATERING-AN EFFECTIVE TOOL FOR SLOPE STABILIZATIONRathin Biswas
 
Practical Local Geoid Modelling of Benin City, Nigeria from Gravimetric Obser...
Practical Local Geoid Modelling of Benin City, Nigeria from Gravimetric Obser...Practical Local Geoid Modelling of Benin City, Nigeria from Gravimetric Obser...
Practical Local Geoid Modelling of Benin City, Nigeria from Gravimetric Obser...IJAEMSJORNAL
 
3 d numerical modeling of supercritical flow in gradual expansions
3 d numerical modeling of supercritical flow in gradual expansions3 d numerical modeling of supercritical flow in gradual expansions
3 d numerical modeling of supercritical flow in gradual expansionsPercy Rosales
 
Implementation of finite volume method in creeping flow around a circular cyl...
Implementation of finite volume method in creeping flow around a circular cyl...Implementation of finite volume method in creeping flow around a circular cyl...
Implementation of finite volume method in creeping flow around a circular cyl...eSAT Journals
 
Bouguer anomaly and free-air anomaly correlation signatures in parts of Benue...
Bouguer anomaly and free-air anomaly correlation signatures in parts of Benue...Bouguer anomaly and free-air anomaly correlation signatures in parts of Benue...
Bouguer anomaly and free-air anomaly correlation signatures in parts of Benue...Premier Publishers
 
Earthquake and impact of soil type on content of the result spectrum
Earthquake and impact of soil type on content of the result spectrumEarthquake and impact of soil type on content of the result spectrum
Earthquake and impact of soil type on content of the result spectrumJournal of Research in Biology
 
Assessing 50 years of tropical Peruvian glacier volume change from multitempo...
Assessing 50 years of tropical Peruvian glacier volume change from multitempo...Assessing 50 years of tropical Peruvian glacier volume change from multitempo...
Assessing 50 years of tropical Peruvian glacier volume change from multitempo...InfoAndina CONDESAN
 
Optimization of 3 d geometrical soil model for multiple footing resting on sand
Optimization of 3 d geometrical soil model for multiple footing resting on sandOptimization of 3 d geometrical soil model for multiple footing resting on sand
Optimization of 3 d geometrical soil model for multiple footing resting on sandeSAT Journals
 
Fixity depth of offshore piles in elastoplastic soft clay under dynamic load
Fixity depth of offshore piles in elastoplastic soft clay under dynamic loadFixity depth of offshore piles in elastoplastic soft clay under dynamic load
Fixity depth of offshore piles in elastoplastic soft clay under dynamic loadeSAT Journals
 

What's hot (20)

Model Study of Slope Stability in Open Pit by Numerical Modeling Using the Fi...
Model Study of Slope Stability in Open Pit by Numerical Modeling Using the Fi...Model Study of Slope Stability in Open Pit by Numerical Modeling Using the Fi...
Model Study of Slope Stability in Open Pit by Numerical Modeling Using the Fi...
 
High Resolution Earth's Gravitational Field
High Resolution Earth's Gravitational FieldHigh Resolution Earth's Gravitational Field
High Resolution Earth's Gravitational Field
 
Dynamic behaviour of double and triple adjacent 2D hills using boundary eleme...
Dynamic behaviour of double and triple adjacent 2D hills using boundary eleme...Dynamic behaviour of double and triple adjacent 2D hills using boundary eleme...
Dynamic behaviour of double and triple adjacent 2D hills using boundary eleme...
 
2010 rock slope risk assesment based on geostructural anna
2010 rock slope risk assesment based on geostructural anna2010 rock slope risk assesment based on geostructural anna
2010 rock slope risk assesment based on geostructural anna
 
Prediction of tractve performance on soil surface
Prediction of tractve performance on soil surface Prediction of tractve performance on soil surface
Prediction of tractve performance on soil surface
 
ÖNCEL AKADEMİ: İSTANBUL DEPREMİ
ÖNCEL AKADEMİ: İSTANBUL DEPREMİÖNCEL AKADEMİ: İSTANBUL DEPREMİ
ÖNCEL AKADEMİ: İSTANBUL DEPREMİ
 
Dr.Philos._Disputas
Dr.Philos._DisputasDr.Philos._Disputas
Dr.Philos._Disputas
 
Geological mapping using satellite images.
Geological mapping using satellite images.Geological mapping using satellite images.
Geological mapping using satellite images.
 
DEWATERING-AN EFFECTIVE TOOL FOR SLOPE STABILIZATION
DEWATERING-AN EFFECTIVE TOOL FOR SLOPE STABILIZATIONDEWATERING-AN EFFECTIVE TOOL FOR SLOPE STABILIZATION
DEWATERING-AN EFFECTIVE TOOL FOR SLOPE STABILIZATION
 
Practical Local Geoid Modelling of Benin City, Nigeria from Gravimetric Obser...
Practical Local Geoid Modelling of Benin City, Nigeria from Gravimetric Obser...Practical Local Geoid Modelling of Benin City, Nigeria from Gravimetric Obser...
Practical Local Geoid Modelling of Benin City, Nigeria from Gravimetric Obser...
 
3 d numerical modeling of supercritical flow in gradual expansions
3 d numerical modeling of supercritical flow in gradual expansions3 d numerical modeling of supercritical flow in gradual expansions
3 d numerical modeling of supercritical flow in gradual expansions
 
Implementation of finite volume method in creeping flow around a circular cyl...
Implementation of finite volume method in creeping flow around a circular cyl...Implementation of finite volume method in creeping flow around a circular cyl...
Implementation of finite volume method in creeping flow around a circular cyl...
 
Bouguer anomaly and free-air anomaly correlation signatures in parts of Benue...
Bouguer anomaly and free-air anomaly correlation signatures in parts of Benue...Bouguer anomaly and free-air anomaly correlation signatures in parts of Benue...
Bouguer anomaly and free-air anomaly correlation signatures in parts of Benue...
 
Aijrfans14 288
Aijrfans14 288Aijrfans14 288
Aijrfans14 288
 
E05833135
E05833135E05833135
E05833135
 
Earthquake and impact of soil type on content of the result spectrum
Earthquake and impact of soil type on content of the result spectrumEarthquake and impact of soil type on content of the result spectrum
Earthquake and impact of soil type on content of the result spectrum
 
Assessing 50 years of tropical Peruvian glacier volume change from multitempo...
Assessing 50 years of tropical Peruvian glacier volume change from multitempo...Assessing 50 years of tropical Peruvian glacier volume change from multitempo...
Assessing 50 years of tropical Peruvian glacier volume change from multitempo...
 
segam2015-5925444%2E1
segam2015-5925444%2E1segam2015-5925444%2E1
segam2015-5925444%2E1
 
Optimization of 3 d geometrical soil model for multiple footing resting on sand
Optimization of 3 d geometrical soil model for multiple footing resting on sandOptimization of 3 d geometrical soil model for multiple footing resting on sand
Optimization of 3 d geometrical soil model for multiple footing resting on sand
 
Fixity depth of offshore piles in elastoplastic soft clay under dynamic load
Fixity depth of offshore piles in elastoplastic soft clay under dynamic loadFixity depth of offshore piles in elastoplastic soft clay under dynamic load
Fixity depth of offshore piles in elastoplastic soft clay under dynamic load
 

Viewers also liked

Інноваційний проект "Шкільна кіностудія"
Інноваційний проект "Шкільна кіностудія"Інноваційний проект "Шкільна кіностудія"
Інноваційний проект "Шкільна кіностудія"Елена Оносова
 
Certificate ratings (media work)
Certificate ratings (media work)Certificate ratings (media work)
Certificate ratings (media work)Jade Moore
 
Financial_Doctors_Project_Report (1).PDF
Financial_Doctors_Project_Report (1).PDFFinancial_Doctors_Project_Report (1).PDF
Financial_Doctors_Project_Report (1).PDFAmit Singh
 
wages system
wages systemwages system
wages systemEr Gupta
 
DCBADD2015 make an impact with better dashboards
DCBADD2015 make an impact with better dashboardsDCBADD2015 make an impact with better dashboards
DCBADD2015 make an impact with better dashboardsIIBADCBADD
 
An Analysis of Real Estate Financing (200-2015)
An Analysis of Real Estate Financing (200-2015)An Analysis of Real Estate Financing (200-2015)
An Analysis of Real Estate Financing (200-2015)Sharooq Mohammed
 
Apple watch vs LG G R
Apple watch vs LG G RApple watch vs LG G R
Apple watch vs LG G Rhaha loser
 

Viewers also liked (17)

Інноваційний проект "Шкільна кіностудія"
Інноваційний проект "Шкільна кіностудія"Інноваційний проект "Шкільна кіностудія"
Інноваційний проект "Шкільна кіностудія"
 
Certificate ratings (media work)
Certificate ratings (media work)Certificate ratings (media work)
Certificate ratings (media work)
 
Unidad 1 Los Paisajes de España
Unidad 1 Los Paisajes de EspañaUnidad 1 Los Paisajes de España
Unidad 1 Los Paisajes de España
 
Chapter 2 demand & supply new
Chapter 2 demand & supply newChapter 2 demand & supply new
Chapter 2 demand & supply new
 
Untitled Presentation
Untitled PresentationUntitled Presentation
Untitled Presentation
 
самоосвіта завуч
самоосвіта завучсамоосвіта завуч
самоосвіта завуч
 
Tema 0 La Tierra en el Universo
Tema 0 La Tierra en el UniversoTema 0 La Tierra en el Universo
Tema 0 La Tierra en el Universo
 
Tema 7 España y la Unión Europea
Tema 7 España y la Unión EuropeaTema 7 España y la Unión Europea
Tema 7 España y la Unión Europea
 
Financial_Doctors_Project_Report (1).PDF
Financial_Doctors_Project_Report (1).PDFFinancial_Doctors_Project_Report (1).PDF
Financial_Doctors_Project_Report (1).PDF
 
wages system
wages systemwages system
wages system
 
The Human Body and Reprodution
The Human Body and ReprodutionThe Human Body and Reprodution
The Human Body and Reprodution
 
DGuenaga_Report
DGuenaga_ReportDGuenaga_Report
DGuenaga_Report
 
Photoshop Tutorial
Photoshop TutorialPhotoshop Tutorial
Photoshop Tutorial
 
DCBADD2015 make an impact with better dashboards
DCBADD2015 make an impact with better dashboardsDCBADD2015 make an impact with better dashboards
DCBADD2015 make an impact with better dashboards
 
An Analysis of Real Estate Financing (200-2015)
An Analysis of Real Estate Financing (200-2015)An Analysis of Real Estate Financing (200-2015)
An Analysis of Real Estate Financing (200-2015)
 
David Chen at Rubinstein
David Chen at RubinsteinDavid Chen at Rubinstein
David Chen at Rubinstein
 
Apple watch vs LG G R
Apple watch vs LG G RApple watch vs LG G R
Apple watch vs LG G R
 

Similar to Prediction of uplift capacity using genetic programming

Field and Theoretical Analysis of Accelerated Consolidation Using Vertical Dr...
Field and Theoretical Analysis of Accelerated Consolidation Using Vertical Dr...Field and Theoretical Analysis of Accelerated Consolidation Using Vertical Dr...
Field and Theoretical Analysis of Accelerated Consolidation Using Vertical Dr...inventionjournals
 
Slope stability analysis methods
Slope stability analysis methodsSlope stability analysis methods
Slope stability analysis methodszaidalFarhan1
 
Fixity depth of offshore piles in elastoplastic soft clay under dynamic load
Fixity depth of offshore piles in elastoplastic soft clay under dynamic loadFixity depth of offshore piles in elastoplastic soft clay under dynamic load
Fixity depth of offshore piles in elastoplastic soft clay under dynamic loadeSAT Journals
 
ULTIMATE BEARING CAPACITY OF CIRCULAR FOOTING ON LAYERED SOILS
ULTIMATE BEARING CAPACITY OF CIRCULAR FOOTING ON LAYERED SOILSULTIMATE BEARING CAPACITY OF CIRCULAR FOOTING ON LAYERED SOILS
ULTIMATE BEARING CAPACITY OF CIRCULAR FOOTING ON LAYERED SOILSVipin Joshi
 
Contribution to long term performance of piled raft foundation in clayey soil
Contribution to long term performance of piled raft foundation in clayey soilContribution to long term performance of piled raft foundation in clayey soil
Contribution to long term performance of piled raft foundation in clayey soilIAEME Publication
 
Bearing Capacity of shallow foundation on slopes (PhD Comprehenssive ppt2017)
Bearing Capacity of shallow foundation on slopes (PhD Comprehenssive ppt2017)Bearing Capacity of shallow foundation on slopes (PhD Comprehenssive ppt2017)
Bearing Capacity of shallow foundation on slopes (PhD Comprehenssive ppt2017)Nabam Budh
 
Analysis of soil arching effect with different cross-section anti-slide pile
Analysis of soil arching effect with different cross-section anti-slide pileAnalysis of soil arching effect with different cross-section anti-slide pile
Analysis of soil arching effect with different cross-section anti-slide pileIJERA Editor
 
IRJET- The Effect of Soil-Structure Interaction on Raft Foundation
IRJET- The Effect of Soil-Structure Interaction on Raft FoundationIRJET- The Effect of Soil-Structure Interaction on Raft Foundation
IRJET- The Effect of Soil-Structure Interaction on Raft FoundationIRJET Journal
 
A COMPARATIVE STUDY OF VARIOUS METHODS TO EVALUATE IMPEDANCE FUNCTION FOR SHA...
A COMPARATIVE STUDY OF VARIOUS METHODS TO EVALUATE IMPEDANCE FUNCTION FOR SHA...A COMPARATIVE STUDY OF VARIOUS METHODS TO EVALUATE IMPEDANCE FUNCTION FOR SHA...
A COMPARATIVE STUDY OF VARIOUS METHODS TO EVALUATE IMPEDANCE FUNCTION FOR SHA...Samirsinh Parmar
 
Experimental estimate of ultimate bearing capacity and settlement for rectang
Experimental estimate of ultimate bearing capacity and settlement for rectangExperimental estimate of ultimate bearing capacity and settlement for rectang
Experimental estimate of ultimate bearing capacity and settlement for rectangIAEME Publication
 
Limit States Solution to CSCS Orthotropic Thin Rectangular Plate Carrying Tra...
Limit States Solution to CSCS Orthotropic Thin Rectangular Plate Carrying Tra...Limit States Solution to CSCS Orthotropic Thin Rectangular Plate Carrying Tra...
Limit States Solution to CSCS Orthotropic Thin Rectangular Plate Carrying Tra...ijtsrd
 
Analysis of Beams Resting on Nonlinear Elastic Half Sapce Foundation.docx
Analysis of Beams Resting on Nonlinear Elastic Half Sapce Foundation.docxAnalysis of Beams Resting on Nonlinear Elastic Half Sapce Foundation.docx
Analysis of Beams Resting on Nonlinear Elastic Half Sapce Foundation.docxAdnan Lazem
 
Pseudo static passive response of retaining wall supporting c- backfill
Pseudo static passive response of retaining wall supporting c- backfillPseudo static passive response of retaining wall supporting c- backfill
Pseudo static passive response of retaining wall supporting c- backfilleSAT Journals
 
Pseudo static passive response of retaining wall supporting c-φ backfill
Pseudo static passive response of retaining wall supporting c-φ backfillPseudo static passive response of retaining wall supporting c-φ backfill
Pseudo static passive response of retaining wall supporting c-φ backfilleSAT Publishing House
 
Modeling Soil Pressure-Sinkage Characteristic as Affected by Sinkage rate usi...
Modeling Soil Pressure-Sinkage Characteristic as Affected by Sinkage rate usi...Modeling Soil Pressure-Sinkage Characteristic as Affected by Sinkage rate usi...
Modeling Soil Pressure-Sinkage Characteristic as Affected by Sinkage rate usi...J. Agricultural Machinery
 
Circular Failure-Hoek&Bray.pptx
Circular Failure-Hoek&Bray.pptxCircular Failure-Hoek&Bray.pptx
Circular Failure-Hoek&Bray.pptxChunaramChoudhary1
 

Similar to Prediction of uplift capacity using genetic programming (20)

Field and Theoretical Analysis of Accelerated Consolidation Using Vertical Dr...
Field and Theoretical Analysis of Accelerated Consolidation Using Vertical Dr...Field and Theoretical Analysis of Accelerated Consolidation Using Vertical Dr...
Field and Theoretical Analysis of Accelerated Consolidation Using Vertical Dr...
 
Slope stability analysis methods
Slope stability analysis methodsSlope stability analysis methods
Slope stability analysis methods
 
Slope stability
Slope stabilitySlope stability
Slope stability
 
Fixity depth of offshore piles in elastoplastic soft clay under dynamic load
Fixity depth of offshore piles in elastoplastic soft clay under dynamic loadFixity depth of offshore piles in elastoplastic soft clay under dynamic load
Fixity depth of offshore piles in elastoplastic soft clay under dynamic load
 
ULTIMATE BEARING CAPACITY OF CIRCULAR FOOTING ON LAYERED SOILS
ULTIMATE BEARING CAPACITY OF CIRCULAR FOOTING ON LAYERED SOILSULTIMATE BEARING CAPACITY OF CIRCULAR FOOTING ON LAYERED SOILS
ULTIMATE BEARING CAPACITY OF CIRCULAR FOOTING ON LAYERED SOILS
 
F1303023038
F1303023038F1303023038
F1303023038
 
Contribution to long term performance of piled raft foundation in clayey soil
Contribution to long term performance of piled raft foundation in clayey soilContribution to long term performance of piled raft foundation in clayey soil
Contribution to long term performance of piled raft foundation in clayey soil
 
Bearing Capacity of shallow foundation on slopes (PhD Comprehenssive ppt2017)
Bearing Capacity of shallow foundation on slopes (PhD Comprehenssive ppt2017)Bearing Capacity of shallow foundation on slopes (PhD Comprehenssive ppt2017)
Bearing Capacity of shallow foundation on slopes (PhD Comprehenssive ppt2017)
 
Analysis of soil arching effect with different cross-section anti-slide pile
Analysis of soil arching effect with different cross-section anti-slide pileAnalysis of soil arching effect with different cross-section anti-slide pile
Analysis of soil arching effect with different cross-section anti-slide pile
 
IRJET- The Effect of Soil-Structure Interaction on Raft Foundation
IRJET- The Effect of Soil-Structure Interaction on Raft FoundationIRJET- The Effect of Soil-Structure Interaction on Raft Foundation
IRJET- The Effect of Soil-Structure Interaction on Raft Foundation
 
Reaction piling
Reaction pilingReaction piling
Reaction piling
 
A COMPARATIVE STUDY OF VARIOUS METHODS TO EVALUATE IMPEDANCE FUNCTION FOR SHA...
A COMPARATIVE STUDY OF VARIOUS METHODS TO EVALUATE IMPEDANCE FUNCTION FOR SHA...A COMPARATIVE STUDY OF VARIOUS METHODS TO EVALUATE IMPEDANCE FUNCTION FOR SHA...
A COMPARATIVE STUDY OF VARIOUS METHODS TO EVALUATE IMPEDANCE FUNCTION FOR SHA...
 
Experimental estimate of ultimate bearing capacity and settlement for rectang
Experimental estimate of ultimate bearing capacity and settlement for rectangExperimental estimate of ultimate bearing capacity and settlement for rectang
Experimental estimate of ultimate bearing capacity and settlement for rectang
 
Limit States Solution to CSCS Orthotropic Thin Rectangular Plate Carrying Tra...
Limit States Solution to CSCS Orthotropic Thin Rectangular Plate Carrying Tra...Limit States Solution to CSCS Orthotropic Thin Rectangular Plate Carrying Tra...
Limit States Solution to CSCS Orthotropic Thin Rectangular Plate Carrying Tra...
 
Analysis of Beams Resting on Nonlinear Elastic Half Sapce Foundation.docx
Analysis of Beams Resting on Nonlinear Elastic Half Sapce Foundation.docxAnalysis of Beams Resting on Nonlinear Elastic Half Sapce Foundation.docx
Analysis of Beams Resting on Nonlinear Elastic Half Sapce Foundation.docx
 
Pseudo static passive response of retaining wall supporting c- backfill
Pseudo static passive response of retaining wall supporting c- backfillPseudo static passive response of retaining wall supporting c- backfill
Pseudo static passive response of retaining wall supporting c- backfill
 
Pseudo static passive response of retaining wall supporting c-φ backfill
Pseudo static passive response of retaining wall supporting c-φ backfillPseudo static passive response of retaining wall supporting c-φ backfill
Pseudo static passive response of retaining wall supporting c-φ backfill
 
Modeling Soil Pressure-Sinkage Characteristic as Affected by Sinkage rate usi...
Modeling Soil Pressure-Sinkage Characteristic as Affected by Sinkage rate usi...Modeling Soil Pressure-Sinkage Characteristic as Affected by Sinkage rate usi...
Modeling Soil Pressure-Sinkage Characteristic as Affected by Sinkage rate usi...
 
2002 rahim
2002 rahim2002 rahim
2002 rahim
 
Circular Failure-Hoek&Bray.pptx
Circular Failure-Hoek&Bray.pptxCircular Failure-Hoek&Bray.pptx
Circular Failure-Hoek&Bray.pptx
 

More from Ahmed Ebid

17 decision support system for optimum soft clay improvement technique
17 decision support system for optimum soft clay improvement technique17 decision support system for optimum soft clay improvement technique
17 decision support system for optimum soft clay improvement techniqueAhmed Ebid
 
Predicting (Nk) factor of (CPT) test using (GP): Comparative Study of MEPX & GN7
Predicting (Nk) factor of (CPT) test using (GP): Comparative Study of MEPX & GN7Predicting (Nk) factor of (CPT) test using (GP): Comparative Study of MEPX & GN7
Predicting (Nk) factor of (CPT) test using (GP): Comparative Study of MEPX & GN7Ahmed Ebid
 
15 experimental study for strengthening of rc rectangular columns with anchor...
15 experimental study for strengthening of rc rectangular columns with anchor...15 experimental study for strengthening of rc rectangular columns with anchor...
15 experimental study for strengthening of rc rectangular columns with anchor...Ahmed Ebid
 
Mathematical approach-to-simulate-soil-behavior-under-shallow-compaction
Mathematical approach-to-simulate-soil-behavior-under-shallow-compactionMathematical approach-to-simulate-soil-behavior-under-shallow-compaction
Mathematical approach-to-simulate-soil-behavior-under-shallow-compactionAhmed Ebid
 
13 strength-characteristics-of-handy-lay-up-gfrp-i-beams
13 strength-characteristics-of-handy-lay-up-gfrp-i-beams13 strength-characteristics-of-handy-lay-up-gfrp-i-beams
13 strength-characteristics-of-handy-lay-up-gfrp-i-beamsAhmed Ebid
 
10 simple mathematical approach for granular fill
10  simple mathematical approach for granular fill 10  simple mathematical approach for granular fill
10 simple mathematical approach for granular fill Ahmed Ebid
 
Image compression using genetic programming
Image compression using genetic programmingImage compression using genetic programming
Image compression using genetic programmingAhmed Ebid
 
optimum alternative to reduce column size considering behavior and cost impac...
optimum alternative to reduce column size considering behavior and cost impac...optimum alternative to reduce column size considering behavior and cost impac...
optimum alternative to reduce column size considering behavior and cost impac...Ahmed Ebid
 
Prediction of soil liquefaction using genetic programming
Prediction of soil liquefaction using genetic programmingPrediction of soil liquefaction using genetic programming
Prediction of soil liquefaction using genetic programmingAhmed Ebid
 
Theoretical study for r.c. columns strengthened with gfrp with different main...
Theoretical study for r.c. columns strengthened with gfrp with different main...Theoretical study for r.c. columns strengthened with gfrp with different main...
Theoretical study for r.c. columns strengthened with gfrp with different main...Ahmed Ebid
 
Optimum replacement depth to control heave of swelling clays
Optimum replacement depth to control heave of swelling claysOptimum replacement depth to control heave of swelling clays
Optimum replacement depth to control heave of swelling claysAhmed Ebid
 
Optimum penetration depth of cantilever sheet pile walls in dry granular soil
Optimum penetration depth of cantilever sheet pile walls in dry granular soil Optimum penetration depth of cantilever sheet pile walls in dry granular soil
Optimum penetration depth of cantilever sheet pile walls in dry granular soil Ahmed Ebid
 
Estimating the economic quantities of different concrete slab types
Estimating the economic quantities of different concrete slab typesEstimating the economic quantities of different concrete slab types
Estimating the economic quantities of different concrete slab typesAhmed Ebid
 
Simplified approach to consider cracking effect on the behavior of laterally ...
Simplified approach to consider cracking effect on the behavior of laterally ...Simplified approach to consider cracking effect on the behavior of laterally ...
Simplified approach to consider cracking effect on the behavior of laterally ...Ahmed Ebid
 
Application of risk analysis in uplift foundation
Application of risk analysis in uplift foundationApplication of risk analysis in uplift foundation
Application of risk analysis in uplift foundationAhmed Ebid
 

More from Ahmed Ebid (15)

17 decision support system for optimum soft clay improvement technique
17 decision support system for optimum soft clay improvement technique17 decision support system for optimum soft clay improvement technique
17 decision support system for optimum soft clay improvement technique
 
Predicting (Nk) factor of (CPT) test using (GP): Comparative Study of MEPX & GN7
Predicting (Nk) factor of (CPT) test using (GP): Comparative Study of MEPX & GN7Predicting (Nk) factor of (CPT) test using (GP): Comparative Study of MEPX & GN7
Predicting (Nk) factor of (CPT) test using (GP): Comparative Study of MEPX & GN7
 
15 experimental study for strengthening of rc rectangular columns with anchor...
15 experimental study for strengthening of rc rectangular columns with anchor...15 experimental study for strengthening of rc rectangular columns with anchor...
15 experimental study for strengthening of rc rectangular columns with anchor...
 
Mathematical approach-to-simulate-soil-behavior-under-shallow-compaction
Mathematical approach-to-simulate-soil-behavior-under-shallow-compactionMathematical approach-to-simulate-soil-behavior-under-shallow-compaction
Mathematical approach-to-simulate-soil-behavior-under-shallow-compaction
 
13 strength-characteristics-of-handy-lay-up-gfrp-i-beams
13 strength-characteristics-of-handy-lay-up-gfrp-i-beams13 strength-characteristics-of-handy-lay-up-gfrp-i-beams
13 strength-characteristics-of-handy-lay-up-gfrp-i-beams
 
10 simple mathematical approach for granular fill
10  simple mathematical approach for granular fill 10  simple mathematical approach for granular fill
10 simple mathematical approach for granular fill
 
Image compression using genetic programming
Image compression using genetic programmingImage compression using genetic programming
Image compression using genetic programming
 
optimum alternative to reduce column size considering behavior and cost impac...
optimum alternative to reduce column size considering behavior and cost impac...optimum alternative to reduce column size considering behavior and cost impac...
optimum alternative to reduce column size considering behavior and cost impac...
 
Prediction of soil liquefaction using genetic programming
Prediction of soil liquefaction using genetic programmingPrediction of soil liquefaction using genetic programming
Prediction of soil liquefaction using genetic programming
 
Theoretical study for r.c. columns strengthened with gfrp with different main...
Theoretical study for r.c. columns strengthened with gfrp with different main...Theoretical study for r.c. columns strengthened with gfrp with different main...
Theoretical study for r.c. columns strengthened with gfrp with different main...
 
Optimum replacement depth to control heave of swelling clays
Optimum replacement depth to control heave of swelling claysOptimum replacement depth to control heave of swelling clays
Optimum replacement depth to control heave of swelling clays
 
Optimum penetration depth of cantilever sheet pile walls in dry granular soil
Optimum penetration depth of cantilever sheet pile walls in dry granular soil Optimum penetration depth of cantilever sheet pile walls in dry granular soil
Optimum penetration depth of cantilever sheet pile walls in dry granular soil
 
Estimating the economic quantities of different concrete slab types
Estimating the economic quantities of different concrete slab typesEstimating the economic quantities of different concrete slab types
Estimating the economic quantities of different concrete slab types
 
Simplified approach to consider cracking effect on the behavior of laterally ...
Simplified approach to consider cracking effect on the behavior of laterally ...Simplified approach to consider cracking effect on the behavior of laterally ...
Simplified approach to consider cracking effect on the behavior of laterally ...
 
Application of risk analysis in uplift foundation
Application of risk analysis in uplift foundationApplication of risk analysis in uplift foundation
Application of risk analysis in uplift foundation
 

Recently uploaded

Call Girls Service Nagpur Tanvi Call 7001035870 Meet With Nagpur Escorts
Call Girls Service Nagpur Tanvi Call 7001035870 Meet With Nagpur EscortsCall Girls Service Nagpur Tanvi Call 7001035870 Meet With Nagpur Escorts
Call Girls Service Nagpur Tanvi Call 7001035870 Meet With Nagpur EscortsCall Girls in Nagpur High Profile
 
HARMONY IN THE NATURE AND EXISTENCE - Unit-IV
HARMONY IN THE NATURE AND EXISTENCE - Unit-IVHARMONY IN THE NATURE AND EXISTENCE - Unit-IV
HARMONY IN THE NATURE AND EXISTENCE - Unit-IVRajaP95
 
Sheet Pile Wall Design and Construction: A Practical Guide for Civil Engineer...
Sheet Pile Wall Design and Construction: A Practical Guide for Civil Engineer...Sheet Pile Wall Design and Construction: A Practical Guide for Civil Engineer...
Sheet Pile Wall Design and Construction: A Practical Guide for Civil Engineer...Dr.Costas Sachpazis
 
UNIT-III FMM. DIMENSIONAL ANALYSIS
UNIT-III FMM.        DIMENSIONAL ANALYSISUNIT-III FMM.        DIMENSIONAL ANALYSIS
UNIT-III FMM. DIMENSIONAL ANALYSISrknatarajan
 
(ANVI) Koregaon Park Call Girls Just Call 7001035870 [ Cash on Delivery ] Pun...
(ANVI) Koregaon Park Call Girls Just Call 7001035870 [ Cash on Delivery ] Pun...(ANVI) Koregaon Park Call Girls Just Call 7001035870 [ Cash on Delivery ] Pun...
(ANVI) Koregaon Park Call Girls Just Call 7001035870 [ Cash on Delivery ] Pun...ranjana rawat
 
Model Call Girl in Narela Delhi reach out to us at 🔝8264348440🔝
Model Call Girl in Narela Delhi reach out to us at 🔝8264348440🔝Model Call Girl in Narela Delhi reach out to us at 🔝8264348440🔝
Model Call Girl in Narela Delhi reach out to us at 🔝8264348440🔝soniya singh
 
The Most Attractive Pune Call Girls Budhwar Peth 8250192130 Will You Miss Thi...
The Most Attractive Pune Call Girls Budhwar Peth 8250192130 Will You Miss Thi...The Most Attractive Pune Call Girls Budhwar Peth 8250192130 Will You Miss Thi...
The Most Attractive Pune Call Girls Budhwar Peth 8250192130 Will You Miss Thi...ranjana rawat
 
Processing & Properties of Floor and Wall Tiles.pptx
Processing & Properties of Floor and Wall Tiles.pptxProcessing & Properties of Floor and Wall Tiles.pptx
Processing & Properties of Floor and Wall Tiles.pptxpranjaldaimarysona
 
(TARA) Talegaon Dabhade Call Girls Just Call 7001035870 [ Cash on Delivery ] ...
(TARA) Talegaon Dabhade Call Girls Just Call 7001035870 [ Cash on Delivery ] ...(TARA) Talegaon Dabhade Call Girls Just Call 7001035870 [ Cash on Delivery ] ...
(TARA) Talegaon Dabhade Call Girls Just Call 7001035870 [ Cash on Delivery ] ...ranjana rawat
 
SPICE PARK APR2024 ( 6,793 SPICE Models )
SPICE PARK APR2024 ( 6,793 SPICE Models )SPICE PARK APR2024 ( 6,793 SPICE Models )
SPICE PARK APR2024 ( 6,793 SPICE Models )Tsuyoshi Horigome
 
Extrusion Processes and Their Limitations
Extrusion Processes and Their LimitationsExtrusion Processes and Their Limitations
Extrusion Processes and Their Limitations120cr0395
 
Coefficient of Thermal Expansion and their Importance.pptx
Coefficient of Thermal Expansion and their Importance.pptxCoefficient of Thermal Expansion and their Importance.pptx
Coefficient of Thermal Expansion and their Importance.pptxAsutosh Ranjan
 
VIP Call Girls Service Kondapur Hyderabad Call +91-8250192130
VIP Call Girls Service Kondapur Hyderabad Call +91-8250192130VIP Call Girls Service Kondapur Hyderabad Call +91-8250192130
VIP Call Girls Service Kondapur Hyderabad Call +91-8250192130Suhani Kapoor
 
High Profile Call Girls Nagpur Meera Call 7001035870 Meet With Nagpur Escorts
High Profile Call Girls Nagpur Meera Call 7001035870 Meet With Nagpur EscortsHigh Profile Call Girls Nagpur Meera Call 7001035870 Meet With Nagpur Escorts
High Profile Call Girls Nagpur Meera Call 7001035870 Meet With Nagpur EscortsCall Girls in Nagpur High Profile
 
APPLICATIONS-AC/DC DRIVES-OPERATING CHARACTERISTICS
APPLICATIONS-AC/DC DRIVES-OPERATING CHARACTERISTICSAPPLICATIONS-AC/DC DRIVES-OPERATING CHARACTERISTICS
APPLICATIONS-AC/DC DRIVES-OPERATING CHARACTERISTICSKurinjimalarL3
 
Introduction to Multiple Access Protocol.pptx
Introduction to Multiple Access Protocol.pptxIntroduction to Multiple Access Protocol.pptx
Introduction to Multiple Access Protocol.pptxupamatechverse
 
Call for Papers - African Journal of Biological Sciences, E-ISSN: 2663-2187, ...
Call for Papers - African Journal of Biological Sciences, E-ISSN: 2663-2187, ...Call for Papers - African Journal of Biological Sciences, E-ISSN: 2663-2187, ...
Call for Papers - African Journal of Biological Sciences, E-ISSN: 2663-2187, ...Christo Ananth
 

Recently uploaded (20)

Call Girls Service Nagpur Tanvi Call 7001035870 Meet With Nagpur Escorts
Call Girls Service Nagpur Tanvi Call 7001035870 Meet With Nagpur EscortsCall Girls Service Nagpur Tanvi Call 7001035870 Meet With Nagpur Escorts
Call Girls Service Nagpur Tanvi Call 7001035870 Meet With Nagpur Escorts
 
HARMONY IN THE NATURE AND EXISTENCE - Unit-IV
HARMONY IN THE NATURE AND EXISTENCE - Unit-IVHARMONY IN THE NATURE AND EXISTENCE - Unit-IV
HARMONY IN THE NATURE AND EXISTENCE - Unit-IV
 
Sheet Pile Wall Design and Construction: A Practical Guide for Civil Engineer...
Sheet Pile Wall Design and Construction: A Practical Guide for Civil Engineer...Sheet Pile Wall Design and Construction: A Practical Guide for Civil Engineer...
Sheet Pile Wall Design and Construction: A Practical Guide for Civil Engineer...
 
UNIT-III FMM. DIMENSIONAL ANALYSIS
UNIT-III FMM.        DIMENSIONAL ANALYSISUNIT-III FMM.        DIMENSIONAL ANALYSIS
UNIT-III FMM. DIMENSIONAL ANALYSIS
 
★ CALL US 9953330565 ( HOT Young Call Girls In Badarpur delhi NCR
★ CALL US 9953330565 ( HOT Young Call Girls In Badarpur delhi NCR★ CALL US 9953330565 ( HOT Young Call Girls In Badarpur delhi NCR
★ CALL US 9953330565 ( HOT Young Call Girls In Badarpur delhi NCR
 
Call Us -/9953056974- Call Girls In Vikaspuri-/- Delhi NCR
Call Us -/9953056974- Call Girls In Vikaspuri-/- Delhi NCRCall Us -/9953056974- Call Girls In Vikaspuri-/- Delhi NCR
Call Us -/9953056974- Call Girls In Vikaspuri-/- Delhi NCR
 
(ANVI) Koregaon Park Call Girls Just Call 7001035870 [ Cash on Delivery ] Pun...
(ANVI) Koregaon Park Call Girls Just Call 7001035870 [ Cash on Delivery ] Pun...(ANVI) Koregaon Park Call Girls Just Call 7001035870 [ Cash on Delivery ] Pun...
(ANVI) Koregaon Park Call Girls Just Call 7001035870 [ Cash on Delivery ] Pun...
 
Model Call Girl in Narela Delhi reach out to us at 🔝8264348440🔝
Model Call Girl in Narela Delhi reach out to us at 🔝8264348440🔝Model Call Girl in Narela Delhi reach out to us at 🔝8264348440🔝
Model Call Girl in Narela Delhi reach out to us at 🔝8264348440🔝
 
The Most Attractive Pune Call Girls Budhwar Peth 8250192130 Will You Miss Thi...
The Most Attractive Pune Call Girls Budhwar Peth 8250192130 Will You Miss Thi...The Most Attractive Pune Call Girls Budhwar Peth 8250192130 Will You Miss Thi...
The Most Attractive Pune Call Girls Budhwar Peth 8250192130 Will You Miss Thi...
 
Processing & Properties of Floor and Wall Tiles.pptx
Processing & Properties of Floor and Wall Tiles.pptxProcessing & Properties of Floor and Wall Tiles.pptx
Processing & Properties of Floor and Wall Tiles.pptx
 
(TARA) Talegaon Dabhade Call Girls Just Call 7001035870 [ Cash on Delivery ] ...
(TARA) Talegaon Dabhade Call Girls Just Call 7001035870 [ Cash on Delivery ] ...(TARA) Talegaon Dabhade Call Girls Just Call 7001035870 [ Cash on Delivery ] ...
(TARA) Talegaon Dabhade Call Girls Just Call 7001035870 [ Cash on Delivery ] ...
 
SPICE PARK APR2024 ( 6,793 SPICE Models )
SPICE PARK APR2024 ( 6,793 SPICE Models )SPICE PARK APR2024 ( 6,793 SPICE Models )
SPICE PARK APR2024 ( 6,793 SPICE Models )
 
Extrusion Processes and Their Limitations
Extrusion Processes and Their LimitationsExtrusion Processes and Their Limitations
Extrusion Processes and Their Limitations
 
Coefficient of Thermal Expansion and their Importance.pptx
Coefficient of Thermal Expansion and their Importance.pptxCoefficient of Thermal Expansion and their Importance.pptx
Coefficient of Thermal Expansion and their Importance.pptx
 
VIP Call Girls Service Kondapur Hyderabad Call +91-8250192130
VIP Call Girls Service Kondapur Hyderabad Call +91-8250192130VIP Call Girls Service Kondapur Hyderabad Call +91-8250192130
VIP Call Girls Service Kondapur Hyderabad Call +91-8250192130
 
High Profile Call Girls Nagpur Meera Call 7001035870 Meet With Nagpur Escorts
High Profile Call Girls Nagpur Meera Call 7001035870 Meet With Nagpur EscortsHigh Profile Call Girls Nagpur Meera Call 7001035870 Meet With Nagpur Escorts
High Profile Call Girls Nagpur Meera Call 7001035870 Meet With Nagpur Escorts
 
APPLICATIONS-AC/DC DRIVES-OPERATING CHARACTERISTICS
APPLICATIONS-AC/DC DRIVES-OPERATING CHARACTERISTICSAPPLICATIONS-AC/DC DRIVES-OPERATING CHARACTERISTICS
APPLICATIONS-AC/DC DRIVES-OPERATING CHARACTERISTICS
 
DJARUM4D - SLOT GACOR ONLINE | SLOT DEMO ONLINE
DJARUM4D - SLOT GACOR ONLINE | SLOT DEMO ONLINEDJARUM4D - SLOT GACOR ONLINE | SLOT DEMO ONLINE
DJARUM4D - SLOT GACOR ONLINE | SLOT DEMO ONLINE
 
Introduction to Multiple Access Protocol.pptx
Introduction to Multiple Access Protocol.pptxIntroduction to Multiple Access Protocol.pptx
Introduction to Multiple Access Protocol.pptx
 
Call for Papers - African Journal of Biological Sciences, E-ISSN: 2663-2187, ...
Call for Papers - African Journal of Biological Sciences, E-ISSN: 2663-2187, ...Call for Papers - African Journal of Biological Sciences, E-ISSN: 2663-2187, ...
Call for Papers - African Journal of Biological Sciences, E-ISSN: 2663-2187, ...
 

Prediction of uplift capacity using genetic programming

  • 1. Eleventh International Colloquium on ‫للھندسة‬ ‫عشر‬ ‫الحادى‬ ‫الدولى‬ ‫المؤتمر‬ Structural & Geotechnical Engineering ‫الجيوتقنية‬ ‫و‬ ‫االنشائية‬ 17-19 May 2005 17-19‫مايو‬2005 Ain Shams University – Cairo ‫شمس‬ ‫عين‬ ‫جامعة‬-‫القاھرة‬ Prediction of Uplift Capacity For Shallow Foundations Using Genetic Programming Ezzat A. Fattah1 , Hossam E.A. Ali2 , Ahmed M. Ebid3 ABSTRACT In most geotechnical problems, it is too difficult to predict soil and structural behavior accurately, because of the large variation in soil parameters and the assumptions of numerical solutions. But recently many geotechnical problems are solved using Artificial Intelligence (AI) techniques, by presenting new solutions or developing existing ones. Genetic Programming, (GP), is one of the most recently developed (AI) techniques based on Genetic Algorithm (GA) technique. In this research, GP technique is utilized to develop prediction criteria for uplift capacity of shallow foundations using collected historical records. The uplift capacity formula is developed using special software written by the authors in “Visual C++” language. The accuracy of the developed formula was also compared with earlier prediction methods. Keywords: Uplift Capacity, GA, GP, and AI INTRODUCTION Shallow footing ( Pad & Chimney ) is the most common type of uplift foundation. For wide range of soil types, it is the easiest, preferred and most economic type of uplift foundation. There are several methods to design the pad & chimney footing, these methods can be classified into four groups based on the concept of design, these groups are Soil Load Methods, Earth Pressure Methods, Shearing Methods and Constitutive Laws Methods Soil load methods In these methods the soil resistance to foundation extraction is represented by means of the weight of a resisting mass for which it is assumed that it moves together with the foundation due to the action of the pulling force. The shape and magnitude of the resisting soil mass have been determined for calculation by the shape of foundation slab and soil characteristics. The problem of determination of rupture force with this method is reduced to the selection rupture surface shape. This shape is usually given as a function of the type and characteristics of the soil such as shear characteristics, density, consistency,…etc. Earth cone method (1958): This is the most common method which has been adopted for design. In Japan the standard specification for design which was published in 1958 by JEC ( Japanese Electrotechnical Committee ) specified the earth cone method for the calculation of the uplift resistance. In this method the ultimate uplift resistance is assumed to be equal to the sum of the dead weight of the footing and the soil mass contained the truncated pyramid or cone with the bottom of footing slab as base, the rupture surface is considered as straight line inclines with the vertical by certain angle (β). In this method the knowledge of soil mechanics is not taken 1 Prof. of soil mechanics, Ain Shams University, Cairo, Egypt 2 Teacher of soil mechanics, Ain Shams University, Cairo, Egypt 3 Graduate student, Ain Shams University, Cairo, Egypt
  • 2. Eleventh International Colloquium on ‫للھندسة‬ ‫عشر‬ ‫الحادى‬ ‫الدولى‬ ‫المؤتمر‬ Structural & Geotechnical Engineering ‫الجيوتقنية‬ ‫و‬ ‫االنشائية‬ 17-19 May 2005 17-19‫مايو‬2005 Ain Shams University – Cairo ‫شمس‬ ‫عين‬ ‫جامعة‬-‫القاھرة‬ into consideration and therefore the actual important phenomenon of shear failure in earth body is neglected. Earth pressure methods In earth pressure methods it is assumed that the rupture surfaces are vertical , i.e. the soil mass which is pulling together with the foundation has the shape of upright prism or cylinder whose cross section is the same as the foundation slab. The pulling force is determined by the weight of foundation and soil mass and by the friction along its lateral area. Friction forces depend on lateral pressure, so the determination of the intensity of lateral pressure ( for which it is assumed that they vary linearly depending on the depth ) is one of the basic problems. Mors Method (1959): In 1959, Mors suggested that the lateral pressure at the anchor slab level has the value of a passive earth pressure in accordance with the Ranking equilibrium theory. The value of the earth pressure in the region between the ground surface and the anchor slab is varying linearly with the depth. The fundamental defects of the earth pressure methods ( alike the soil load methods ) are that the shear failure in soil mass is not taken into consideration and the effect of cohesion is not considered in the design. Shearing strength methods These Methods were developed on the basis of experimental and theoretical results. According to the concept of these methods the ultimate uplift capacity of the foundation is determined by the weight of foundation and soil mass within the rupture surface and by the shearing force (including the friction and cohesion) along that rupture surface. The shape of the rupture surface is varied from one method to another according to the experimental and theoretical bases of the method. Some methods simply assumed the rupture surface as straight line like Shichiri (1943), and Modified Morse (1959), methods. On the other hand some methods are very complicated such as Matsuo (1968), Method which assume that the rupture surface is a combination of logarithmic spiral curve and straight line. Shichiri Method (1943): In 1943, Shichiri developed a method to estimate the uplift capacity of foundation based on experimental and theoretical results. He suggested a shearing force acting along a vertical rupture surface. This force expressed in terms of soil cohesion, angle of internal friction and coefficient of earth pressure at rest. Sarac method (1961): The method of Sarac is based on a series of pullout tests in different soils and variable depths using a circular anchor plate. Sarac noted that the rupture surface had the shape of convex curve whose tangent at the contact point with the anchor slab was approximately vertical while it crossed the ground surface with an angle of (45-ϕ/2) . He approximated the rupture surface by means of a logarithmic spiral in general form. The ultimate uplift resistance is calculated as the some of the dead weights of the footing and the soil enclosed with the rupture surface and the vertical component of the shear resistance along that surface. Matsuo method (1967,1968): In 1967, Matsuo developed his method assuming that the rupture surface consists of a logarithmic spiral curve and its tangential straight line . He based his assumption on a series of experimental tests on a circular plate anchor model. For practical design, this method is very complicated to be applied, so based on the request of IEEJ ( Institute of Electrical Engineering of Japan ) Matsuo simplified his method in 1968. The estimated loss of accuracy due to this simplification is about 3% of the ultimate uplift capacity. To apply his method on the square foots Matsuo suggested to use the equivalent area concept which means to replace the square footing with circular foot having the same area taking into consideration that the perimeter of the square foot is about 10% greater than the
  • 3. Eleventh International Colloquium on ‫للھندسة‬ ‫عشر‬ ‫الحادى‬ ‫الدولى‬ ‫المؤتمر‬ Structural & Geotechnical Engineering ‫الجيوتقنية‬ ‫و‬ ‫االنشائية‬ 17-19 May 2005 17-19‫مايو‬2005 Ain Shams University – Cairo ‫شمس‬ ‫عين‬ ‫جامعة‬-‫القاھرة‬ perimeter of its equivalent circular foot. So he increases the uplift capacity by 10%. A series of field tests done by Matsuo during a 66 kV transmission power line using a square foots proved that the equivalent area concept is valid to be used with his method. Constitutive laws methods Gopal and Saran method (1987): In 1987, Gopal and Sararn developed an analytical method to predict the Uplift-Displacement characteristic of shallow foundation in (C-ϕ) soil using non-linear constitutive laws. The method based on assumption that the foundation is rigid and having a negligible weight, and buried at shallow depth in homogeneous isotropic medium of semi-infinite extent ( plan strain model ). In this method the Uplift - displacement curve is divided into four stages: Stage (1): (Applied load less than Critical load ) The shear parameters (C,ϕ) are considered fully mobilized at the footing base and have zero value at some level below the ground surface in linear relationship. Stage (2): (Applied load equal to Critical load ) The shear parameters (C,ϕ) are considered fully mobilized at the footing base and have zero value at the ground surface level in linear relationship. Stage (3): (Applied load more than Critical load and less than the pullout load ) The shear parameters (C,ϕ) are considered fully mobilized at the footing base and partially mobilized at ground surface level in linear relationship. Stage (4): (Applied load equal to the pullout load ) The shear parameters (C,ϕ) are considered fully mobilized at the footing base and fully mobilized at ground surface level in linear relationship. The physical meaning of the developed equation is similar to Shichiri method but the Ko (Lateral coefficient at rest) factor is replaced by (1.0). GENETIC ALGORITHM (GA) The Genetic Algorithm (GA) is an Artificial Intelligence (AI) technique, based on simulating the natural reproduction process, following the well-known Darwin's rule "The fittest survive". The natural selection theory for Darwin assumes that, for a certain population, there is always some differences between its members. These differences make some members more suitable for the surrounding conditions than the others. Accordingly, they have better chances to survive and reproduce a next generation with enhanced properties. Generation after generation most of the population will have these suitable properties, meanwhile the unsuitable members will eventually be diminished. In other words, during the reproduction process, the natural selection increases the fitness of the population, which means that this population is developed to suite the surrounding conditions. In the natural reproduction process, certain sequence of (DNA) characters represent properties of members, each character is called "Gene", and every set of genes is called "Chromosome" (Michalewicz, 1992). The theory of biological reproduction process was first simulated mathematically by John Holland, 1975, where genes and chromosomes are replaced by a parameters and solutions respectively, and the surrounding conditions are represented by a fitting function. Hence, according to Darwin's rule, during the reproduction process the population is developed to suite the fitting function (Holland 1975). The most important advantage of GA technique is its generality and its applicability to very wide range of engineering problems. This is because GA technique is not depending on type of data. Encoding the problem parameters in genetic form is the first and the most important step in the GA solution.
  • 4. Eleventh Structura Ain Sh The stan populati fitting f accordin destroye crossov cycle st accurac GENET GP is on to the G concept GP tech First, fi surface minimiz SS International al & Geotechn 17-19 May 20 hams Univers ndard GA p ion of solut function, an ng to there ed. Finally, ver operator tarted again y is accepte TIC PROG ne of the mo GA, which c t of GP is to hnique. In or tness evalu is represen zed for best SE = Σ [ GP Colloquium o nical Engineeri 005 sity – Cairo procedure c tions are ge evaluating e fitness ar producing on the surv n by evaluat ed (Michale GRAMMIN ost recent d can be defin o find the be rder to use G Fig uation metho nted herein t fitting surf P prediction on ing consists of f enerated an of the fitne re arranged new solutio viving solut ting the fitn ewicz 1992) NG (GP) developed kn ned as Mul est fitting su GA, the pre gure 1: Flow od (function by the sum face. The S n - Target ou four main s nd encoded ess of each d and the u ons to keep tions. Mutat ness of the n ). nowledge-b ltivariable I urface in hy evious steps w chart for n to be opt mmation of SE is calcul utput ]2 steps as dep in genetic solution is unsuitable ( p the popula tion operato new solutio base techniq Interpolation yper-space f s will be fol GA procedu timized) ha f squared e lated by ‫للھندسة‬ ‫لقاھرة‬ picted in Fig form. Seco conducted. (least quali ation size co or may be a ns and so o ques and it i n Procedure for a certain lowed, (Ko ure s to be dete errors (SSE (1) ‫عشر‬ ‫الحادى‬ ‫ولى‬ ‫الجيوتقنية‬ ‫و‬ ‫ئية‬ 19‫مايو‬2005 ‫شمس‬ ‫عين‬ ‫ة‬-‫الق‬ g.1. First, a ond, using a Then, the s ified) solut onstant by a applied and on until the is next deve e (MLP). T n given poin za, 1994). ermined. Fi E), which ha ‫الدو‬ ‫المؤتمر‬ ‫االنشائ‬ 17-9 ‫جامعة‬ a random a certain solutions ions are applying then the solution elopment The basic nts using itness of as to be
  • 5. Eleventh Structura Ain Sh Then, c (i.e., de the chro have to 1. Any surfaces 2. Any such as 3. The m a polyno 4. The f has one Therefo using th graphica Using t complex represen As show Operato genes. T genes. T genes. After co operatio to repla (in vari compon On the features were tw (1996), two par operator same op International al & Geotechn 17-19 May 20 hams Univers conducting etermination omosome) t be consider set of poi s with defer complicated (=, +, -, x, / most simple omial equat five basic o input and o ore, to creat he aforeme ally represe the previous xity of the f nting formu wn in Fig. 3 ors part rep The variabl Therefore, t onducting e ons (crossov ace some ran iables part) nents of the e other han s from their wo ways to is called tw rts of the c rs part of o peration wil Colloquium o nical Engineeri 005 sity – Cairo the most n of number to represent red: ints in cert rent accurac d equation /, sin, cos.… e case is to tion. perators hav one output. te a formul entioned fiv ented in Fig s operators, formula, the ulas in a tree Fig 3, each chro resents all les part repr the total nu encoding o ver and mut ndomly sele ). Opposite two parts o nd, the new r parents. o apply the wo-point cro chromosom ne parent w ll be applied on ing important r of genes f t a formula ain domain cy dependin can be con …etc. ). use only th ve two inpu la in geneti ve basic op . 2. , any polyn e more leve e form is sh gure 2: The omosome co the tree ex resent only umber of ge f chromoso tation) have ected genes ely, the cro of the chrom w chromoso That means crossover, ossover. In me independ will be swap d on the var step in G for each ch in genetic f n of hyper ng on the co structed fro he five basic uts and one ic form, a perators (i.e nomial can els of tree a own in Fig. five basic o onsists of tw xcept the lev the level 0 enes on eve ome proced e to be perf s with rando ossover pro mosome mus omes gener s that they the first m this techniq dently. Thu pped with th riables part t GP which i hromosome, form. By do space can mplexity of om certain b c operators output exce binary tree e. =, +, -, be represen are needed t . 3. operators in wo parts; op vel 0 and i 0 of the tree ery chromo dure, the pr formed. Mu om operator ocedure is st not be mi rated durin cannot be method, wh que, crossov us, a certai heir image too as show ‫للھندسة‬ ‫لقاھرة‬ is encoding , and arrang oing so, som be represe f these surfa basic functi (=, +, -, x, ept the oper e structure w x, /). Th nted in a tr to represent GP perators part it consists o e and consi some is ( 2 rocedures to utation is ve r (in operato not that si ixed during ng crossove generated r hich is sugg ver procedu n number from the ot wn in Fig. 4. ‫عشر‬ ‫الحادى‬ ‫ولى‬ ‫الجيوتقنية‬ ‫و‬ ‫ئية‬ 19‫مايو‬2005 ‫شمس‬ ‫عين‬ ‫ة‬-‫الق‬ g of chrom gement of g me importan ented by m aces. ons (operat , /) to const rator (=) wh will be con his tree stru ree form. T t it. An exam t and variab of (2 No. of l ists of (2 No 2 No. of levels o apply the ry simple o ors part) or imple, beca crossover. er must hav randomly. gested by R ure is applie of genes f ther parent, ‫الدو‬ ‫المؤتمر‬ ‫االنشائ‬ 17-9 ‫جامعة‬ mosomes genes on nt points many tors) truct hich nstructed ucture is he more mple for bles part. levels - 1) o. of levels ) + 1 - 1) e genetic operation variable ause the ve some So there Riccardo ed on the from the , and the
  • 6. Eleventh Structura Ain Sh The sec generati survivin selected so do th International al & Geotechn 17-19 May 20 hams Univers Figu cond way to ion of chro ng chromos d randomly he next gene Colloquium o nical Engineeri 005 sity – Cairo ure 3: Math Fi o apply cro omosomes i somes. In from the fir es. This proc on ing ematical an gure 4: Two ossover was s generated other word rst genes of cess is depi nd genetic re o-point cros s proposed d by random ds, the firs f the whole icted in Fig. epresentatio ssover meth by the auth mly selectin t gene of t surviving s . 5 for three ‫للھندسة‬ ‫لقاھرة‬ on of binary hod hors. In thi ng each gen the new ch et of parent parents and ‫عشر‬ ‫الحادى‬ ‫ولى‬ ‫الجيوتقنية‬ ‫و‬ ‫ئية‬ 19‫مايو‬2005 ‫شمس‬ ‫عين‬ ‫ة‬-‫الق‬ y tree is technique ne from the hromosome t chromosom d one child. ‫الدو‬ ‫المؤتمر‬ ‫االنشائ‬ 17-9 ‫جامعة‬ e, a new e similar will be mes, and .
  • 7. Eleventh Structura Ain Sh In rando can be c be half chosen Practica from th minima convers After th generati SSE). A minimu surface accurac 1996). PREDI AI techn with no using G generate used to The gen power foundat includes includes (C), tan The eva diamete constan bulk cas International al & Geotechn 17-19 May 20 hams Univers om selection chosen. On f of the pop in this res ally, the fas he populatio a. On other sion will be he previou ion. Genera After a cert um SSE). A for this nu y of this su ICTION OF niques had oisy and ina GP techniqu e the formu evaluate the nerating da transmissio tion depths s (C-s s footing w ngent of inte aluation data er of the fo nt and equal se. Colloquium o nical Engineeri 005 sity – Cairo Figure n crossover the other h pulation. Fo search to c stest conver on. For less r hand, if th very slow. s three ste ation after g tain number At this stag umber of tr urface is no F UPLIFT been wildly accurate dat e, the result ulas, where a e generated ata set cons on line, fou are ranged oil, ϕ-soil, idth (B) and ernal friction a set consis ooting is ran to (1.00m) on ing e 5: Random r technique and, in two or this reas carry out th rsion occur s number o he number o eps, GA ca generation, r of genera ge, the corr ree levels (w t enough, l CAPACIT y used in ge ta. In order ts of (31) p another set d formulas. sists of (31 undation di between ( C-ϕ soil) i d depth (D) n angle (tan sts of (4) pu nged betwe ). All the se m selection number of -point cross son, the ran he crossove rs when the of survivors of survivors an be appl the fitness ations the fi responding which mean arger numb TY USING eotechnical to predict pullout tests of (4) pullo ) pullout fi imensions 1.05 to 1.80 in both bulk ) beside thre n(ϕ)) and eff ullout labora een (0.40 to ets had been crossover m survivors fr sover techn ndom selec er operation e number o s the soluti s is more th lied on the will increas itness will chromosom ns for this ber of tree l (GP) field recent the uplift c s carried out out tests car ield tests o are ranged 0m). The s k and subm ee soil para ffective unit atory tests o o 1.00m), w n carried ou ‫للھندسة‬ ‫لقاھرة‬ method from one ge ique numbe ction crosso n in the d of survivors on may be han 50% of e first and se (which m settle at a mes represe degree of levels must tly because capacity of t by (Matsu rried out by n square fo d between oil conditio merged case ameters whi weight of s on axi-symm where the f ut using the ‫عشر‬ ‫الحادى‬ ‫ولى‬ ‫الجيوتقنية‬ ‫و‬ ‫ئية‬ 19‫مايو‬2005 ‫شمس‬ ‫عين‬ ‫ة‬-‫الق‬ neration to er of survivo over techniq developed s s equals to trapped in f the popula randomly means a dec certain valu ent the mos complexity be used (R of its abilit shallow fou uo, 1967) is (Sarac, 197 ootings of (1.20 to 2 on of these s. Each dat ich are the c soil (γ). metric footin foundation e same (C-ϕ ‫الدو‬ ‫المؤتمر‬ ‫االنشائ‬ 17-9 ‫جامعة‬ the next ors must que was software. 30-40% n a local ation, the created crease in ue (with st fitting y). If the Riccardo, ty to dial undation s used to 75) were 66 K.V. 2.00m ), data set ta record cohesion ngs. The depth is ϕ soil) in
  • 8. Eleventh International Colloquium on ‫للھندسة‬ ‫عشر‬ ‫الحادى‬ ‫الدولى‬ ‫المؤتمر‬ Structural & Geotechnical Engineering ‫الجيوتقنية‬ ‫و‬ ‫االنشائية‬ 17-19 May 2005 17-19‫مايو‬2005 Ain Shams University – Cairo ‫شمس‬ ‫عين‬ ‫جامعة‬-‫القاھرة‬ In order to compare predicted and experimental capacities, the concept of equivalent area was used to find the pullout load of the equivalent square footing with a width equal to the diameter of the axi-symmetric footing. During adapted research program to predict the uplift capacity of shallow foundation using GP technique, the research program had been conducted using the last version of GP software. The complexity of the generating formulas increases gradually from three levels in the first trial and up to six levels in the last trail. Each trail had been conducted until the solution error settled at it's minimum value (which corresponding to the maximum accuracy ) or until the solution exceeded the practical limits (when the solution takes too much time). The first three trails had been conducted using only five variables ( B, D, C, tan(ϕ), γ) which are footing width in meters, footing depth in meters, soil cohesion in tons per square meters , tangent of internal friction angle of soil and effective unit weight of soil in tons per cubic meters respectively. Where the last two trails had been conducted using additional five variables with constant values which are (1, 2, 3, 5, 11). A summary of the research program and its results are shown in table (1). The generated formula of each trail is represented in two charts, the first chart represent the relationship between predicted and experimental capacities for both generating and evaluation data sets, where the second chart shows the effect of shallowness ratio (B/D) and type of soil on the accuracy of prediction. The average relative error could be calculated from the following formula: Average Relative Error % = P P P n caln − ×∑ exp exp1 100 ....... (1) Accuracy % = 100- Average Relative Error % ....... (2) Where Pcal , Pexp are the predicted and the experimental uplift capacities respectively. The soil type is represented by the ratio between cohesion and friction shear strength ( C / γ.D.tan(ϕ)), for pure (ϕ-soil) this ratio is equal to zero and for pure (C-soil) the ratio yields to infinity. Trial No. (1): Starting with a simple trail which has only three levels using generating data set consists of five variables ( B, D, C, tan(ϕ), γ) produced formula (3) which corresponding to SSE (Summation of Square Error) equals to (634). Applying this formula on the evaluation data set produced SSE equals to (14). The corresponding accuracy of the formula in case of generating, evaluation and total data sets are (82.30%) (75.78%) and (81.70%) respectively. P B C D B D= + + +2 .( ).( .tan( ))γ ϕ ......(3) The graphical representation of predicated capacities of both generating and evaluation data sets are shown in fig.(6), the graph shows that the slope of the best fitting line is (0.9858 ≈ 1.00) and the coefficient of determination (R2 =0.8198) which indicate the good correlation between the predicted and experimental capacities. Where the upper chart in fig. (7) shows that the footing shallowness (B/D) has no significant effect on the prediction accuracy, on the other hand, the lower chart indicates that the percentage of error in the (ϕ-soil) (up to 40%) is higher than in (c-soil) (about 20%).
  • 9. Eleventh International Colloquium on ‫للھندسة‬ ‫عشر‬ ‫الحادى‬ ‫الدولى‬ ‫المؤتمر‬ Structural & Geotechnical Engineering ‫الجيوتقنية‬ ‫و‬ ‫االنشائية‬ 17-19 May 2005 17-19‫مايو‬2005 Ain Shams University – Cairo ‫شمس‬ ‫عين‬ ‫جامعة‬-‫القاھرة‬ Trial No. (2): Continuing the research program with the second trail which has four levels using generating data set consists of five variables ( B, D, C, tan(ϕ), γ) produced formula (4) which corresponding to SSE (Summation of Square Error) equals to (501). Applying this formula on the evaluation data set produced SSE equals to (26). The corresponding accuracy of the formula in case of generating, evaluation and total data sets are (84.26%) (67.00%) and (83.50%) respectively. P e C B C D eB D e = + − + ++( ) tan( ) ( ) .( tan( )).2 γ ϕ ϕ ......(4) The graphical representation of predicated capacities of both generating and evaluation data sets are shown in fig.(8), the graph shows that the slope of the best fitting line is (0.9896 ≈ 1.00) and the coefficient of determination (R2 =0.8659) which indicate the good correlation between the predicted and experimental capacities. Where the upper chart in fig. (9) shows that the footing shallowness (B/D) has no significant effect on the prediction accuracy, on the other hand, the lower chart indicates that the percentage of error in the (ϕ-soil) (up to 60%) is higher than in (c-soil) (about 10%). Trial No. (3): The conducting of the third trail which has five levels using generating data set consists of five variables ( B, D, C, tan(ϕ), γ) generates formula (5) which corresponding to SSE (Summation of Square Error) equals to (238). Applying this formula on the evaluation data set produced SSE equals to (37). The corresponding accuracy of the formula in case of generating, evaluation and total data sets are (89.16%) (60.57%) and (88.08%) respectively. P e D C B C B B Ln B B C Ln B D C B D = + + + − + −+( ) . . . . .tan( ).( ) ( .tan( )) .( ( ) ) ( ) 2 2 2 2 γ ϕ ϕ γ .... (5) The graphical representation of predicated capacities of both generating and evaluation data sets are shown in fig.(10), the graph shows that the slope of the best fitting line is (1.0045 ≈ 1.00) and the coefficient of determination (R2 =0.9415) which indicate the very good correlation between the predicted and experimental capacities. Where the upper chart in fig.(11) shows that the prediction accuracy of deep footings is worst than shallow ones , on the other hand, the lower chart indicates that the percentage of error in the (ϕ-soil) (up to 30%) is higher than in (c-soil) (about 10%). Trial No. (4): The forth trail five levels just like the third one but using generating data set consists of ten variables ( B, D, C, tan(ϕ), γ,1,2,3,5,11). Conducting of this trial produced formula (6) which corresponding to SSE (Summation of Square Error) equals to (226). Applying this formula on the evaluation data set produced SSE equals to (35). The corresponding accuracy of the formula in case of generating, evaluation and total data sets are (89.44%) (61.57%) and (88.38%) respectively. P e D C B C B B B D C Ln B D C B D = + + + − − −+( ) . . . . .tan( ).( ) ( .tan( )) .( ) ( ) 2 2 2 2 2 γ ϕ ϕ γ ........ (6) The graphical representation of predicated capacities of both generating and evaluation data sets are shown in fig.(12), the graph shows that the slope of the best fitting line is (1.0033 ≈ 1.00) and the coefficient of determination (R2 =0.9445) which indicate the very good correlation between the predicted and experimental capacities. Where the upper chart in fig. (13) shows that the prediction accuracy of deep footings is worst than shallow ones , on the other hand, the lower chart indicates that the percentage of error in the (ϕ-soil) (up to 25%) is higher than in (c-soil) (about 10%).
  • 10. Eleventh Structura Ain Sh International al & Geotechn 17-19 May 20 hams Univers Colloquium o nical Engineeri 005 sity – Cairo on ing ‫للھندسة‬ ‫لقاھرة‬ ‫عشر‬ ‫الحادى‬ ‫ولى‬ ‫الجيوتقنية‬ ‫و‬ ‫ئية‬ 19‫مايو‬2005 ‫شمس‬ ‫عين‬ ‫ة‬-‫الق‬ ‫الدو‬ ‫المؤتمر‬ ‫االنشائ‬ 17-9 ‫جامعة‬
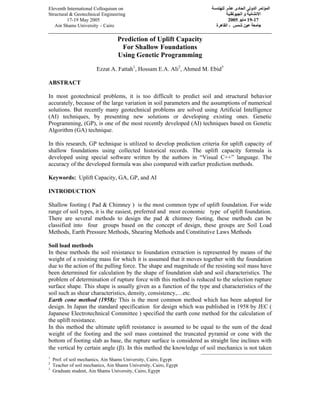
  • 11. Eleventh International Colloquium on ‫للھندسة‬ ‫عشر‬ ‫الحادى‬ ‫الدولى‬ ‫المؤتمر‬ Structural & Geotechnical Engineering ‫الجيوتقنية‬ ‫و‬ ‫االنشائية‬ 17-19 May 2005 17-19‫مايو‬2005 Ain Shams University – Cairo ‫شمس‬ ‫عين‬ ‫جامعة‬-‫القاھرة‬ Trial No. (5): The last trial in the research program has six levels using generating data set consists of ten variables ( B, D, C, tan(ϕ), γ,1,2,3,5,11). Conducting of this trial generated formula (7) which corresponding to SSE (Summation of Square Error) equals to (184). Applying this formula on the evaluation data set produced SSE equals to (4). The corresponding accuracy of the formula in case of generating, evaluation and total data sets are (90.46%) (87.24%) and (90.15%) respectively. P B D C B D D C D D B B D = + + + + + + + + − +( . tan( )).( . ) ( ) ( ) ϕ γ γ 2 2 3 2 3 11 − − + + + + − ⎛ ⎝ ⎜ ⎞ ⎠ ⎟2 2 2 2 γ γ ϕ γ ϕ γ ϕ γ γ B B C B C .( tan( )) . . . .tan( ). ( ).tan( ) .... (7) The graphical representation of predicated capacities of both generating and evaluation data sets are shown in fig.(14), the graph shows that the slope of the best fitting line is (0.997 ≈ 1.00) and the coefficient of determination (R2 =0.9502) which indicate an excellent correlation between the predicted and experimental capacities. Where the upper chart in fig. (15) shows that the footing shallowness (B/D) has no significant effect on the prediction accuracy, on the other hand, the lower chart indicates that the percentage of error in the (ϕ- soil) (up to 30%) is higher than in (c-soil) (about 5%). Figure 10: Representation of the generated formula - trial no. (3) Figure 11: Effect of B/D and type of soil on the prediction accuracy For trail no. (3) y = 1.0045x R2 = 0.9415 0 10 20 30 40 50 60 0 10 20 30 40 50 60 Experimental capacity (ton) Ppredictedcapacity(ton) Generating set Validation set Best Fitting 0 20 40 60 80 0 2 4 6 8 10 12 14 16 C / D.γ .tan(φ ) Error% Generating set Validation set 0 20 40 60 80 0.00 0.50 1.00 1.50 2.00 B/D Error% Generating set Validation set
  • 12. Eleventh Structura Ain Sh International al & Geotechn 17-19 May 20 hams Univers Colloquium o nical Engineeri 005 sity – Cairo on ing ‫للھندسة‬ ‫لقاھرة‬ ‫عشر‬ ‫الحادى‬ ‫ولى‬ ‫الجيوتقنية‬ ‫و‬ ‫ئية‬ 19‫مايو‬2005 ‫شمس‬ ‫عين‬ ‫ة‬-‫الق‬ ‫الدو‬ ‫المؤتمر‬ ‫االنشائ‬ 17-9 ‫جامعة‬
  • 13. Eleventh International Colloquium on ‫للھندسة‬ ‫عشر‬ ‫الحادى‬ ‫الدولى‬ ‫المؤتمر‬ Structural & Geotechnical Engineering ‫الجيوتقنية‬ ‫و‬ ‫االنشائية‬ 17-19 May 2005 17-19‫مايو‬2005 Ain Shams University – Cairo ‫شمس‬ ‫عين‬ ‫جامعة‬-‫القاھرة‬ SUMMARY OF RESULTS The results of the research program are summarized in table (1), which shows each trail with its the number of levels and input variables, in addition to its accuracy percentage and (SSE) value in case of generating, validation and total data sets. From the summary table, it could be noted that: a ) For the same data set the accuracy of the generated formula increases with its complexity ( no. of levels ). b ) Using constants in the data sets saves the extra levels that will be used to create these constants, hence they make the conversion faster. c ) For second, third and forth trials, it is noticed that the accuracy of the validation data set is significantly lower than that of the generating data set, that means that these trials produced good estimations in case of generating data set and poor estimations in case of the validation data set. In other words, these three trails generated a "Memorized" formulas not "Generalized" formulas. d ) In spite of the simplicity of first trail formula, it produced a good estimations in both cases, and due to its simplicity, it could be used in preliminary designs or rough manual checking. e ) The formula generated during the last trial is accurate enough to be applied in design, the results indicates its validity in both generating and validation data sets, hens, its generality and ability to be applied in the mentioned ranges of variables. COMPARISON WITH EARLIER PREDICTION METHODS In order to compare the generated formulas with earlier prediction methods, the capacities of both generating and validation data sets arfe calculated using six well known methods which are (Earth cone 1958), (Morse 1959), (Shichiri 1943), (Gopal 1987), (Sarac 1961) and (Matsuo 1967). Figures from (3-23) to (3-27) represent the relationship between predicted and experimental capacities for both generating and evaluation data sets for each method of these six methods. For (Matsuo 1967) method, the chart in Fig.(16) shows that the slope of the best fitting line is (0.8982) and the coefficient of determination (R2 =0.778) which indicate a good correlation and also means that the predicted capacities is about 90% the experimental ones. Where Fig.(17) which represents (Sarac 1961) method and Fig.(18) which represents (Shichiri 1943) method, indicate a fair correlation and also show that the predicted capacities is about 60-66% the experimental ones. For (Sarac 1961) the slope of the best fitting line is (0.6566) and the coefficient of determination (R2 =0.7388) and for (Shichiri 1943) the slope of the best fitting line is (0.6134) and the coefficient of determination (R2 =0.7402). For (Gopal 1987) method, the chart in Fig.(19) shows that the slope of the best fitting line is (0.9863) and the coefficient of determination (R2 =0.3306) which indicate a poor correlation and also means that the predicted capacities is almost the same as the experimental ones. Where Fig.(20) which represents (Morse 1959) method and Fig.(21) which represents (Earth cone 1958) method, indicate no correlation and also show a poor relationship between predicted and experimental capacities.
  • 14. Eleventh Structura Ain Sh International al & Geotechn 17-19 May 20 hams Univers Colloquium o nical Engineeri 005 sity – Cairo on ing ‫للھندسة‬ ‫لقاھرة‬ ‫عشر‬ ‫الحادى‬ ‫ولى‬ ‫الجيوتقنية‬ ‫و‬ ‫ئية‬ 19‫مايو‬2005 ‫شمس‬ ‫عين‬ ‫ة‬-‫الق‬ ‫الدو‬ ‫المؤتمر‬ ‫االنشائ‬ 17-9 ‫جامعة‬
  • 15. Eleventh Structura Ain Sh International al & Geotechn 17-19 May 20 hams Univers Colloquium o nical Engineeri 005 sity – Cairo on ing ‫للھندسة‬ ‫لقاھرة‬ ‫عشر‬ ‫الحادى‬ ‫ولى‬ ‫الجيوتقنية‬ ‫و‬ ‫ئية‬ 19‫مايو‬2005 ‫شمس‬ ‫عين‬ ‫ة‬-‫الق‬ ‫الدو‬ ‫المؤتمر‬ ‫االنشائ‬ 17-9 ‫جامعة‬
  • 16. Eleventh International Colloquium on ‫للھندسة‬ ‫عشر‬ ‫الحادى‬ ‫الدولى‬ ‫المؤتمر‬ Structural & Geotechnical Engineering ‫الجيوتقنية‬ ‫و‬ ‫االنشائية‬ 17-19 May 2005 17-19‫مايو‬2005 Ain Shams University – Cairo ‫شمس‬ ‫عين‬ ‫جامعة‬-‫القاھرة‬ Figure 20: Representation of Morse formula - 1959 Figure 21: Representation of Earth cone formula - 1958 The results of the comparison are summarized in table (2), which shows the method with its input variables in addition to its accuracy percentage and (SSE) value in case of generating, validation and total data sets. From the summary table, it could be noted that: a ) Earth cone and Morse methods have poor accuracy due to the neglecting the soil cohesion. where the other earlier predicting methods shows a fair to good accuracy according to their complexity. b ) In spite of the simplicity of trail (1) formula, it shows an accuracy better than the complicated earlier predicting methods. c ) The best predicting method is trail (5) formula, which shows an excellent accuracy ( about 90%). y = 0.6377x R2 = -0.677 0 10 20 30 40 50 60 0 10 20 30 40 50 60 Experimental capacity (ton) Ppredictedcapacity(ton) Generating set Validation set Best Fitting y = 0.2812x R2 = -0.9362 0 10 20 30 40 50 60 0 10 20 30 40 50 60 Experimental capacity (ton) Ppredictedcapacity(ton) Generating set Validation set Best Fitting
  • 17. Eleventh Structura Ain Sh International al & Geotechn 17-19 May 20 hams Univers Colloquium o nical Engineeri 005 sity – Cairo on ing ‫للھندسة‬ ‫لقاھرة‬ ‫عشر‬ ‫الحادى‬ ‫ولى‬ ‫الجيوتقنية‬ ‫و‬ ‫ئية‬ 19‫مايو‬2005 ‫شمس‬ ‫عين‬ ‫ة‬-‫الق‬ ‫الدو‬ ‫المؤتمر‬ ‫االنشائ‬ 17-9 ‫جامعة‬
  • 18. Eleventh International Colloquium on ‫للھندسة‬ ‫عشر‬ ‫الحادى‬ ‫الدولى‬ ‫المؤتمر‬ Structural & Geotechnical Engineering ‫الجيوتقنية‬ ‫و‬ ‫االنشائية‬ 17-19 May 2005 17-19‫مايو‬2005 Ain Shams University – Cairo ‫شمس‬ ‫عين‬ ‫جامعة‬-‫القاھرة‬ REFERENCES 1 Ayman Lotfy, (1992). “Uplift Resistance of Shallow Foundation”, M.S. Ain Shams University. 2 Dzevad Sarac, (1975). “Bearing Capacity of Anchor Foundation as Loaded by Vertical Force”, institute of geotechnics and Foundation engineering, Sarajevo. 3 Egyptian Ministry of Electricity and Energy, (1981). “Design Standard of Transmission Steel towers”, Chapters 2, 12. 4 Holland, J. (1975). "Adaptation in Natural and Artificial Systems," Ann Arbor, MI, University of Michigan Press. 5 Institute of Electrical Engineering of Japan, (1958). “Design Standard of Transmission Steel towers”, JEC.127, pp. 35.39 6 Koza, J. R., (1994). "Genetic Programming-2," MIT Press, Cambridge, MA. 7 Matsuo M., (1967). “Study on the Uplift Resistance of Footing I”, Soils and Foundations, Vol. 7, No. 4, pp. 1.37. 8 Matsuo M., (1968). “Study on the Uplift Resistance of Footing II” , Soils and Foundations, Vol. 8, No. 1, pp. 18.48. 9 Michalewicz, Z. (1992)."Genetic Algorithms+Data Structure = Evaluation Programs", Springer-Verlag Berlin Heidelberg, New York. 10 Riccardo, P. (1996). "Introduction To Evolutionary Computation," Collection of Lectures, School of Computer Science, University of Birmingham, UK. 11 Saran S. and Rajan G. (1987). “Soil Anchors and Constitutive Lows “, Journal of Geotechnical Engineering Division, ASCE, Vol. 112, GT(12), pp. 1084.1099