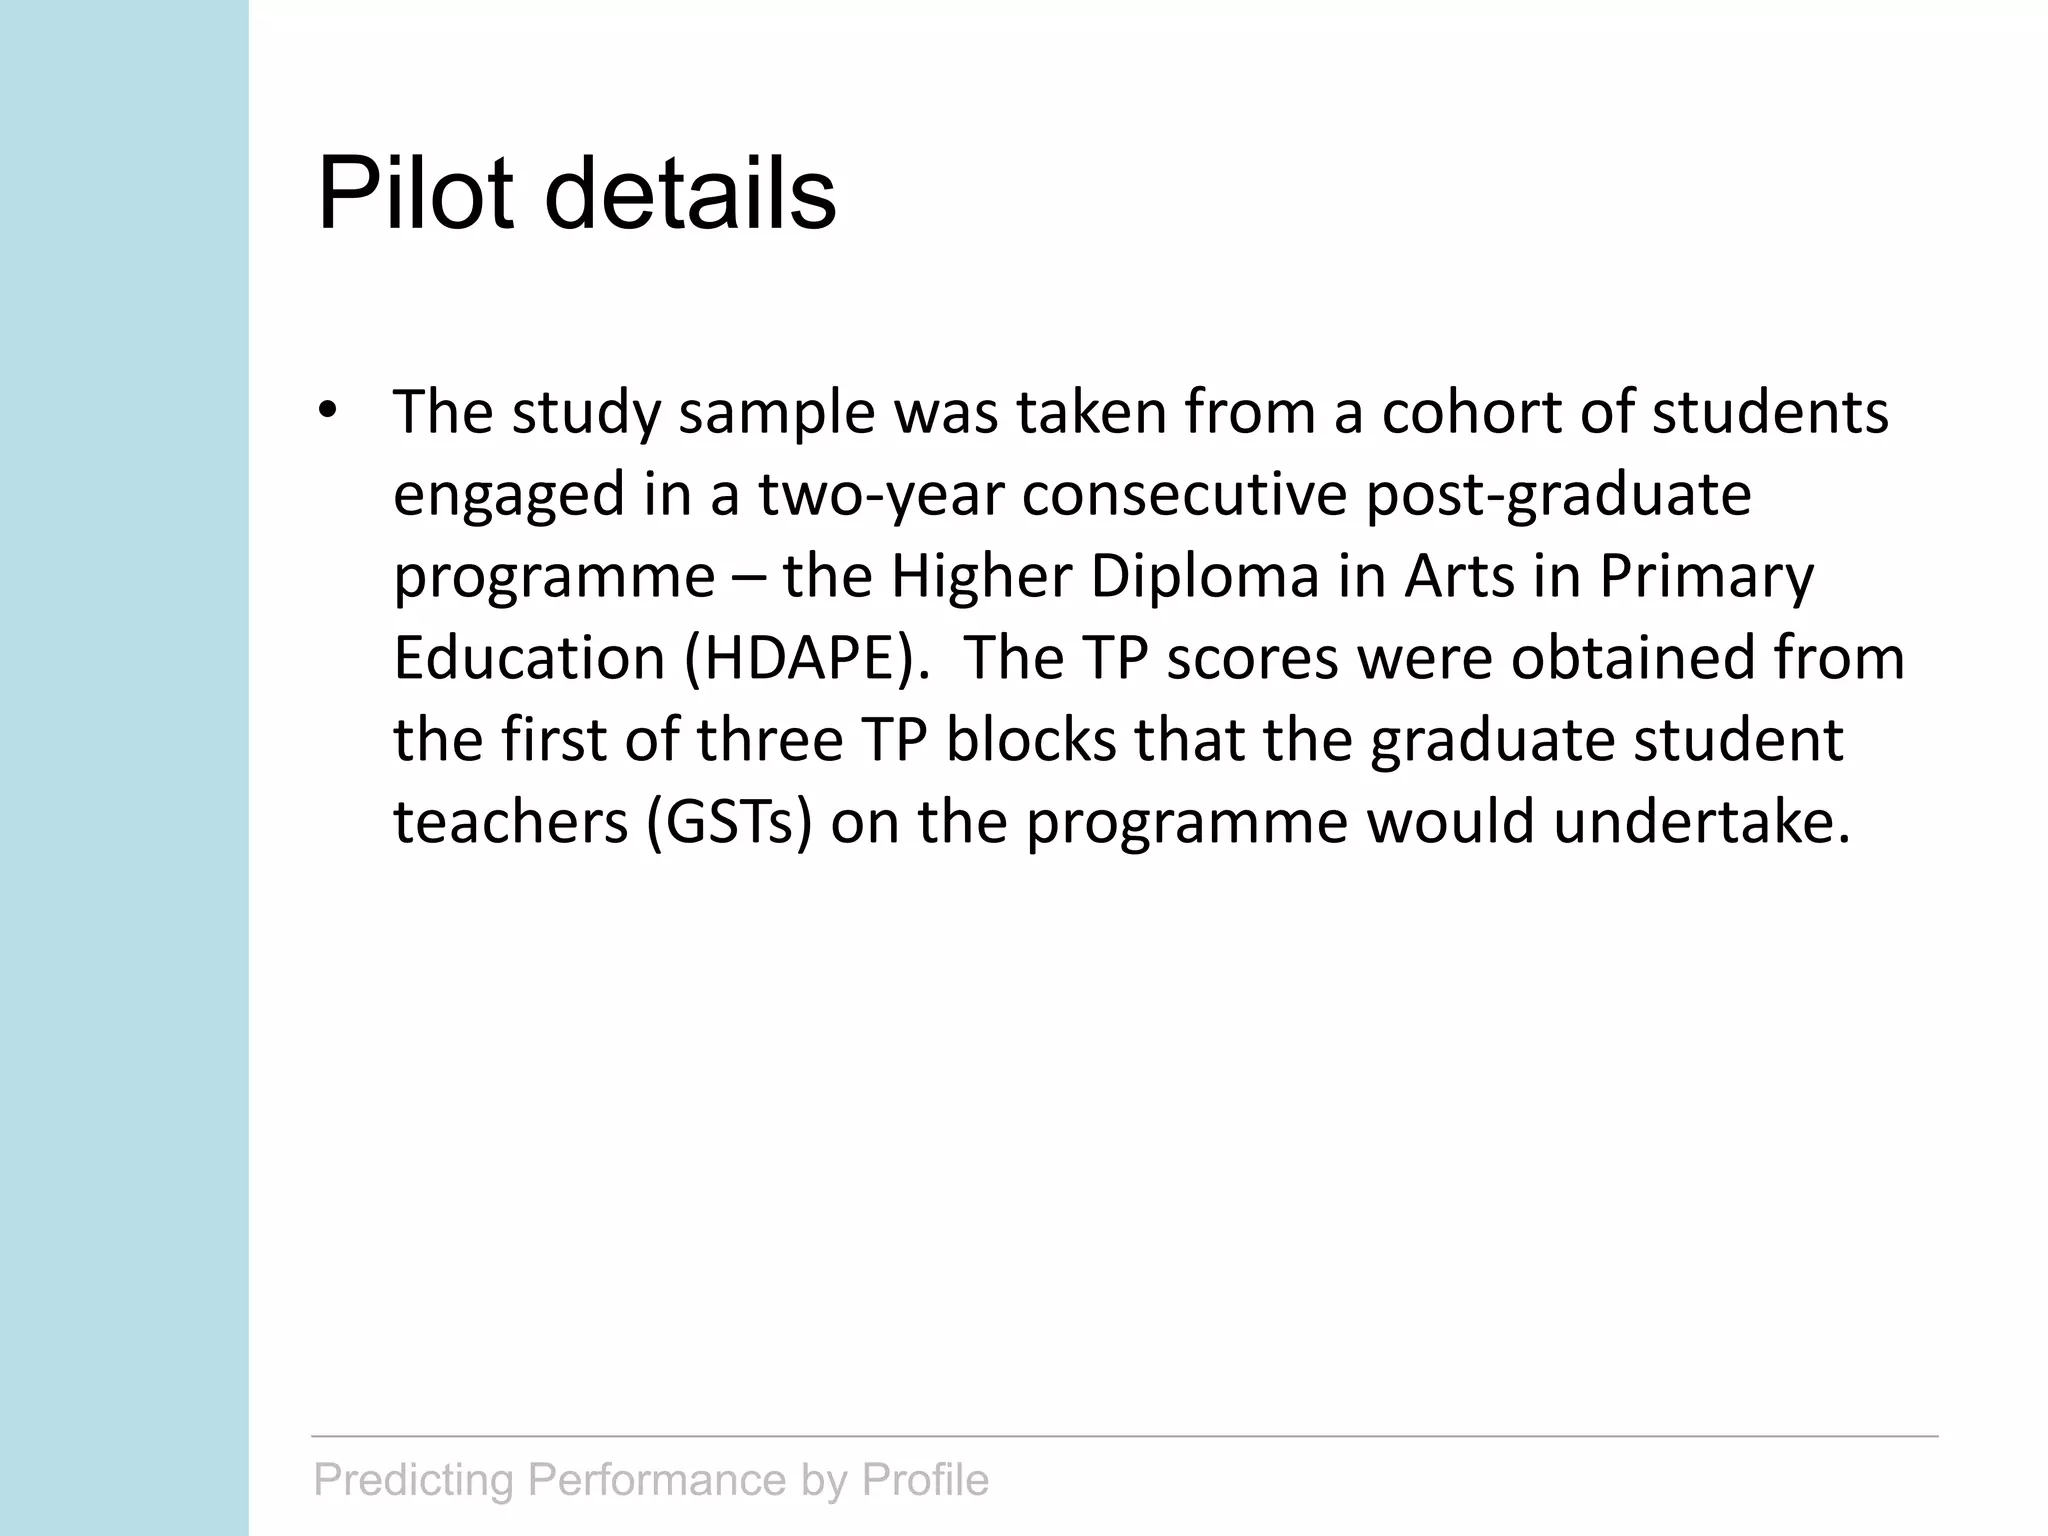
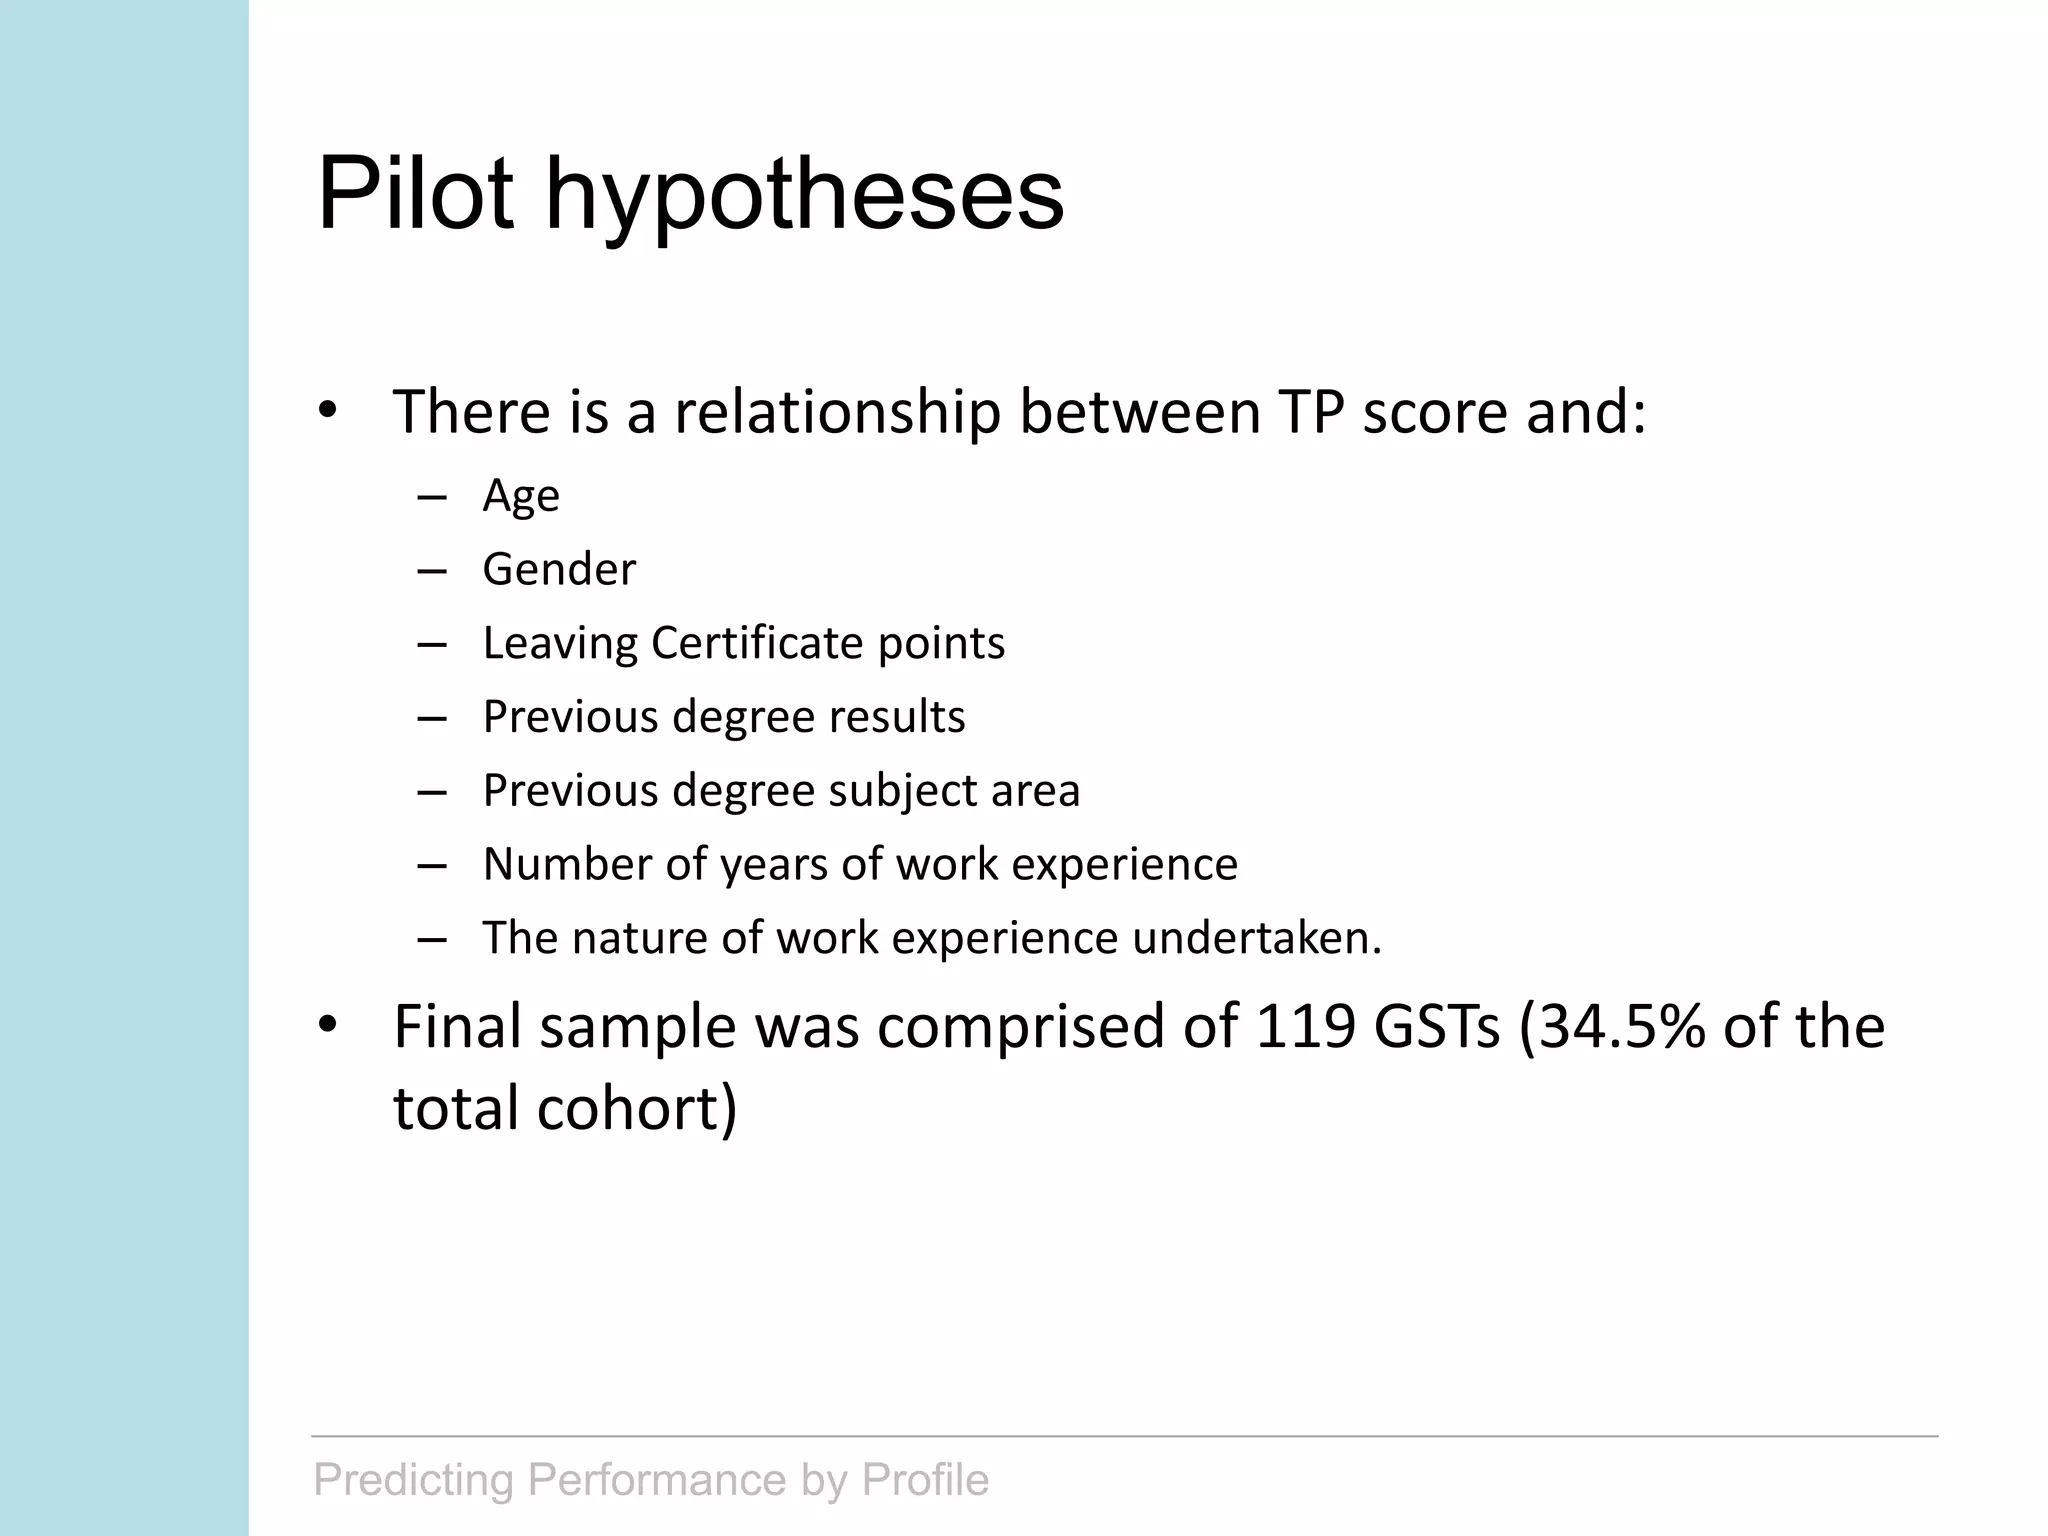
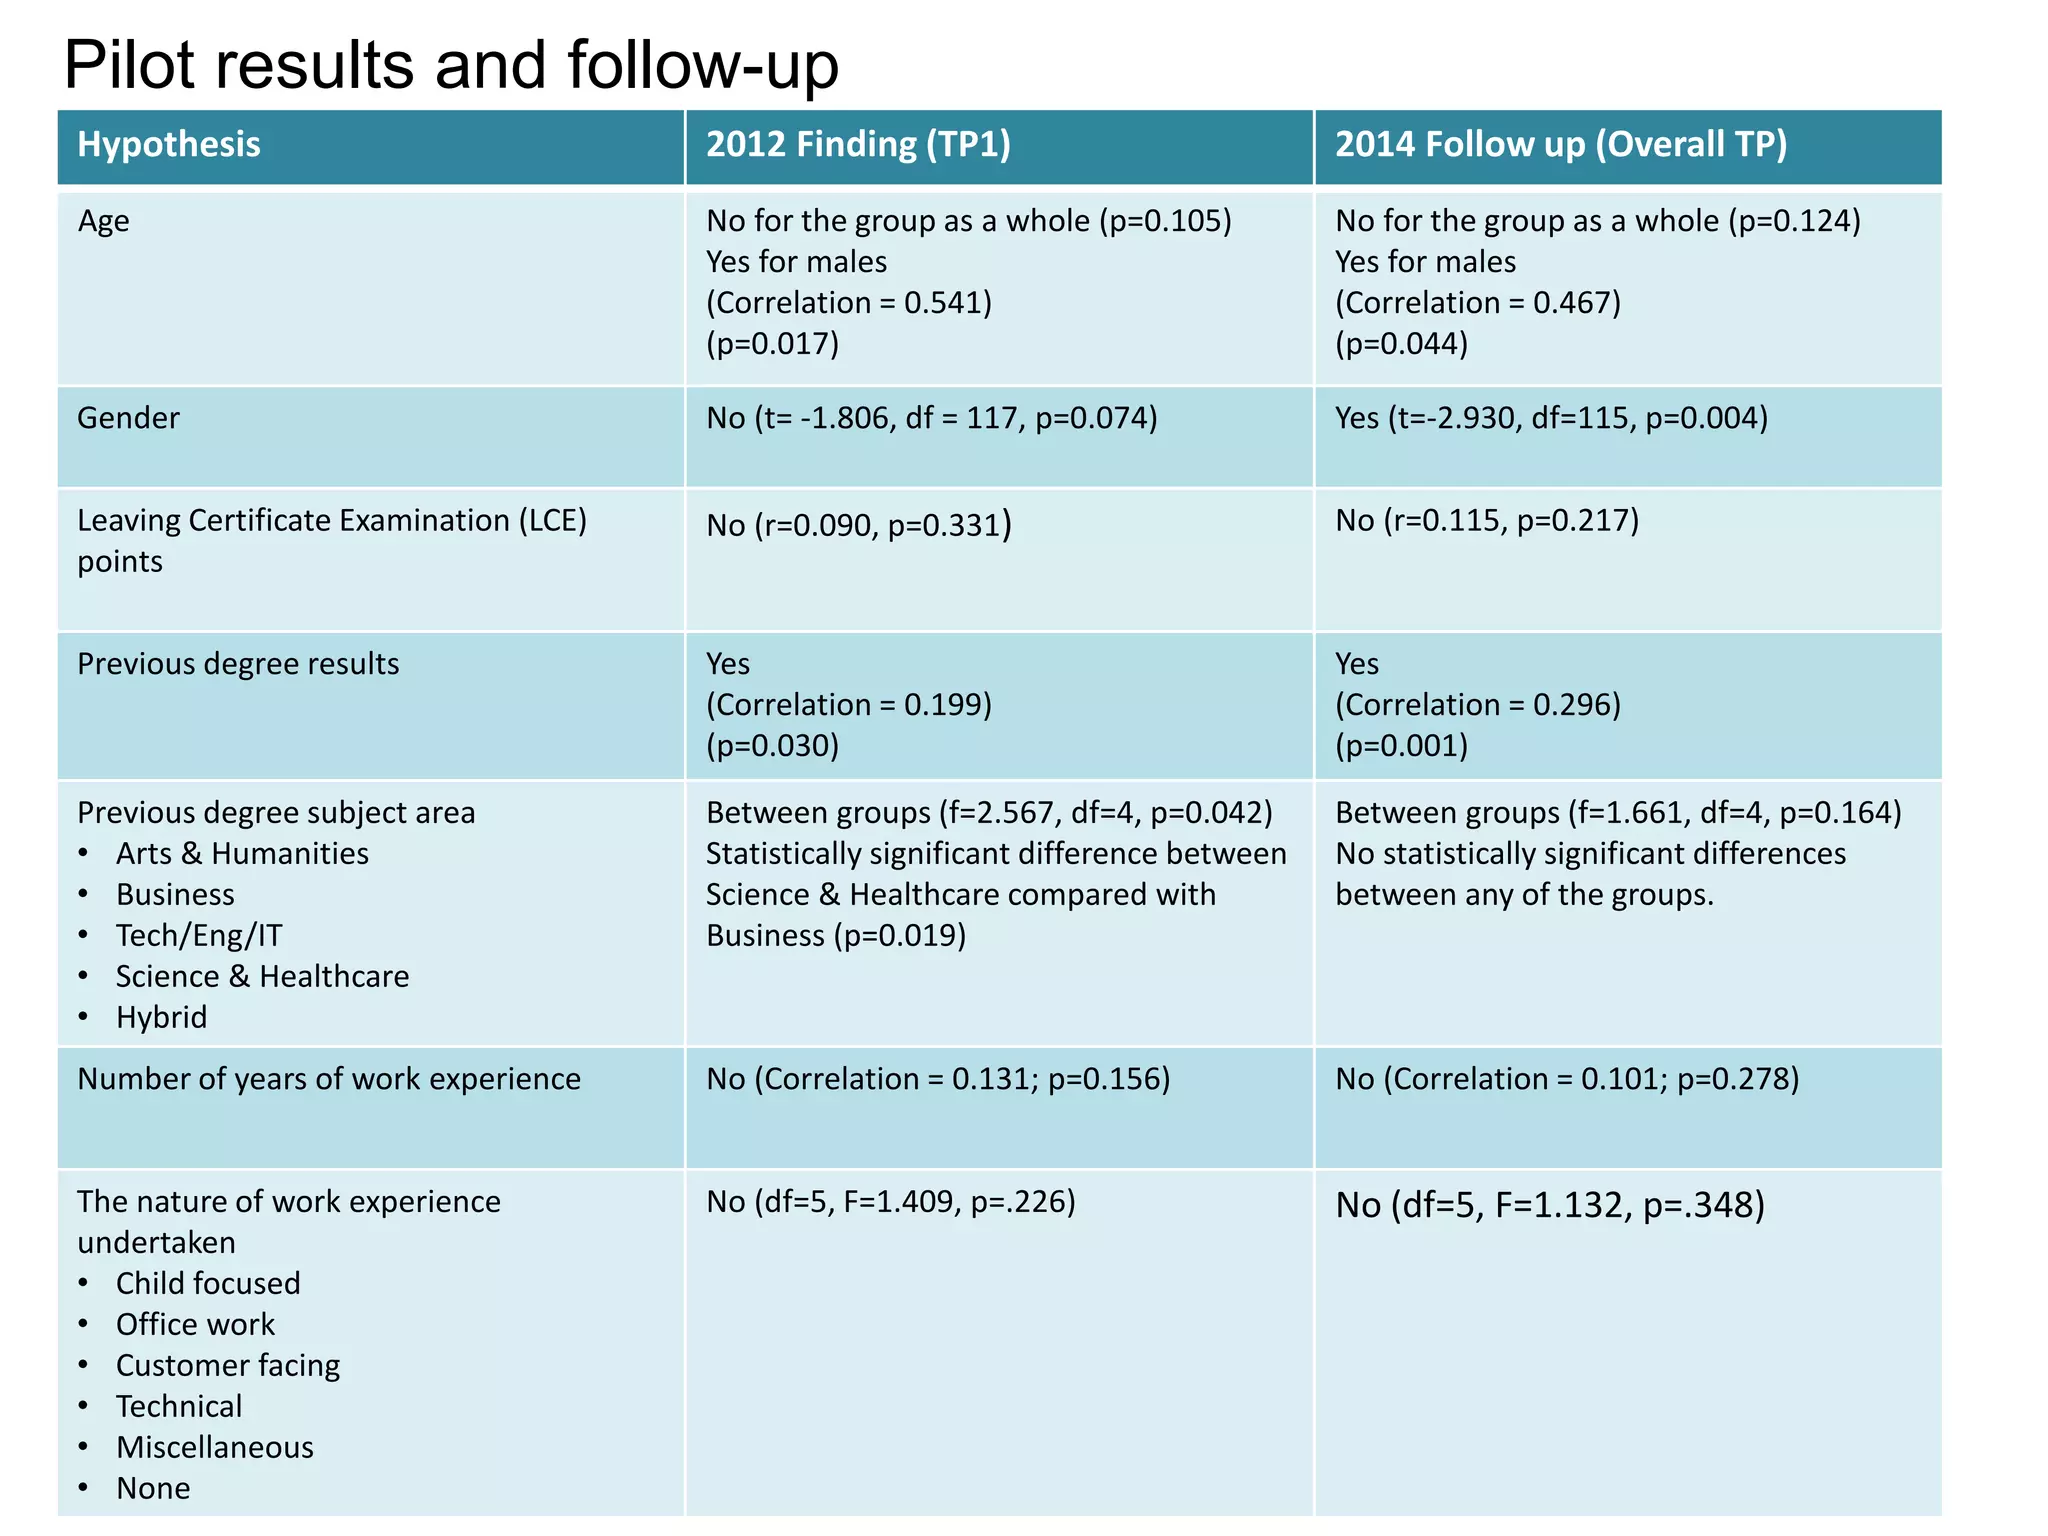
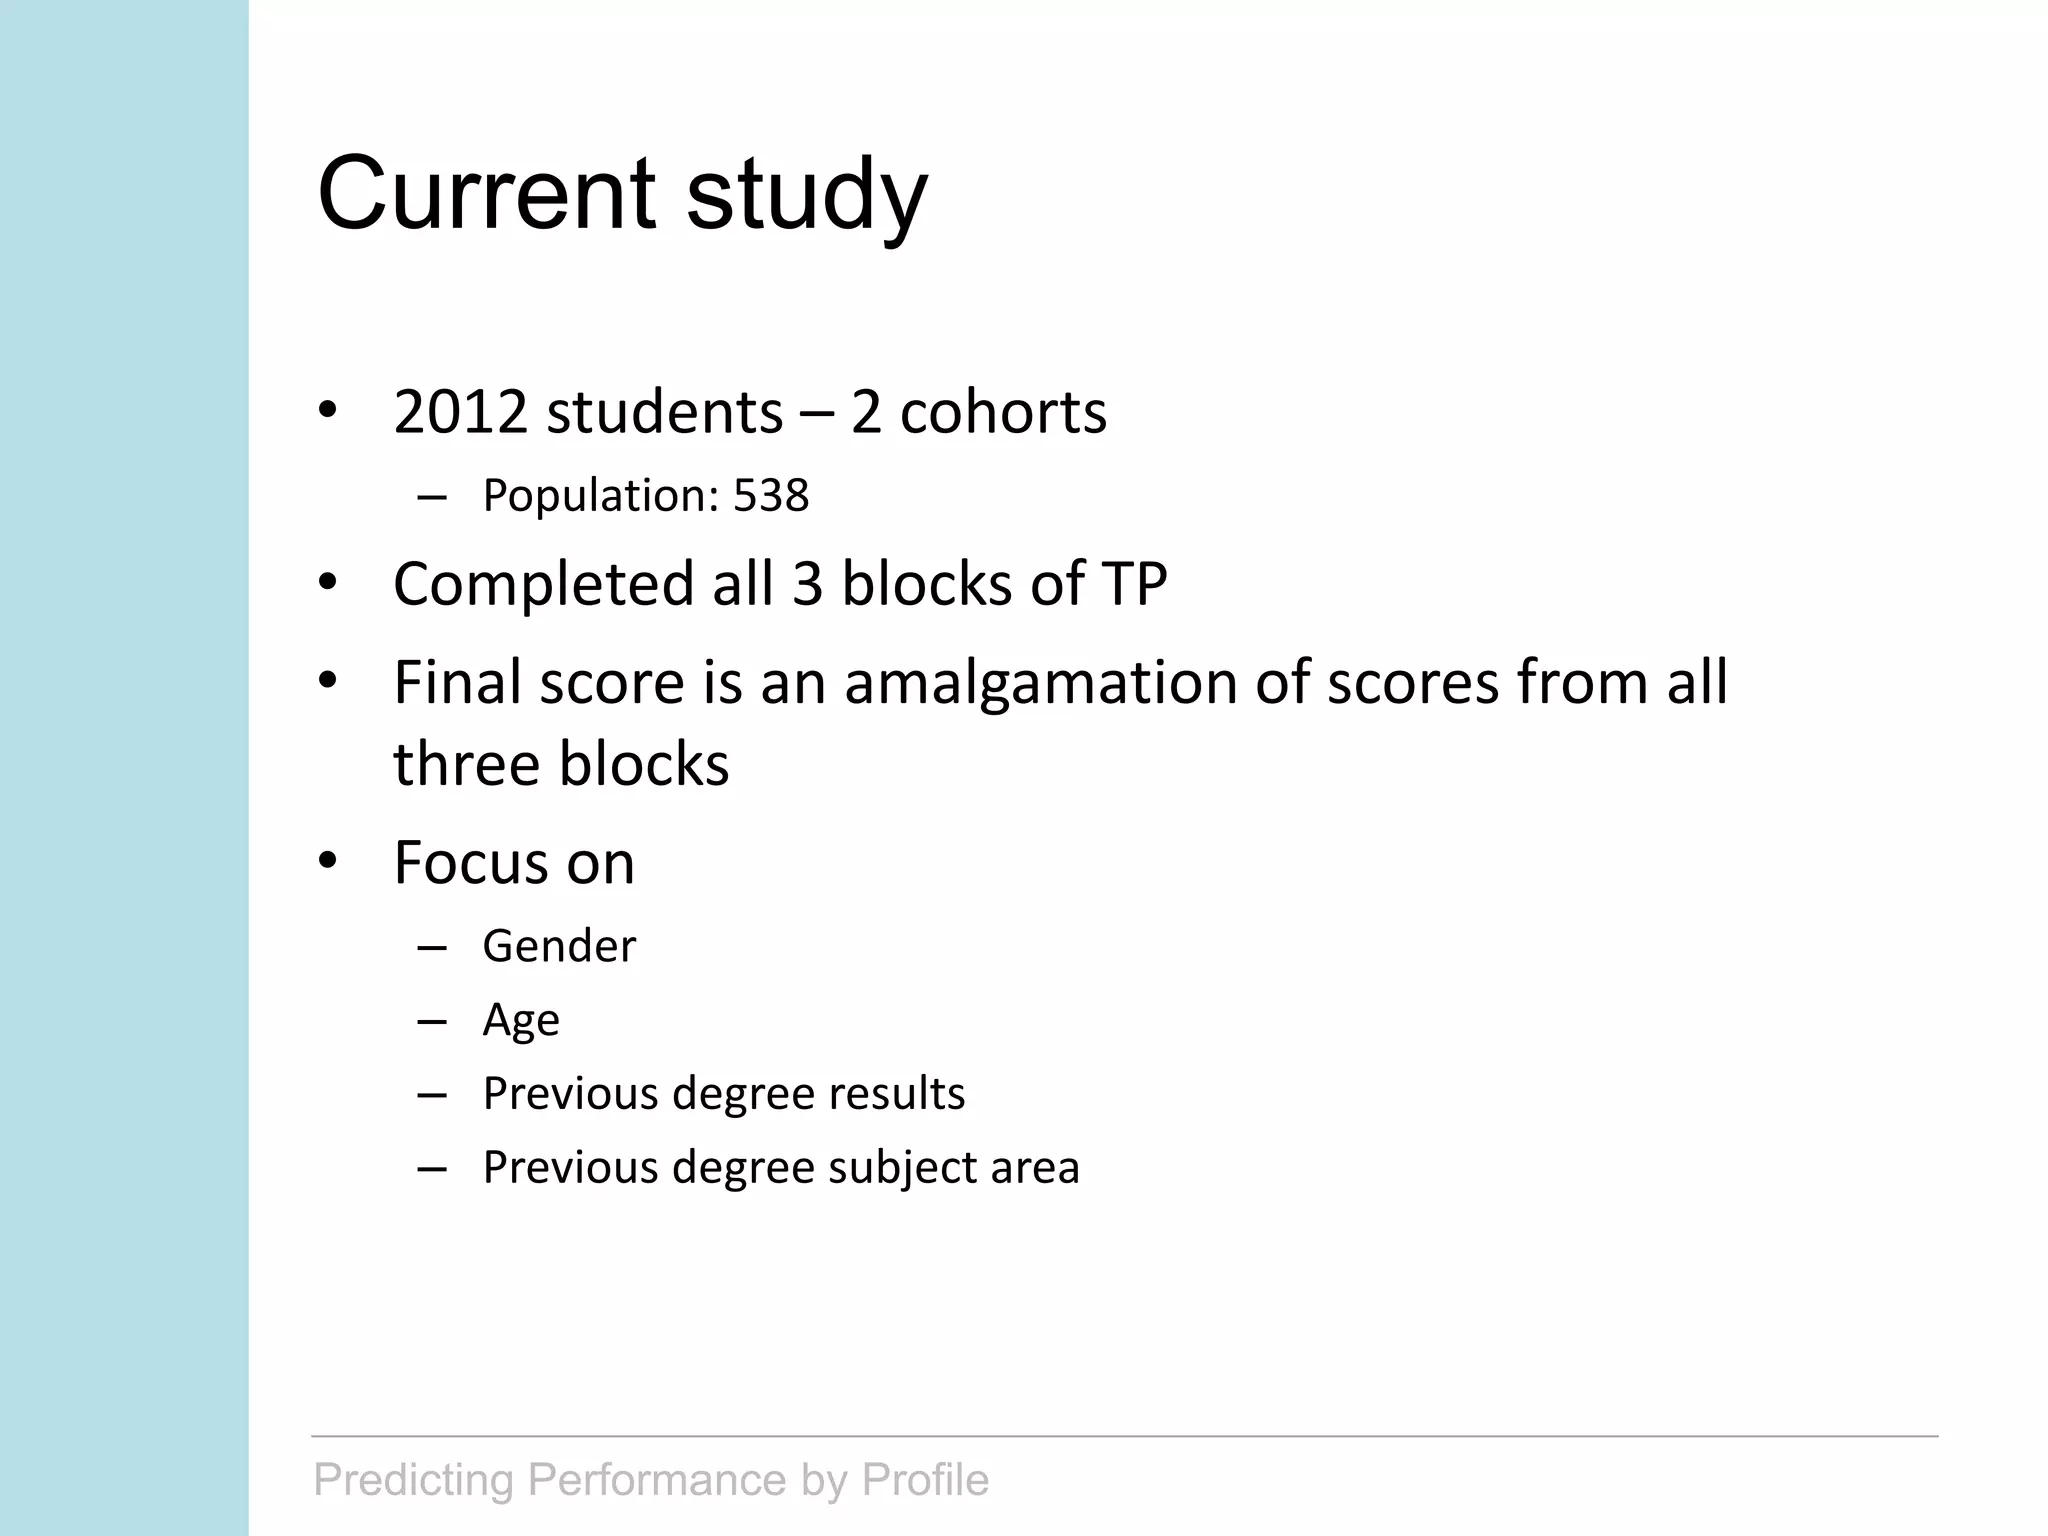
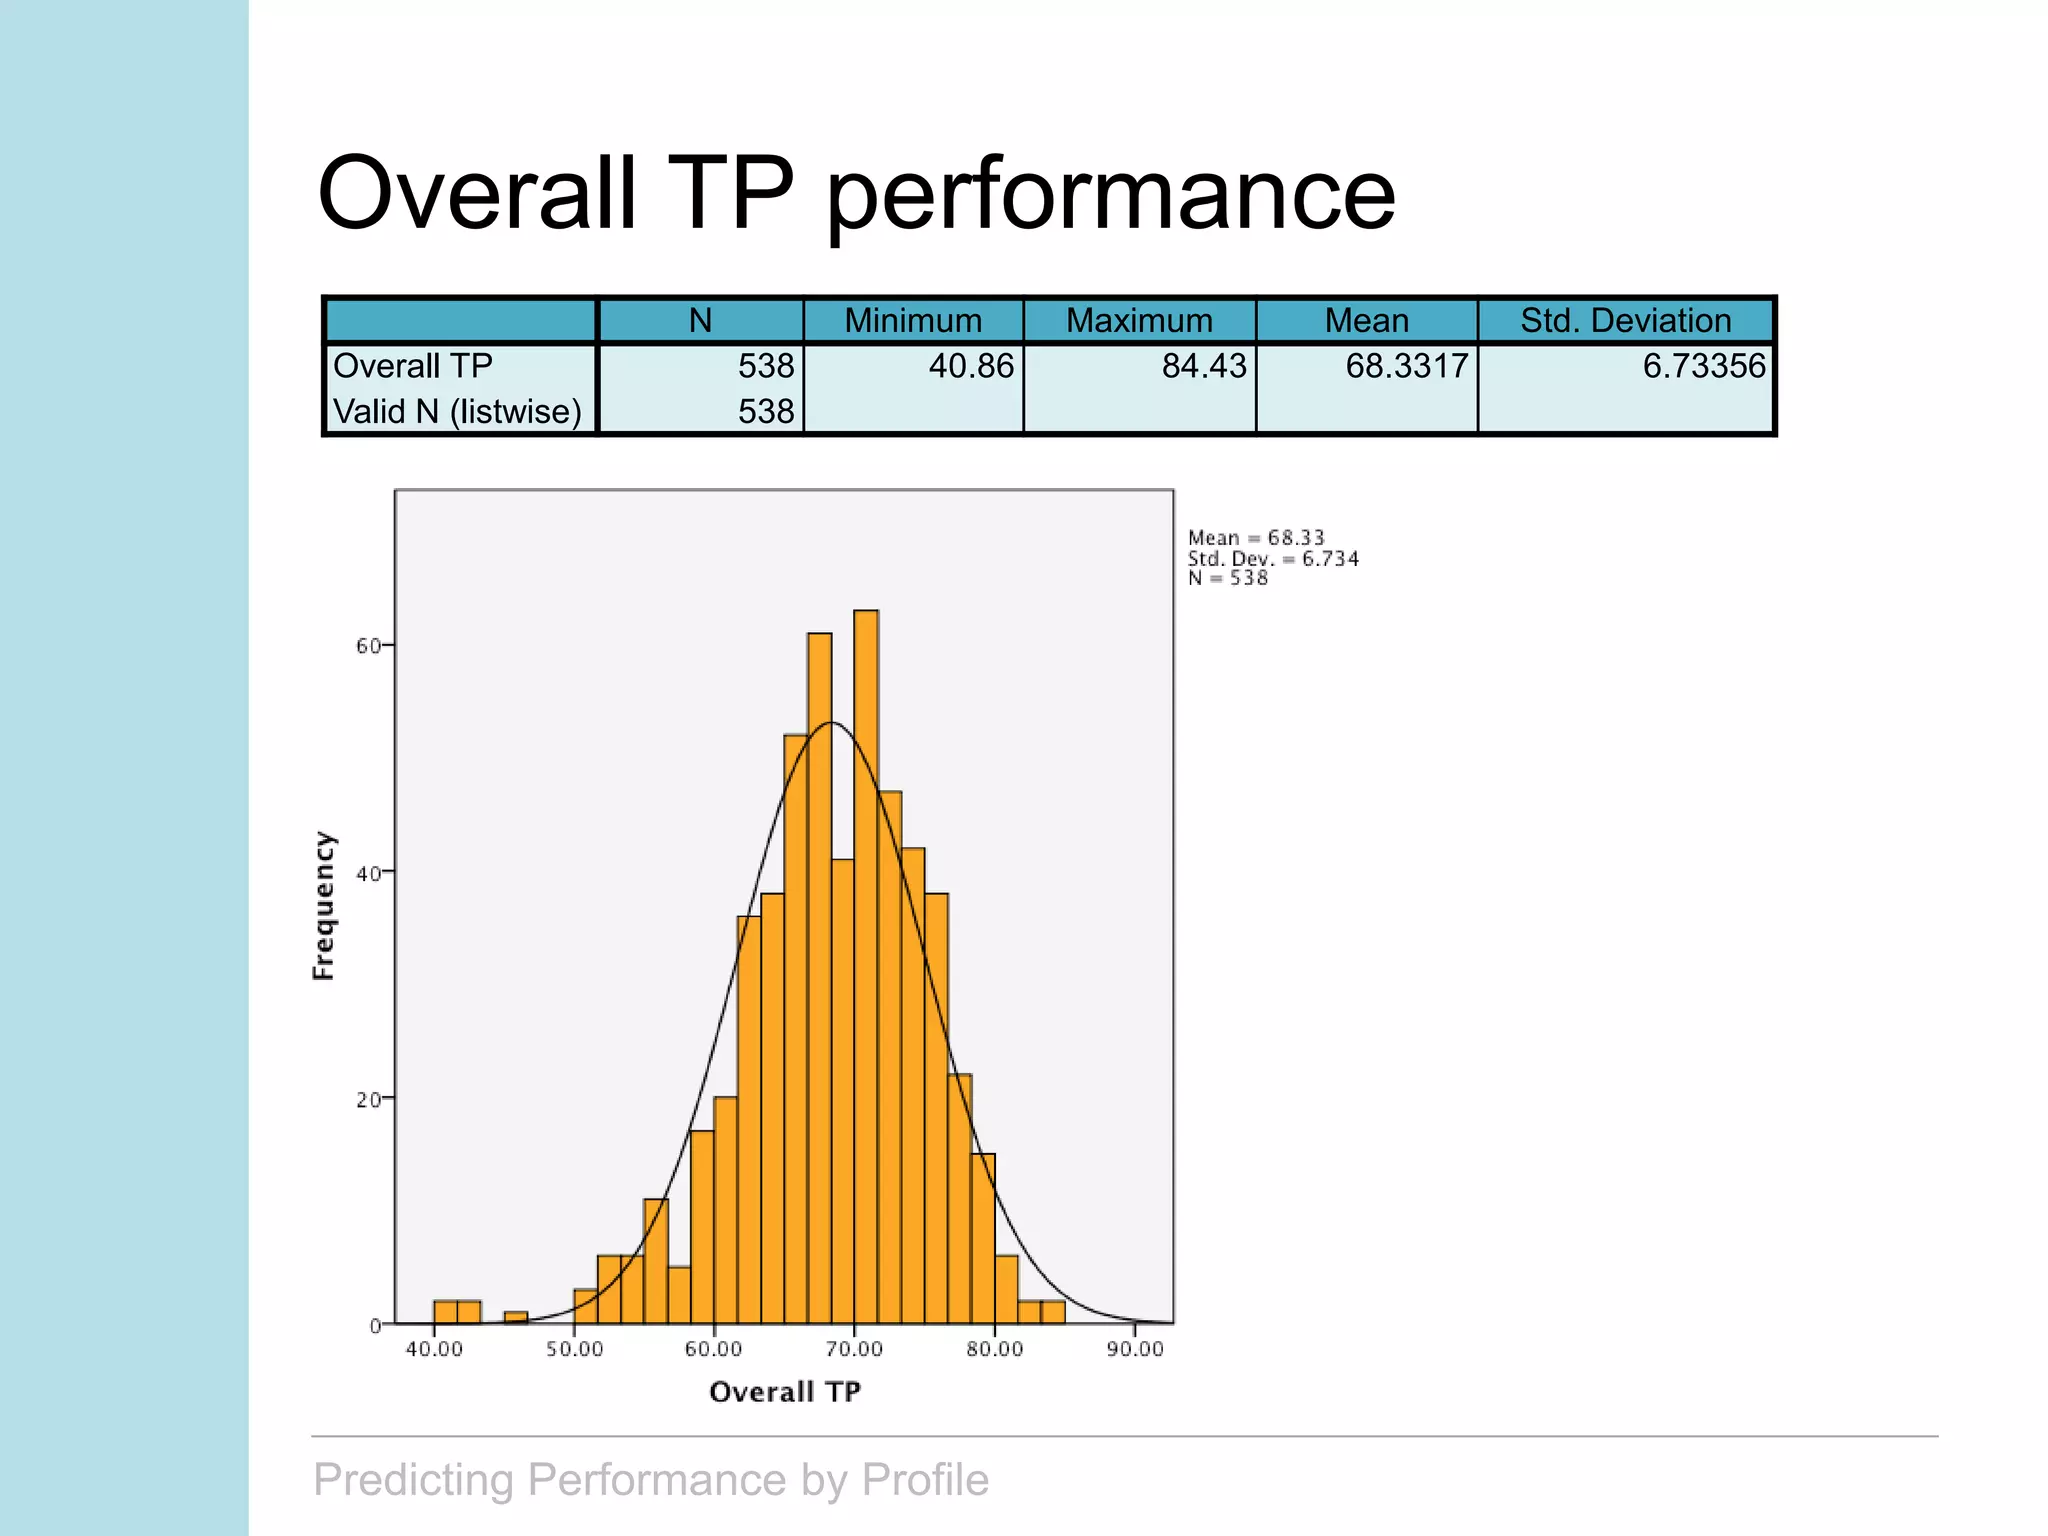
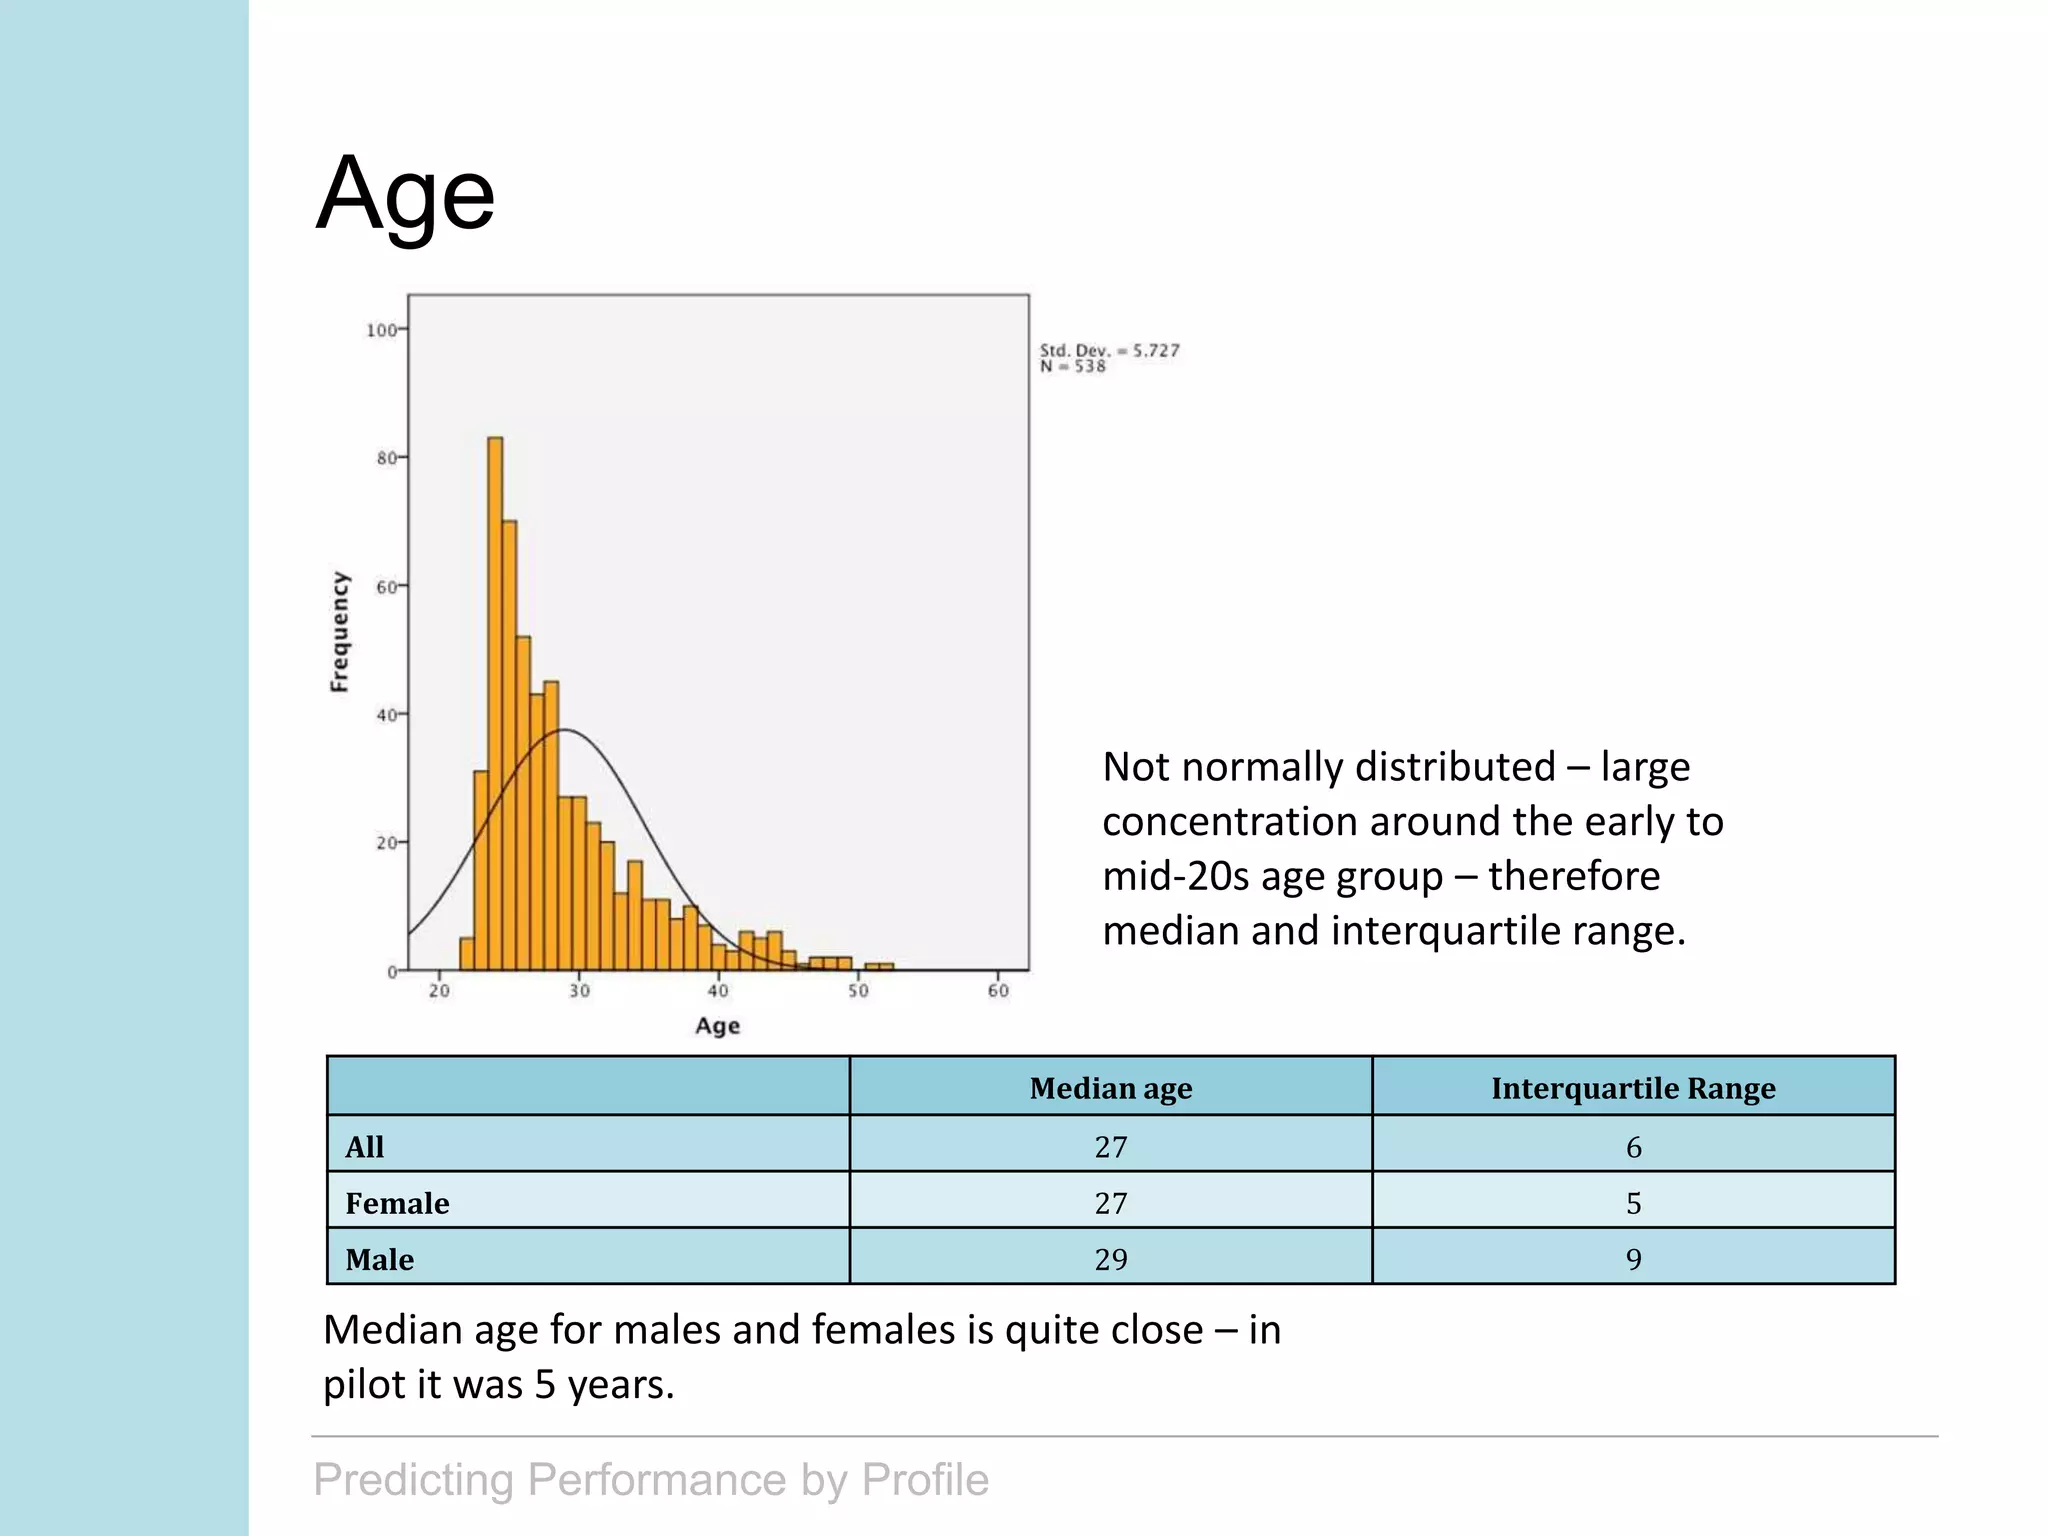
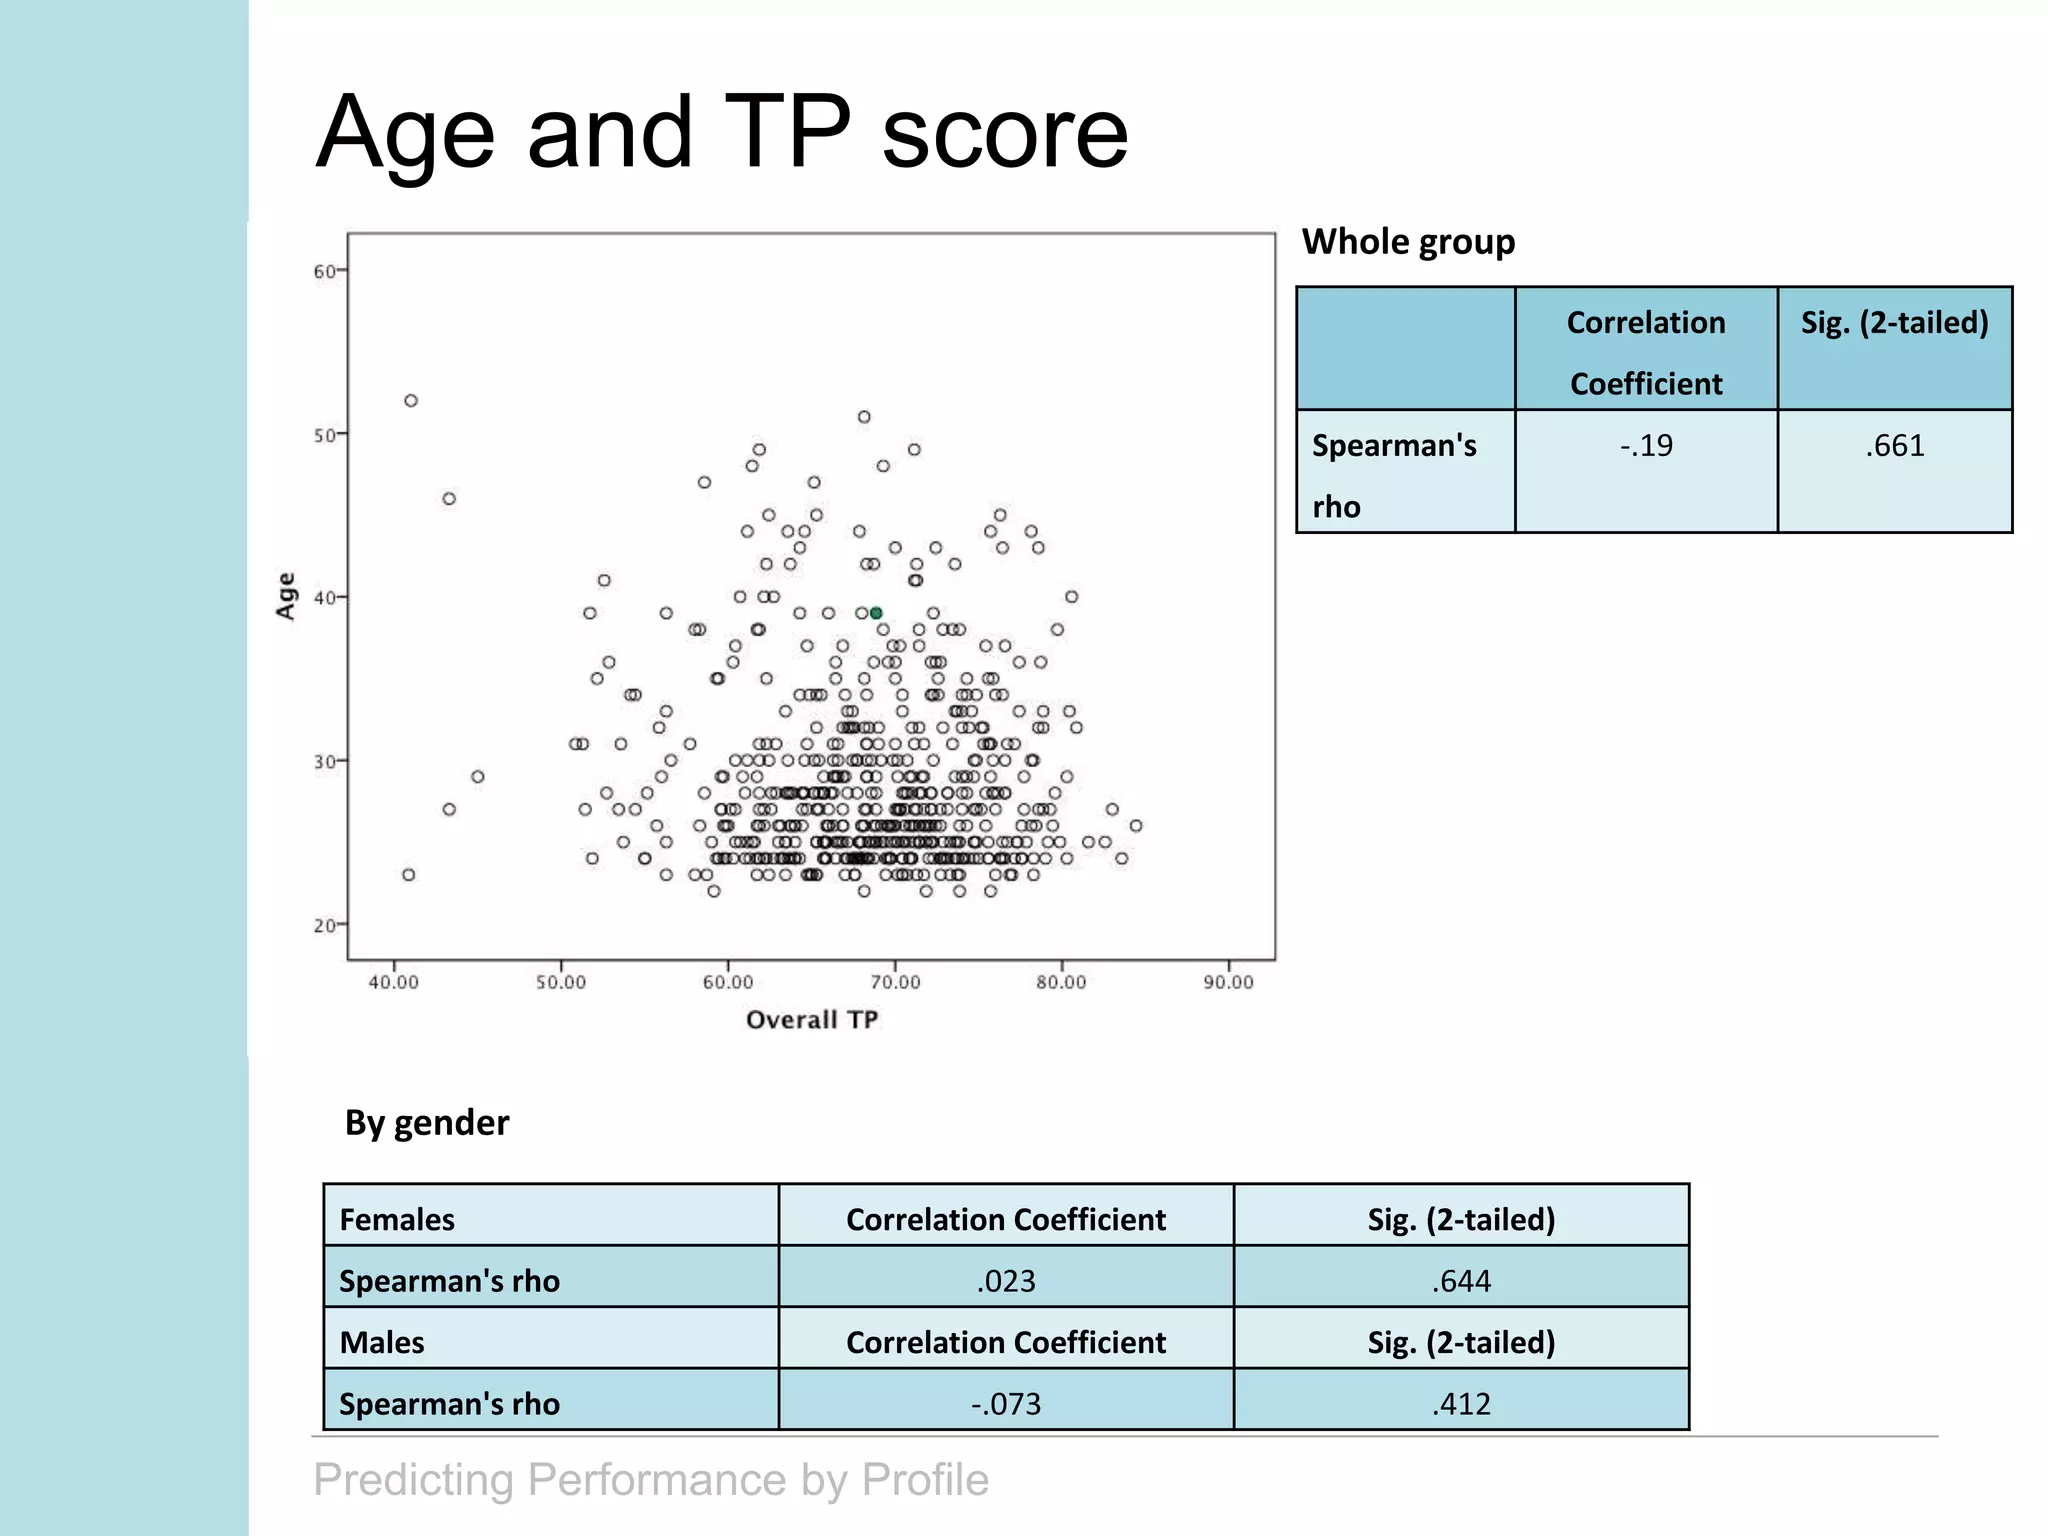
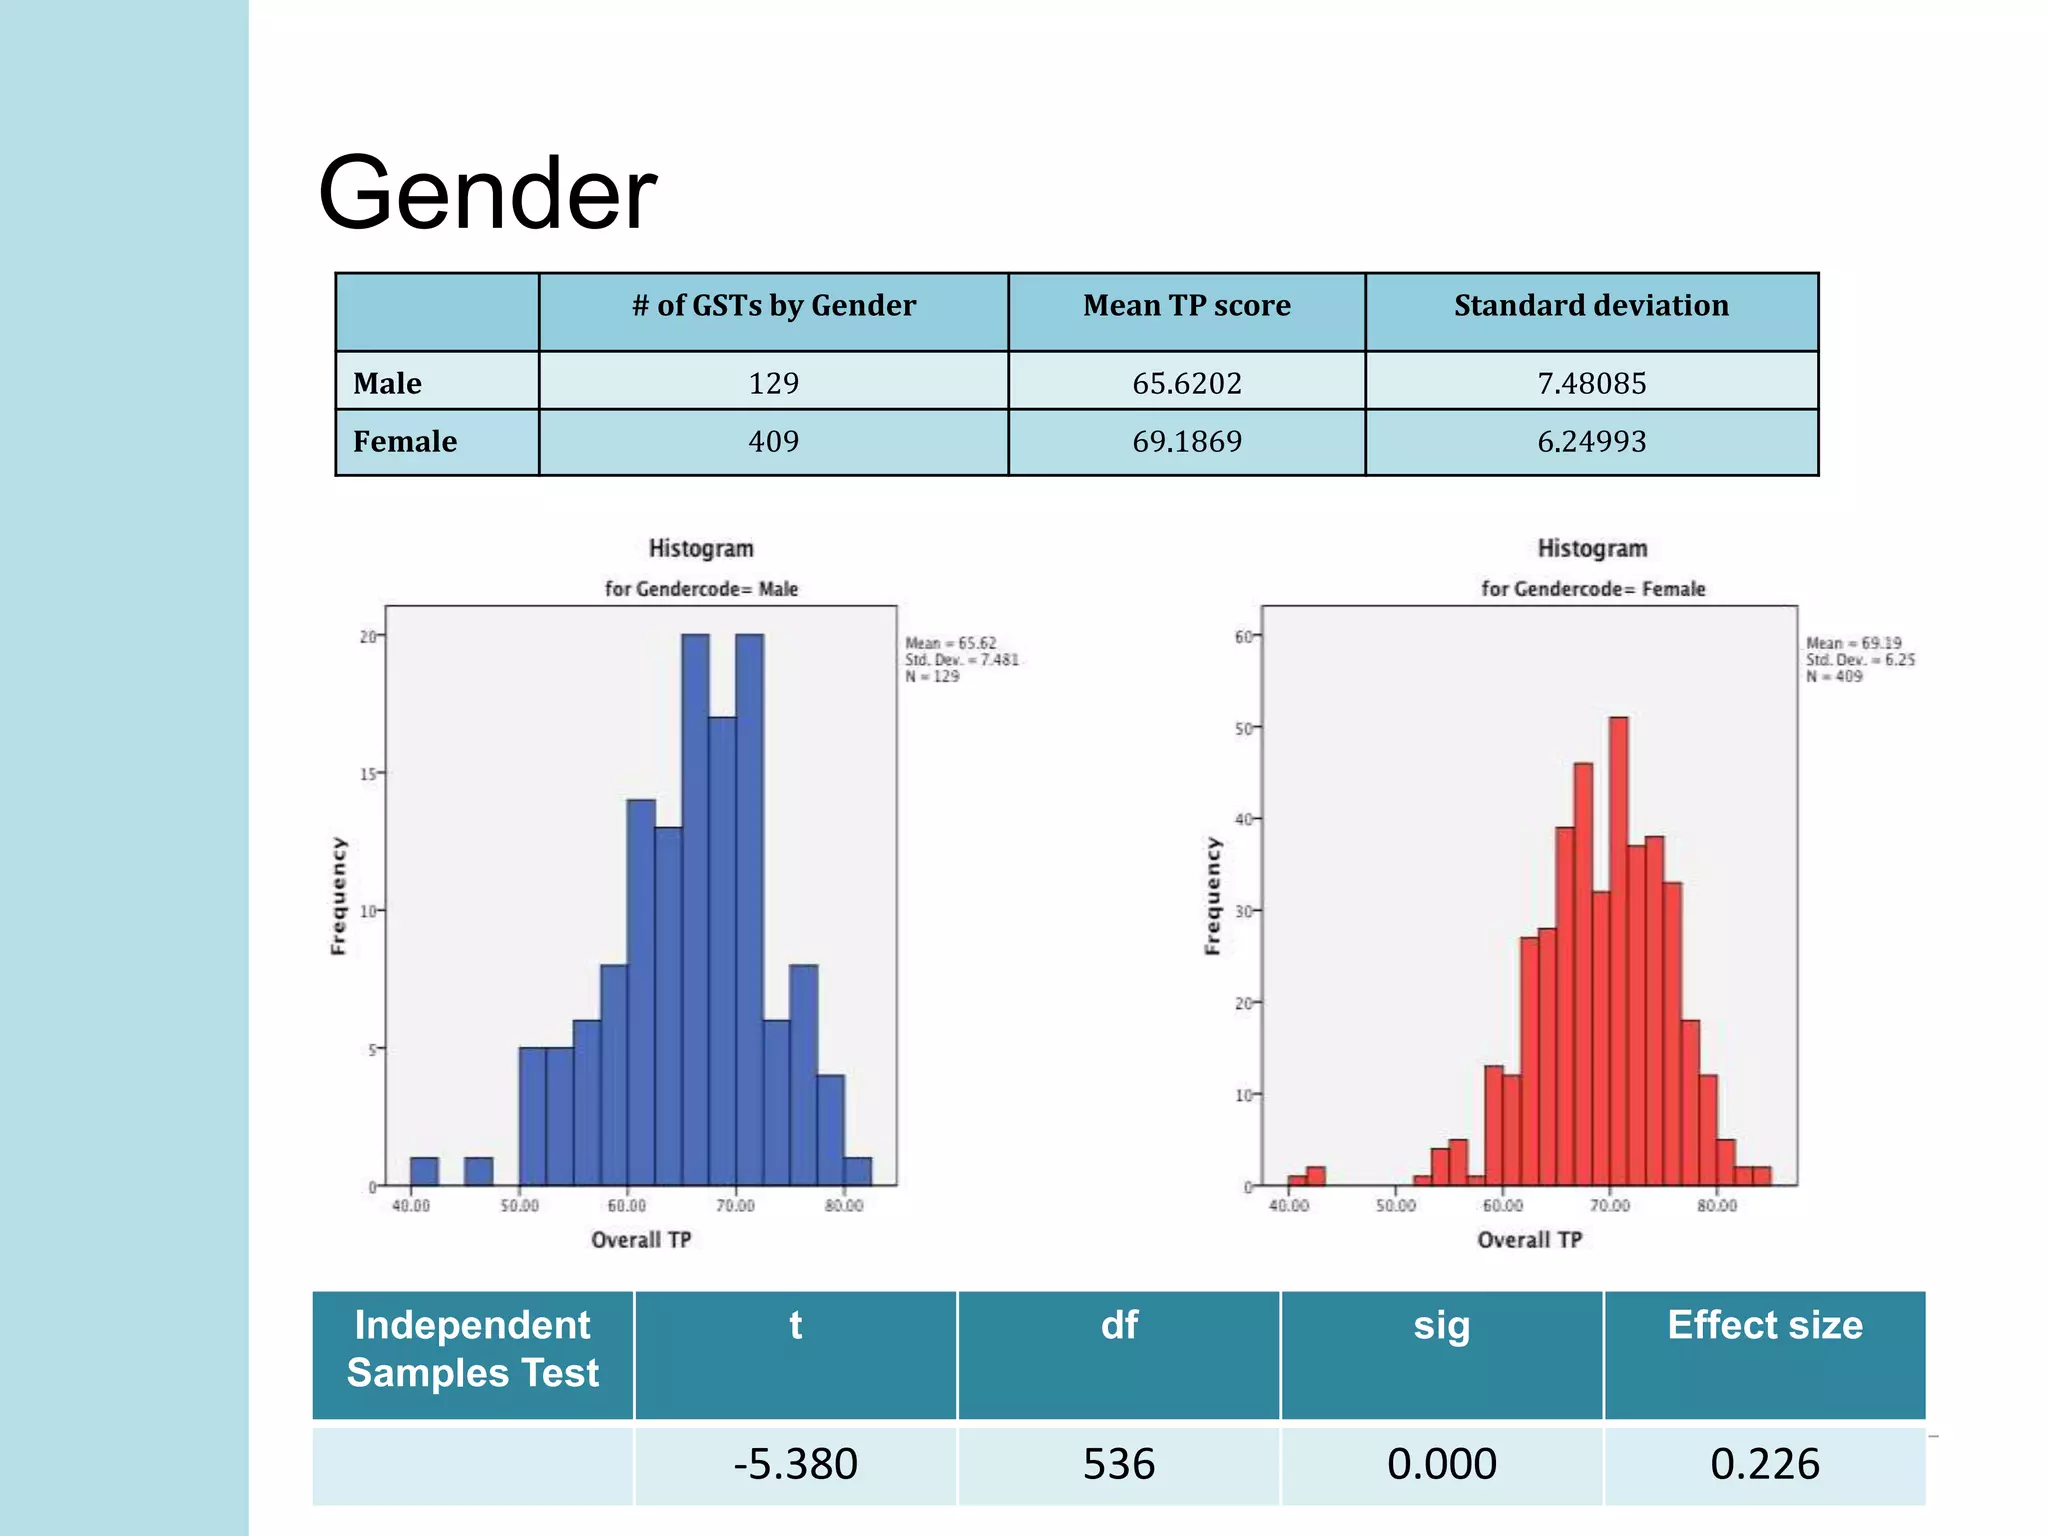
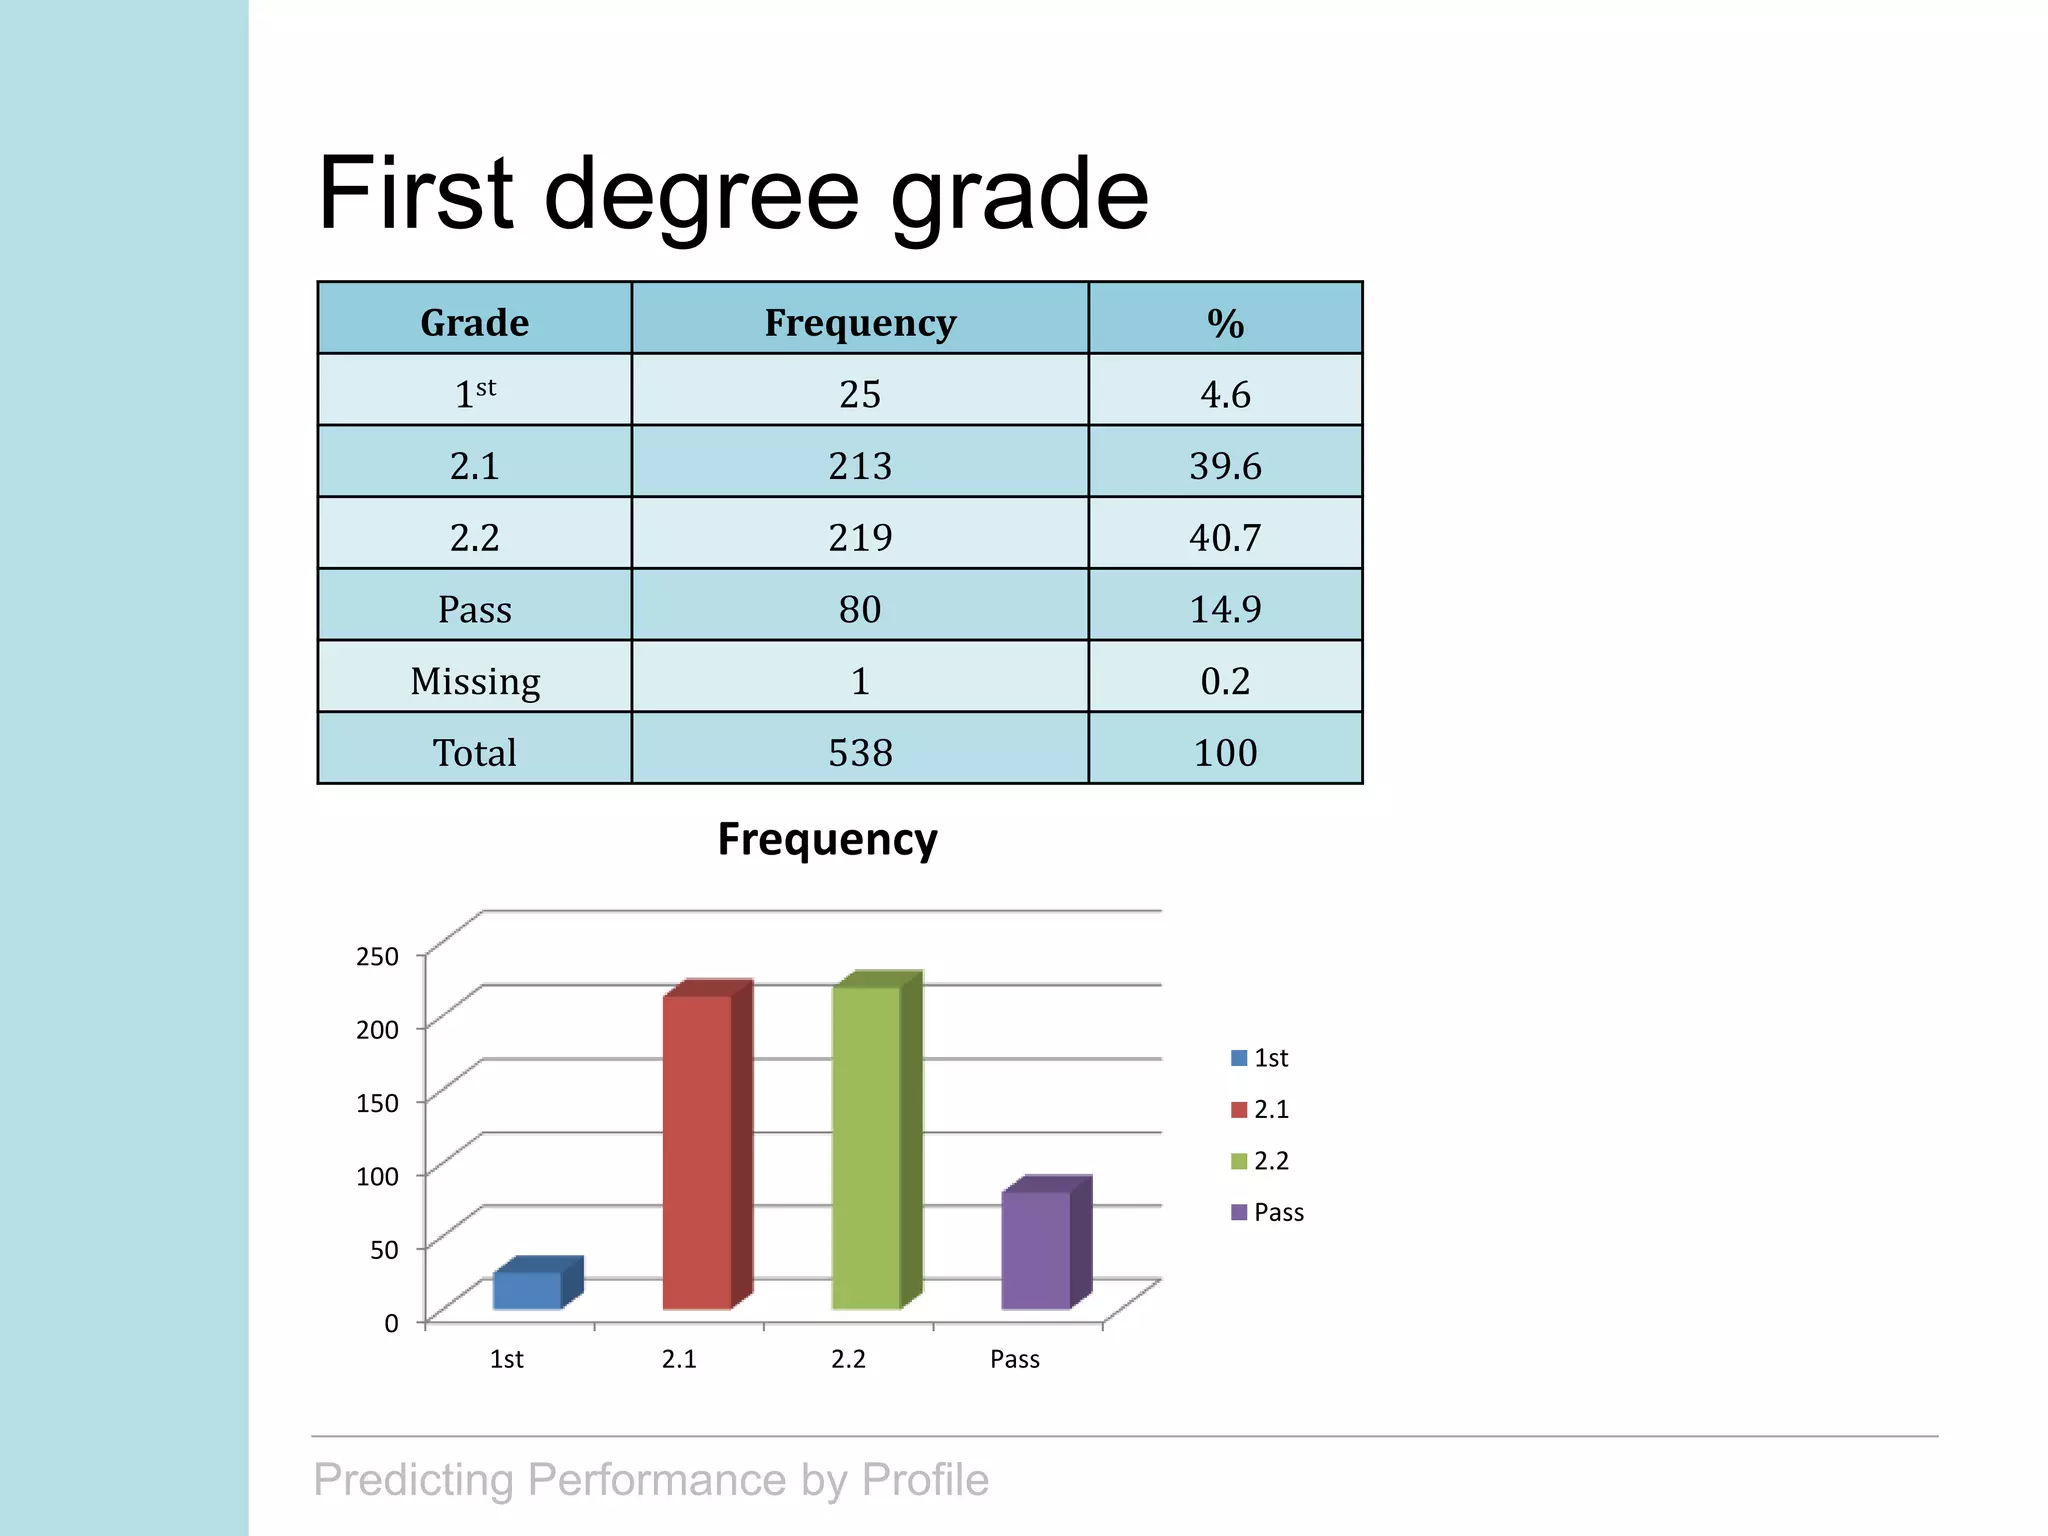
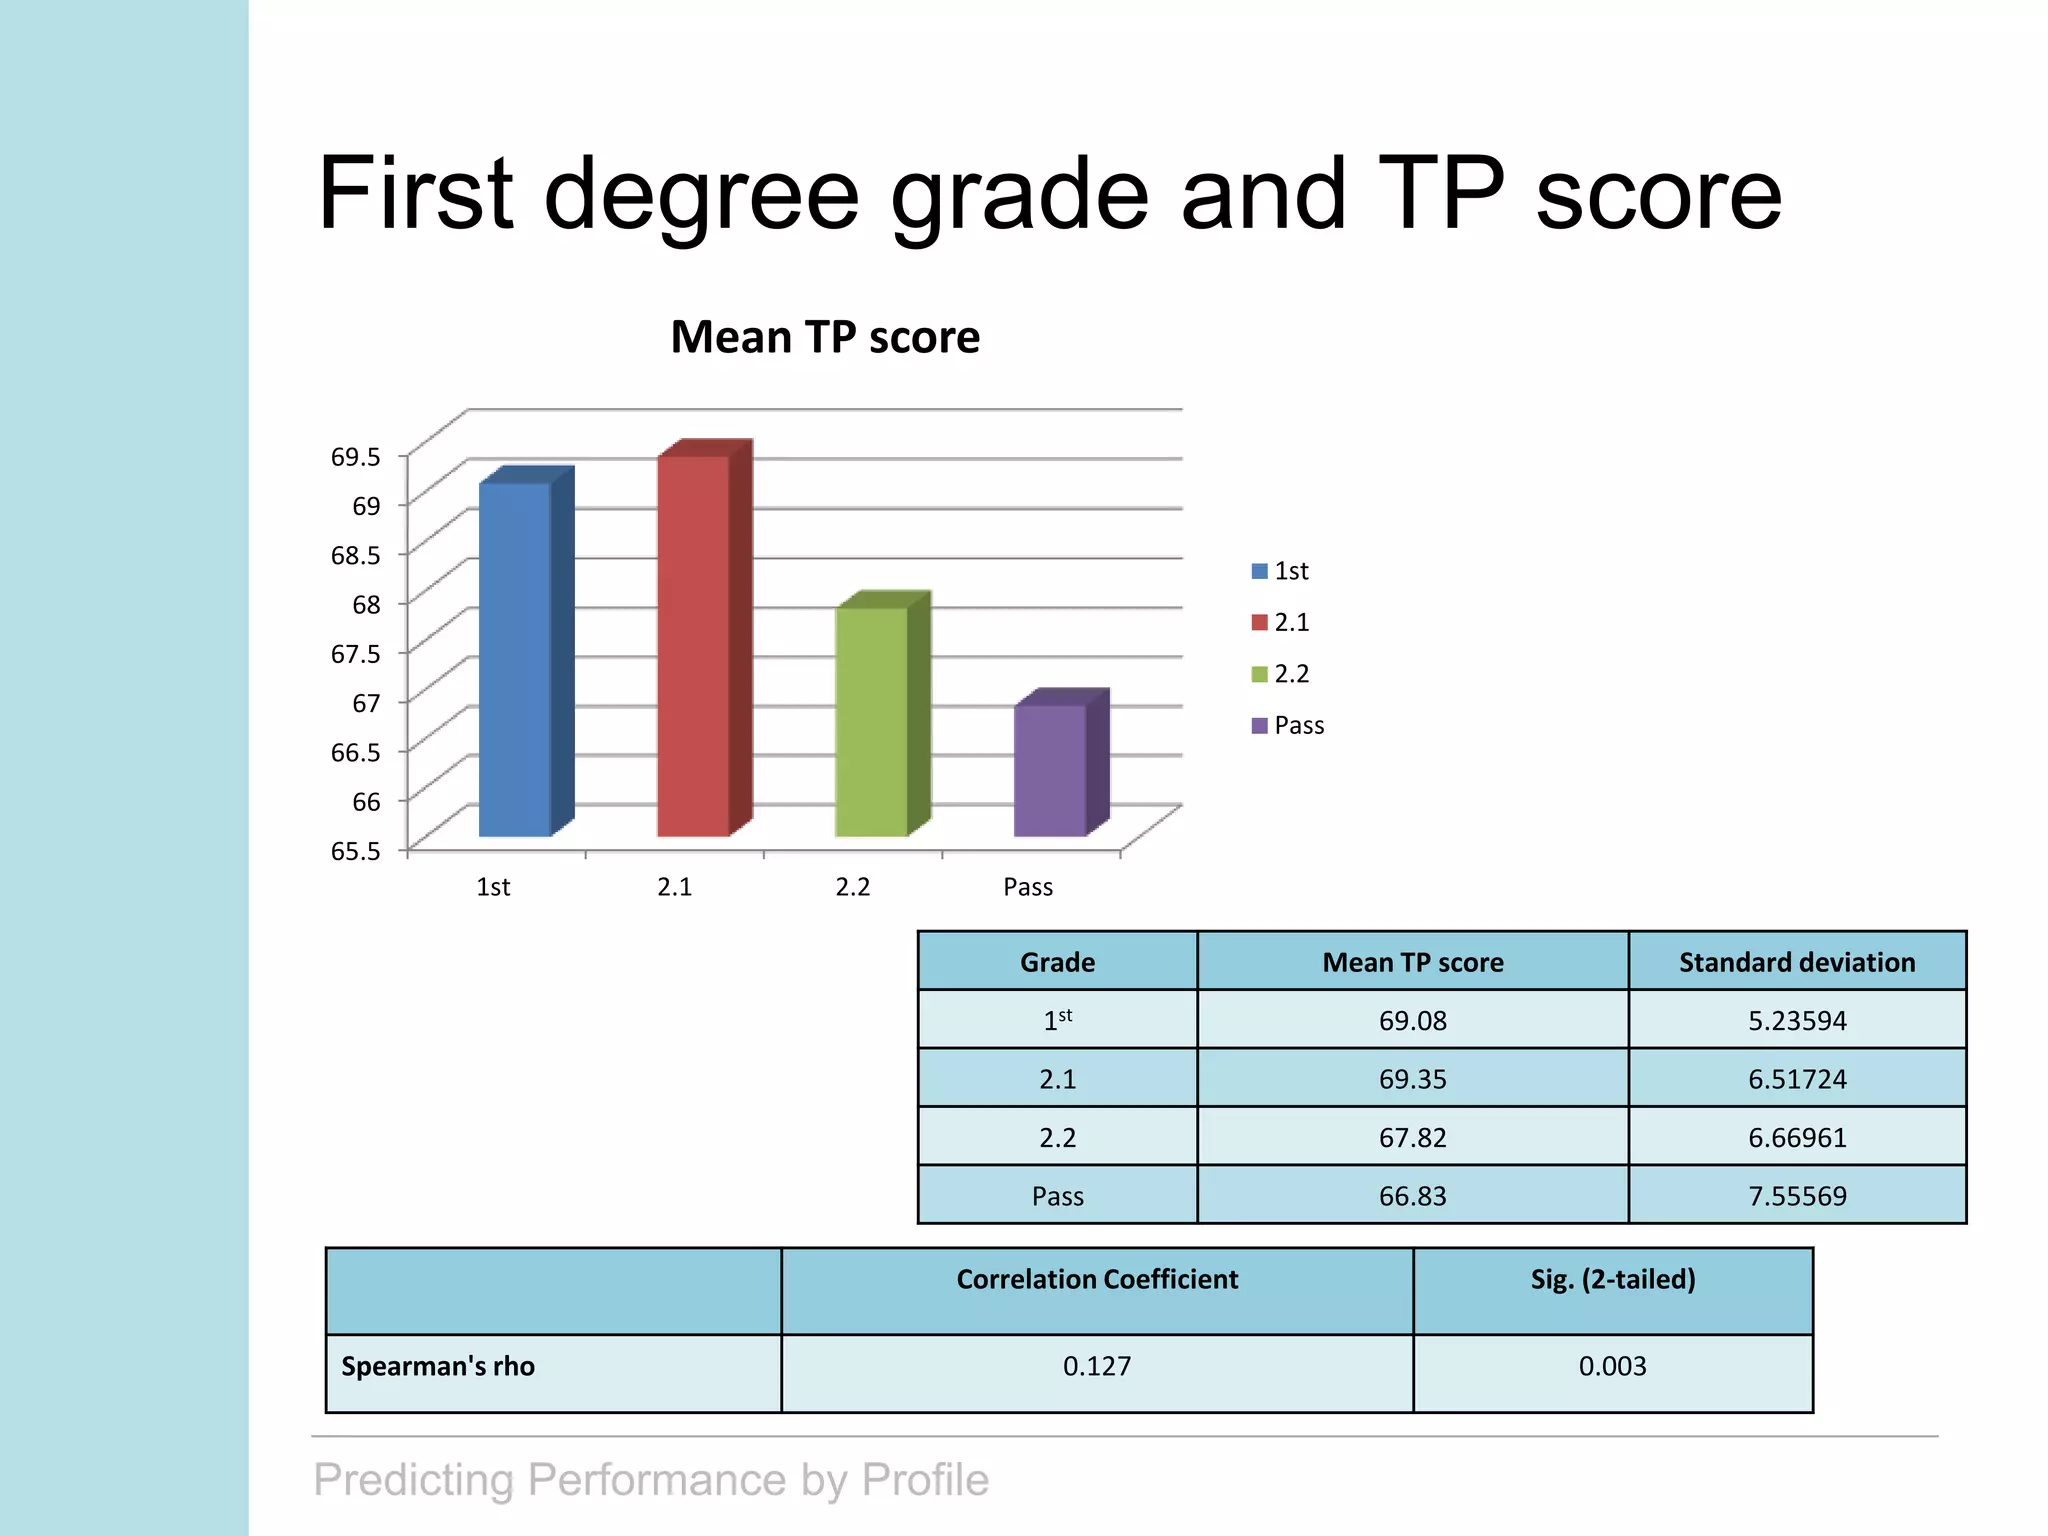
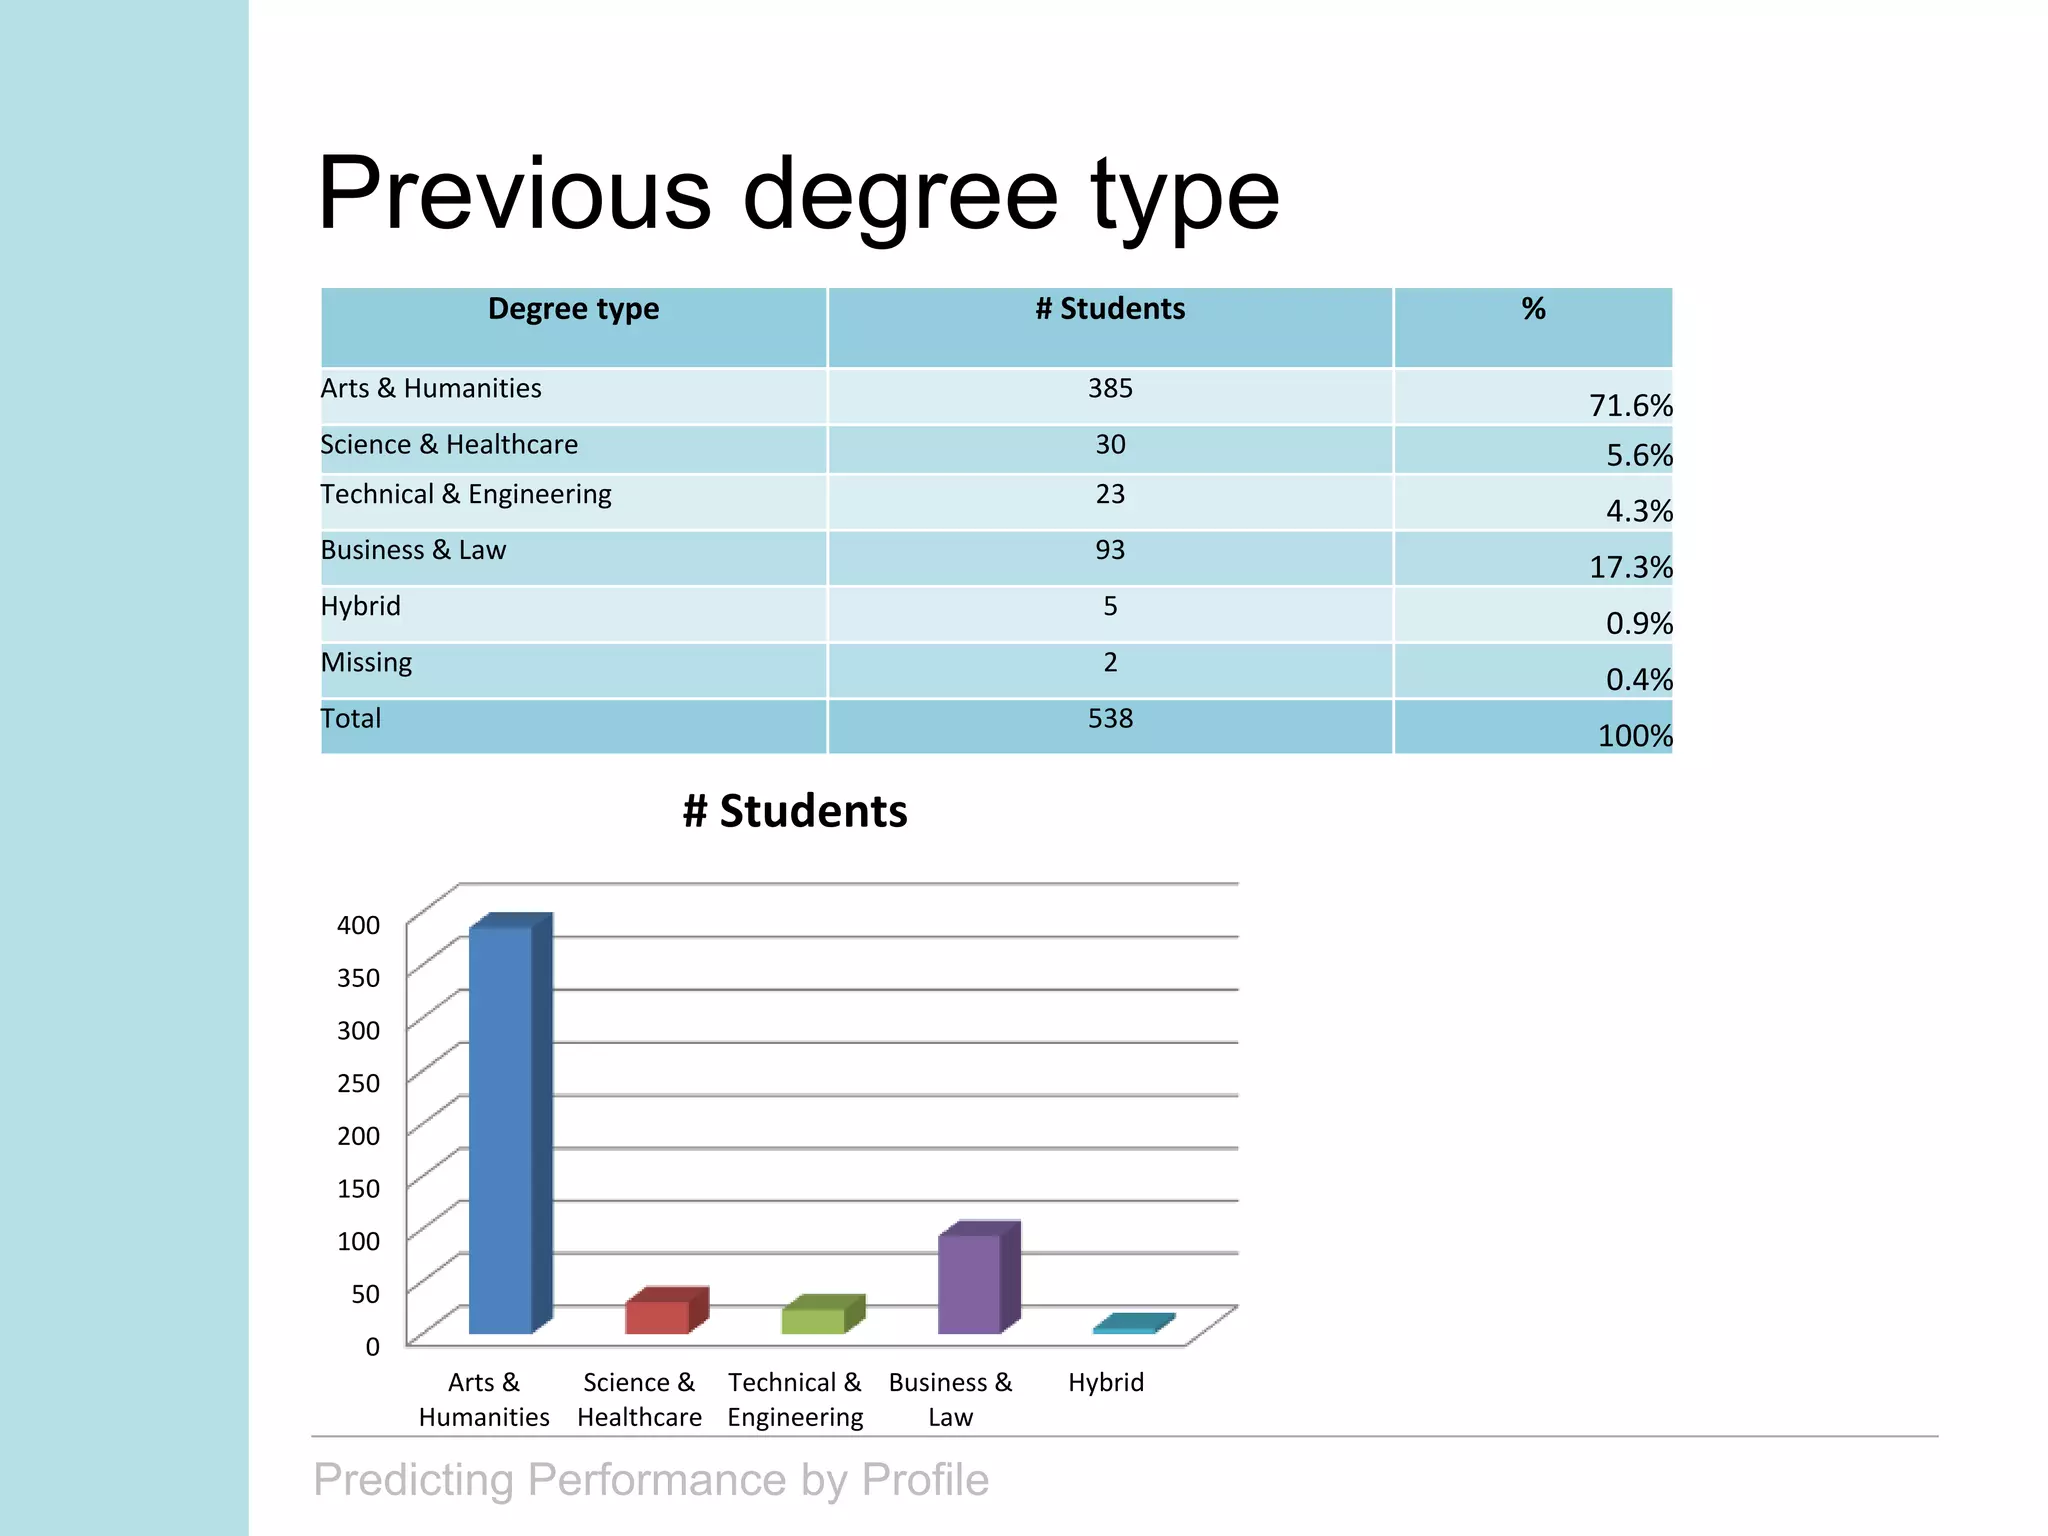
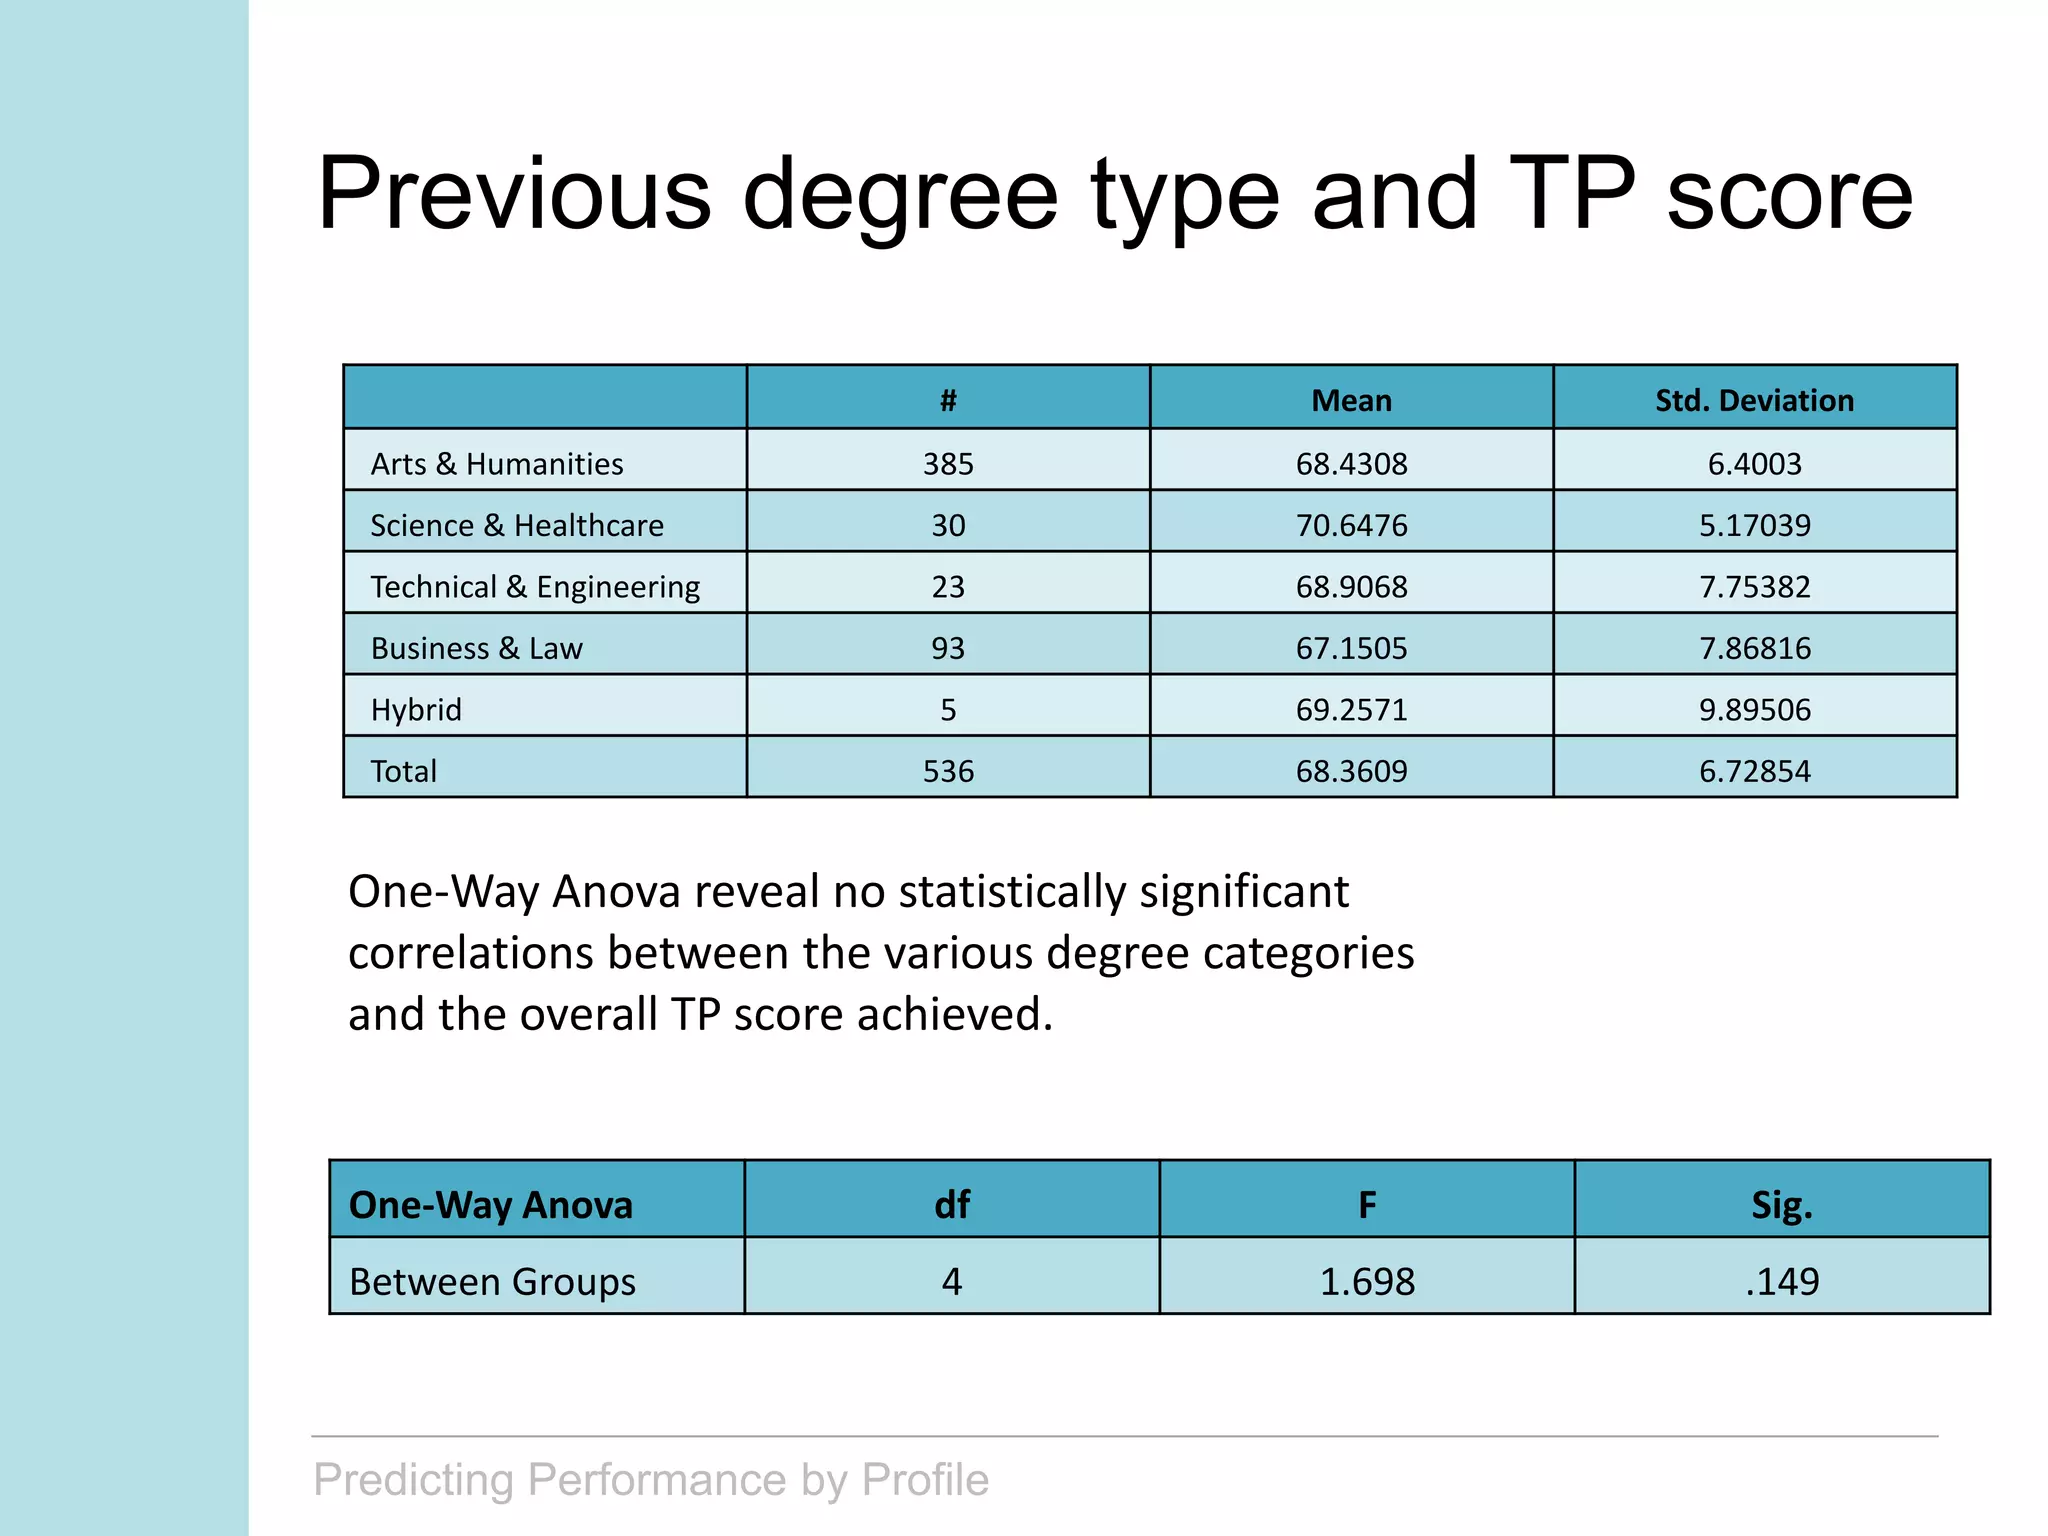
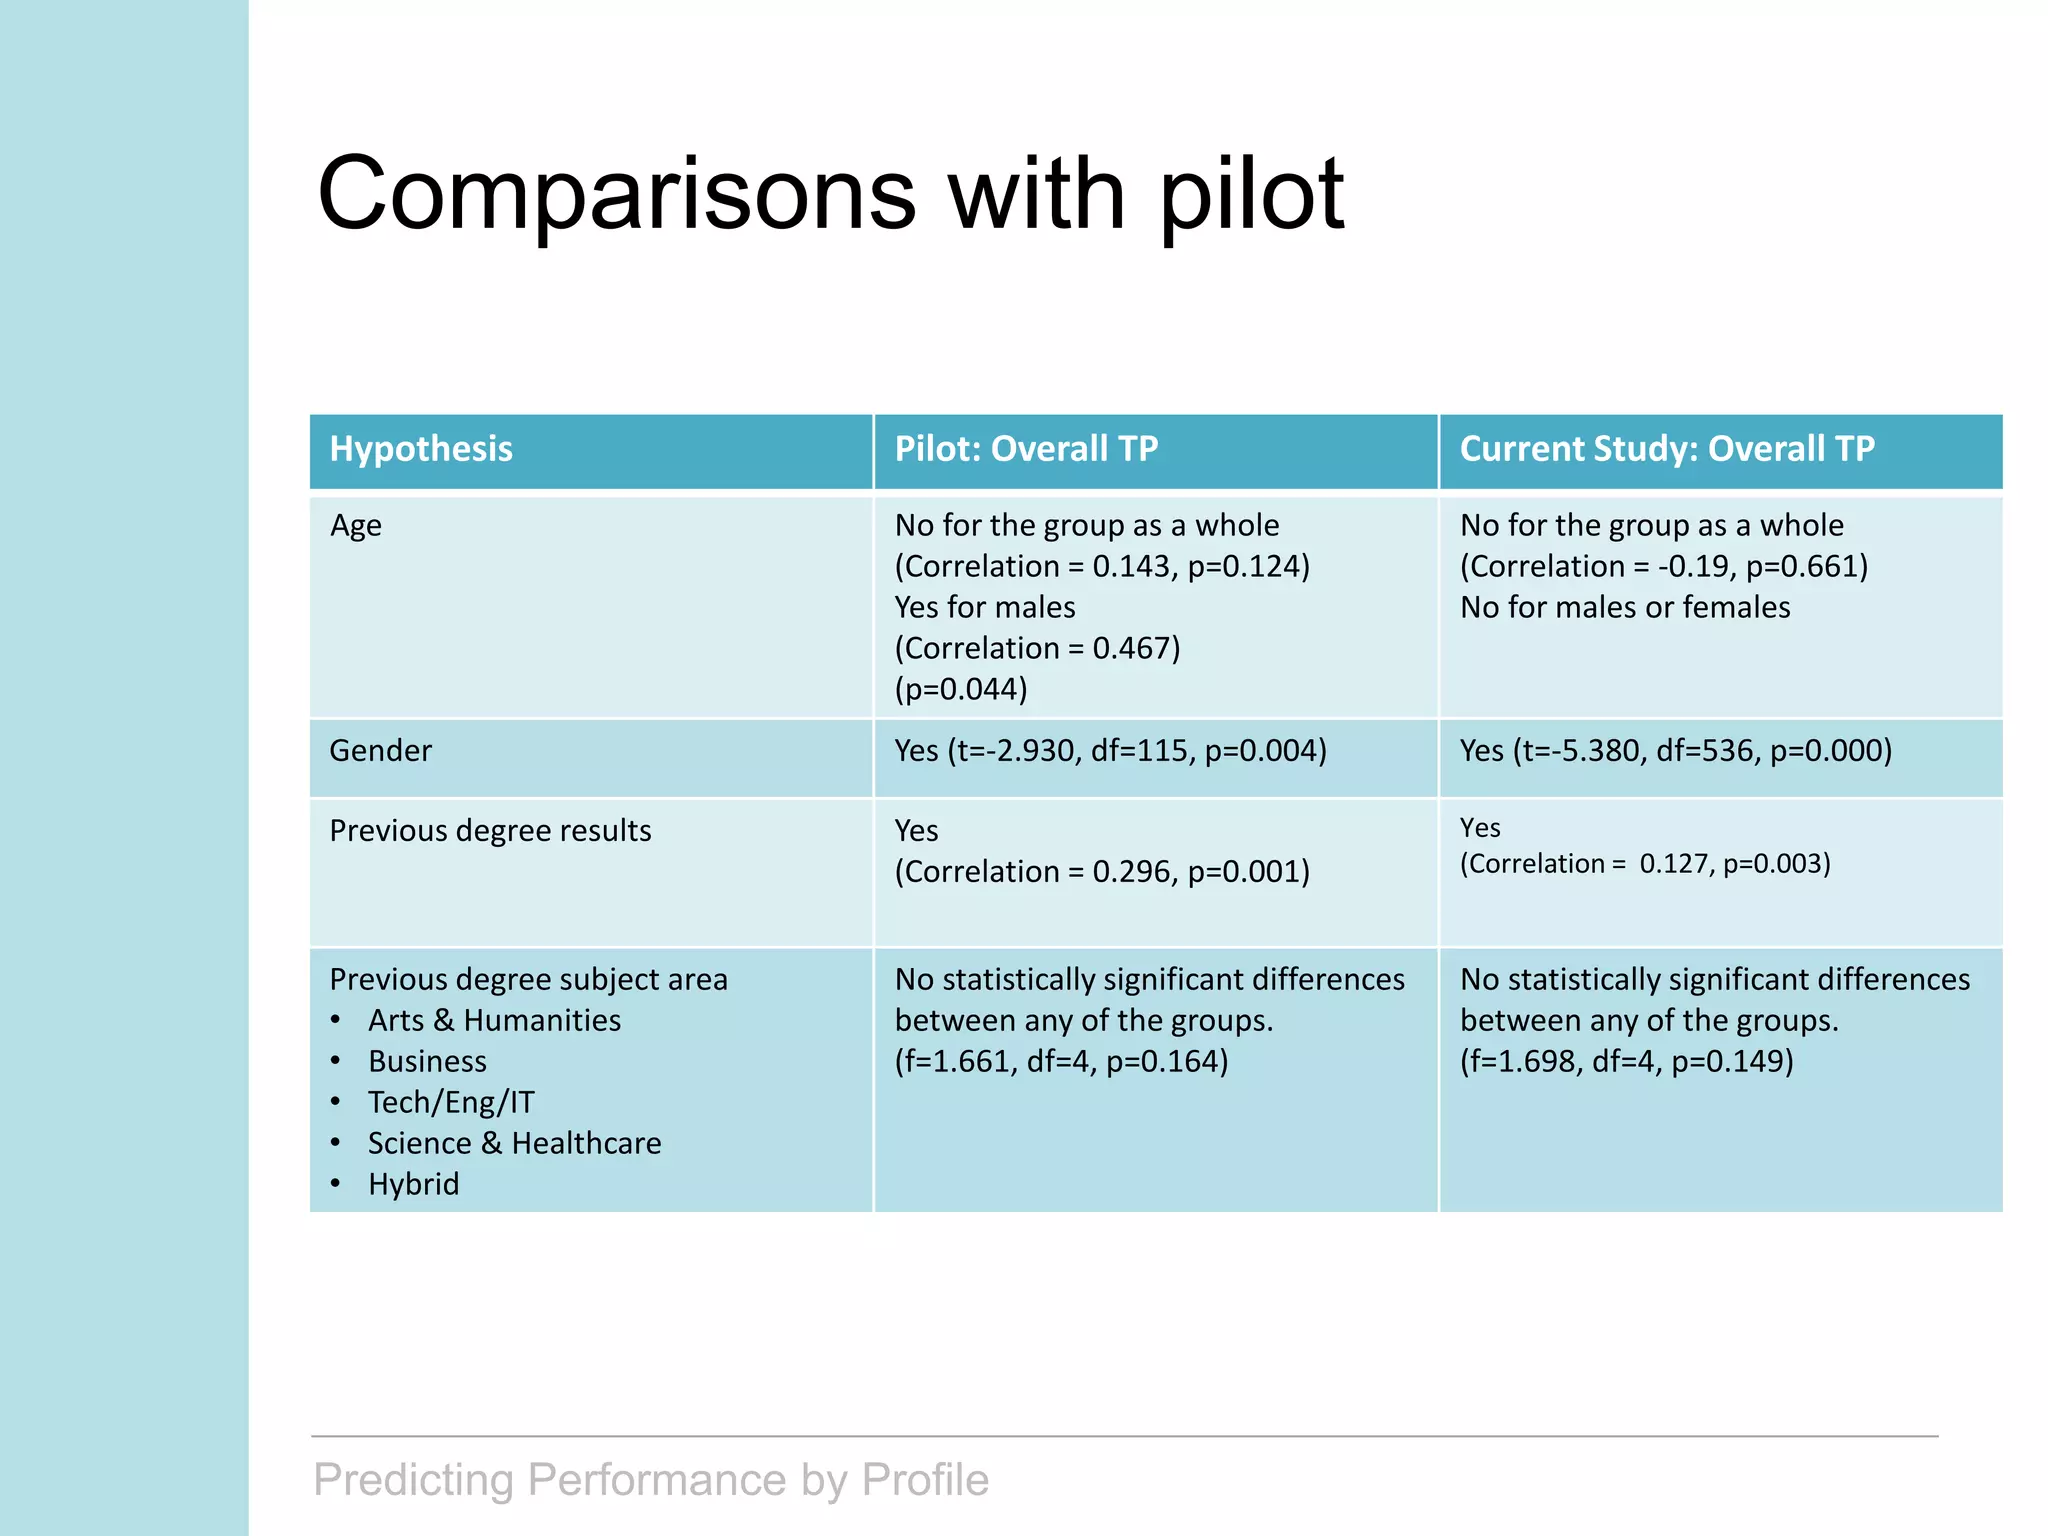
This document reports on a study that examined whether aspects of graduate student teachers' (GSTs) profiles have predictive value in relation to their teaching performance. It summarizes the findings of a previous pilot study and a current study that looked at gender, age, previous degree results and subject area. The current study found that gender and previous degree results were predictive of teaching practice scores, but age and degree subject area were not for the overall sample of 538 GSTs. The document discusses these findings and possibilities for further research.
2. Predicting Performance by Profile
Why look at GST background?
• Coady (2010)
– Strong relationship between the profile characteristics of pre-service
teachers and the course of their development throughout their ITE
programme.
– Research on the profiles of student teachers can help inform ‘how
teachers are prepared, their subsequent teaching practices and the
impact on their students’ learning’ (p288).
3. Predicting Performance by Profile
Diversity of academic background
• Primary school teacher profile: very homogenous,
• Consecutive (post graduate) route facilitates greater
diversity in terms of age, previous studies and work
experience.
• Nolan (2000)
– The diverse academic backgrounds of the graduate students can
‘enhance the capacity of our schools to cater for an increasingly
diversified student population’ (p18).
4. Predicting Performance by Profile
Pilot study
• 2012 pilot study looked at whether aspects of GST profile
have any predictive value in relation to their ultimate
competence as teachers.
• It used the score achieved in the teaching practice (TP)
component of the ITE programme as a potential predictor of
good teaching post qualification.
• The TP component is a very significant part of teacher
training programmes and it is generally the case that a
student cannot pass an ITE programme without passing the
TP component.
• Casey and Childs, (2007)
– ‘Performance in student teaching is related to performance in
independent teaching (p11).
• Greaney et al (1999)
– Found performance in TP to be the best predictor of later teaching
performance (p31).
5. Predicting Performance by Profile
Pilot details
• The study sample was taken from a cohort of students
engaged in a two-year consecutive post-graduate
programme – the Higher Diploma in Arts in Primary
Education (HDAPE). The TP scores were obtained from
the first of three TP blocks that the graduate student
teachers (GSTs) on the programme would undertake.
6. Predicting Performance by Profile
Pilot hypotheses
• There is a relationship between TP score and:
– Age
– Gender
– Leaving Certificate points
– Previous degree results
– Previous degree subject area
– Number of years of work experience
– The nature of work experience undertaken.
• Final sample was comprised of 119 GSTs (34.5% of the
total cohort)
7. Hypothesis 2012 Finding (TP1) 2014 Follow up (Overall TP)
Age No for the group as a whole (p=0.105)
Yes for males
(Correlation = 0.541)
(p=0.017)
No for the group as a whole (p=0.124)
Yes for males
(Correlation = 0.467)
(p=0.044)
Gender No (t= -1.806, df = 117, p=0.074) Yes (t=-2.930, df=115, p=0.004)
Leaving Certificate Examination (LCE)
points
No (r=0.090, p=0.331) No (r=0.115, p=0.217)
Previous degree results Yes
(Correlation = 0.199)
(p=0.030)
Yes
(Correlation = 0.296)
(p=0.001)
Previous degree subject area
• Arts & Humanities
• Business
• Tech/Eng/IT
• Science & Healthcare
• Hybrid
Between groups (f=2.567, df=4, p=0.042)
Statistically significant difference between
Science & Healthcare compared with
Business (p=0.019)
Between groups (f=1.661, df=4, p=0.164)
No statistically significant differences
between any of the groups.
Number of years of work experience No (Correlation = 0.131; p=0.156) No (Correlation = 0.101; p=0.278)
The nature of work experience
undertaken
• Child focused
• Office work
• Customer facing
• Technical
• Miscellaneous
• None
No (df=5, F=1.409, p=.226) No (df=5, F=1.132, p=.348)
Pilot results and follow-up
8. Predicting Performance by Profile
Current study
• 2012 students – 2 cohorts
– Population: 538
• Completed all 3 blocks of TP
• Final score is an amalgamation of scores from all
three blocks
• Focus on
– Gender
– Age
– Previous degree results
– Previous degree subject area
9. Predicting Performance by Profile
Overall TP performance
N Minimum Maximum Mean Std. Deviation
Overall TP 538 40.86 84.43 68.3317 6.73356
Valid N (listwise) 538
10. Predicting Performance by Profile
Not normally distributed – large
concentration around the early to
mid-20s age group – therefore
median and interquartile range.
Median age Interquartile Range
All 27 6
Female 27 5
Male 29 9
Median age for males and females is quite close – in
pilot it was 5 years.
Age
11. Predicting Performance by Profile
Age and TP score
Correlation
Coefficient
Sig. (2-tailed)
Spearman's
rho
-.19 .661
Females Correlation Coefficient Sig. (2-tailed)
Spearman's rho .023 .644
Males Correlation Coefficient Sig. (2-tailed)
Spearman's rho -.073 .412
Whole group
By gender
12. Predicting Performance by Profile
Gender
# of GSTs by Gender Mean TP score Standard deviation
Male 129 65.6202 7.48085
Female 409 69.1869 6.24993
Independent
Samples Test
t df sig Effect size
-5.380 536 0.000 0.226
13. Predicting Performance by Profile
First degree grade
0
50
100
150
200
250
1st 2.1 2.2 Pass
Frequency
1st
2.1
2.2
Pass
Grade Frequency %
1st 25 4.6
2.1 213 39.6
2.2 219 40.7
Pass 80 14.9
Missing 1 0.2
Total 538 100
14. Predicting Performance by Profile
Grade Mean TP score Standard deviation
1st 69.08 5.23594
2.1 69.35 6.51724
2.2 67.82 6.66961
Pass 66.83 7.55569
Correlation Coefficient Sig. (2-tailed)
Spearman's rho 0.127 0.003
65.5
66
66.5
67
67.5
68
68.5
69
69.5
1st 2.1 2.2 Pass
Mean TP score
1st
2.1
2.2
Pass
First degree grade and TP score
15. Predicting Performance by Profile
Previous degree type
0
50
100
150
200
250
300
350
400
Arts &
Humanities
Science &
Healthcare
Technical &
Engineering
Business &
Law
Hybrid
# Students
Degree type # Students %
Arts & Humanities 385
71.6%
Science & Healthcare 30 5.6%
Technical & Engineering 23
4.3%
Business & Law 93
17.3%
Hybrid 5
0.9%
Missing 2
0.4%
Total 538
100%
16. Predicting Performance by Profile
One-Way Anova df F Sig.
Between Groups 4 1.698 .149
One-Way Anova reveal no statistically significant
correlations between the various degree categories
and the overall TP score achieved.
Previous degree type and TP score
# Mean Std. Deviation
Arts & Humanities 385 68.4308 6.4003
Science & Healthcare 30 70.6476 5.17039
Technical & Engineering 23 68.9068 7.75382
Business & Law 93 67.1505 7.86816
Hybrid 5 69.2571 9.89506
Total 536 68.3609 6.72854
17. Predicting Performance by Profile
Hypothesis Pilot: Overall TP Current Study: Overall TP
Age No for the group as a whole
(Correlation = 0.143, p=0.124)
Yes for males
(Correlation = 0.467)
(p=0.044)
No for the group as a whole
(Correlation = -0.19, p=0.661)
No for males or females
Gender Yes (t=-2.930, df=115, p=0.004) Yes (t=-5.380, df=536, p=0.000)
Previous degree results Yes
(Correlation = 0.296, p=0.001)
Yes
(Correlation = 0.127, p=0.003)
Previous degree subject area
• Arts & Humanities
• Business
• Tech/Eng/IT
• Science & Healthcare
• Hybrid
No statistically significant differences
between any of the groups.
(f=1.661, df=4, p=0.164)
No statistically significant differences
between any of the groups.
(f=1.698, df=4, p=0.149)
Comparisons with pilot
18. Predicting Performance by Profile
Discussion: Age
• Heinz (2008)
– ‘One of the benefits of consecutive teacher education programmes is
that they allow later entry of students who might decide on a
teaching career at a more mature age’ (p229). Belief that the
maturity and experience that come with age can be an advantage to
aspiring teachers.
• Eifler & Potthoff (1998)
– More mature students have had a chance to acquire skills that are of
great value in the classroom, e.g. flexibility, ability to cope with
change.
• Coolohan (2003, p344)
– ‘Mature students are seen by many teacher educators as an
enrichment to the student teacher body’ (p344).
19. Predicting Performance by Profile
Discussion: Gender
• Concern about feminisation of teaching and linkage to
underperformance of boys in the educational system (Drudy,
2006) .
• Relationship between TP result and gender mirrors findings by
Coady, while Drudy (2006) has found that ‘males were much less
likely than females to graduate with honours from initial teacher
education’.
• Avenues to explore:
– Difference in teaching ability for males or females?
– Factors relating to the way TP is scored
– Difference in first degree grades on entry?
Pass 2.2 2.1 1st TOTAL
Male 28 49 45 6 128
% 22% 38% 35% 5% 100%
Female 52 170 168 19 409
% 13% 42% 41% 5% 100%
20. Predicting Performance by Profile
Discussion: Degree grade
• Mixed findings in the literature with regard to
relationship between academic performance and
teaching ability.
• Greaney et al (1999) found significant relationships
between performance in TP and attainment in the
Education Studies component of a B.Ed course and
with the level of degree obtained by the B.Ed students
on graduation.
21. Predicting Performance by Profile
Discussion: Degree category
• Coady
– Students with a background in ‘practical subjects’ may be at a
disadvantage in an ITE course as they would ‘have had less exposure
to a strong, traditional literary-based education’. This may ‘limit their
ability to engage with the teacher education programme as
compared with their peers’ (2010, p285).
– This was not borne out in relation to the current study. In fact, the
highest mean scores in TP were achieved by those whose primary
degrees were categorised as ‘Science and Healthcare’.
22. Predicting Performance by Profile
Further avenues
• Gender component
• Relationship between TP score and subsequent rating
as a teacher.
23. Predicting Performance by Profile
Reference List
• Casey, C.E. & Childs, R.A. 2007, "Teacher education program admission criteria and
what beginning teachers need to know to be successful teachers", Canadian Journal of
Educational Administration and Policy, vol. 67, pp. 1-24.Coady, L. 2010, Becoming a
Teacher: Students’ Experiences and Perceptions of their Initial Teacher Education,
Unpublished PhD
• Coolahan, J. 2003, "Attracting, developing and retaining effective teachers: Country
background report for Ireland", Dublin: Department of Education and Science.
• Drudy, S. 2006, "Gender differences in entrance patterns and awards in initial teacher
education", Irish Educational Studies, vol. 25, no. 3, pp. 259-273.
• Eifler, K. & Potthoff, D.E. 1998, "Nontraditional Teacher Education Students: A
Synthesis of the Literature.", Journal of Teacher Education, vol. 49, no. 3, pp. 187-195.
• Greaney, V., Burke, A. & McCann, J. 1999, "Predictors of Performance in Primary-
School Teaching", The Irish Journal of Education/Iris Eireannach an Oideachais, pp.
22-37
• Heinz, M. 2008, "The composition of applicants and entrants to teacher education
programmes in Ireland: trends and patterns", Irish Educational Studies, vol. 27, no. 3,
pp. 223-240.
• Nolan, J. & Killeavy, M., 2000, "The Higher Diploma in Education: An NUI perspective",
Towards 2010, pp. 7-29.