


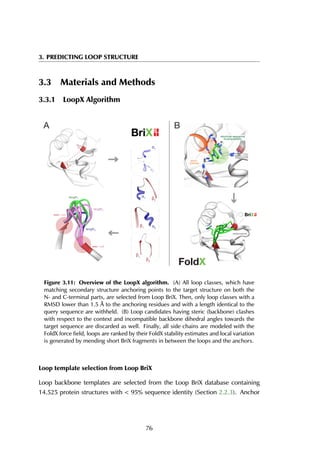
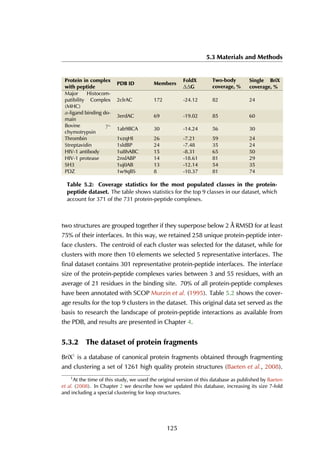
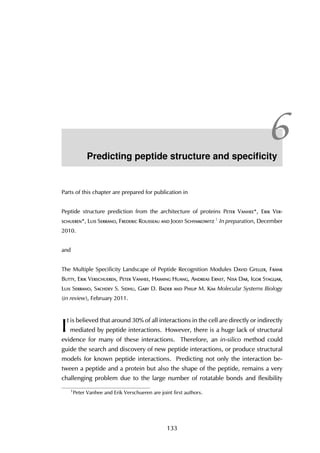
![3.3 Materials and Methods
groups (2 residues, one loop and one non-loop residue) are chosen and fitted with
all Loop BriX super classes by superposition on the super class centroids. To speed
up this calculation, only loop super classes that have the same secondary structure
residues embracing the loop are considered. A super class is accepted as donor
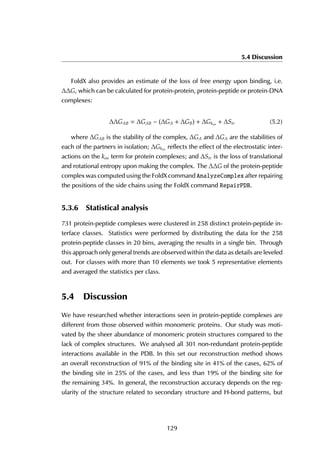
of candidate loops when the RMSD of the backbone atoms (N, Cα, C, O) between
the four anchor residues of its centroid and the target loop after superposition is
< 1.5 Å.
Because predicting coverage and accuracy is strongly dependent on the choice
of anchor residues flanking the loop, and DSSP annotations highly depend from the
structural context, we have added an additional protocol optimization step in which
slightly alternative loop boundaries are set and evaluated. This is accomplished by
setting a new start residue upstream and a new end residue downstream, totaling
in nine combinations of start and end residues per loop. The alternative loop with
the best FoldX energy is then taken as the actual prediction.
Filters
PDB identifier filter PDB structures that have the same PDB four-letter identifier
as the PDB of the target loop are discarded.
Backbone entropy filter Loop candidates originate from different proteins. It
is therefore probable that the amino acid sequence of the candidate loop differs
from the amino acid sequence of the target loop. Consequently, it is required
to determine the propensity of the target amino acid sequence to adopt the φ/ψ
main chain dihedral conformation of the candidate loop. The FoldX force field
is consulted to retrieve the unscaled entropy cost for each φ/ψ pair within the
candidate loop structure for the respective amino acid in the target sequence. This
unscaled entropy cost corresponds with the statistical preference of a residue to
occur in a certain [φ, ψ] region within the Ramachandran plot.
Backbone ω filter The dihedral angle ω measured over the peptide bond is
checked as well. In general, only ω angles with absolute values in the interval
[155;180] are allowed. However, if the target amino acid is one of the structure
breakers – PRO or GLY – a cis conformation can be present. In this case the heavy
77](https://image.slidesharecdn.com/phdthesisfreeuniversityofbrussels2011vanhee-190408213007/85/Predicting-peptide-interactions-using-protein-building-blocks-95-320.jpg)
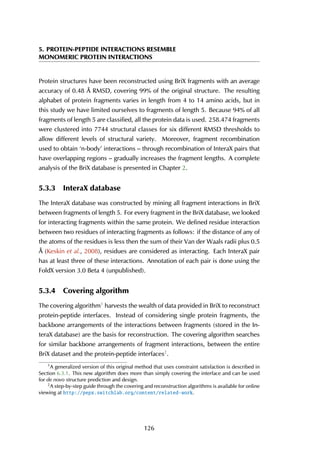
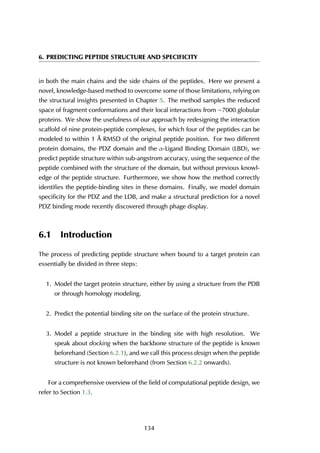
![3. PREDICTING LOOP STRUCTURE
atoms N and O are on the same side of the double bond, causing the chain to
bend, and ω angles having an absolute value in the interval [0;25] are allowed as
well.
Steric clash filter The conformational fit of the loop is evaluated within the target
environment using a steric clash filter that checks for van der Waals clashes along
the main chain atoms (N, Cα, C, O). Loop candidates causing steric clashes with
neighbouring residues are discarded.
Sequence Homology filter Using homolog structures to reconstruct loops might
improve reconstruction results. Loop reconstruction algorithms that rely on
database searches can be at an advantage compared to ab initio methods when the
structure of a sequence homolog is available. On the other hand, when no such
homolog is available the accuracy might decrease rapidly. In order to evaluate
the effect of sequence homology, a sequence homology filter was implemented.
Sequence homology of the target loop is compared with the BriX loop. If sequence
homology is >= 100%, 85%, 50% or 35% (as indicated), the loop is discarded.
Loop placement
The backbone atoms of the N- and C-anchor residues of the side chain-reconstructed
candidate loops are superposed on the equivalent backbone atoms of the N- and
C-anchor residues of the input structure.
Sidechain design using FoldX
As a general rule, filters accept only 1-5 % of the initial loop candidates. From
this set, all side chains are designed with the target loop sequence extracted from
the crystallographic loop. Importantly, no side chain orientations from the BriX
loop nor the crystallographic loop are used. Sidechains are rebuilt using the
FoldX command BuildModel (Schymkowitz et al., 2005). BuildModel uses a
backbone-dependent rotamer library to determine the most probable side chain
conformation. At every mutation step, the algorithm rearranges neighbouring
residues, resulting in a local minimum of the sequence.
78](https://image.slidesharecdn.com/phdthesisfreeuniversityofbrussels2011vanhee-190408213007/85/Predicting-peptide-interactions-using-protein-building-blocks-96-320.jpg)

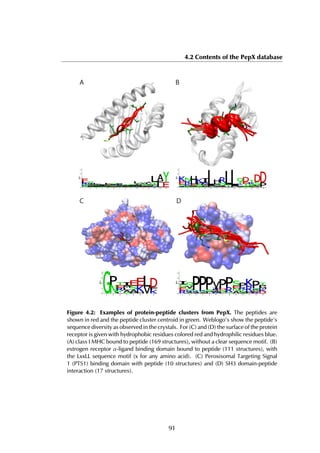
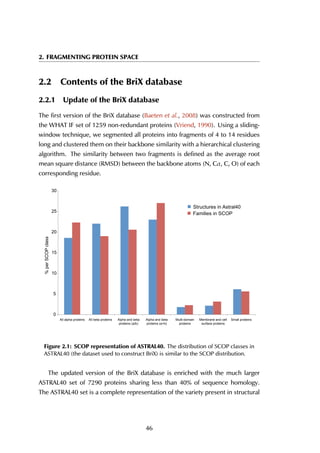
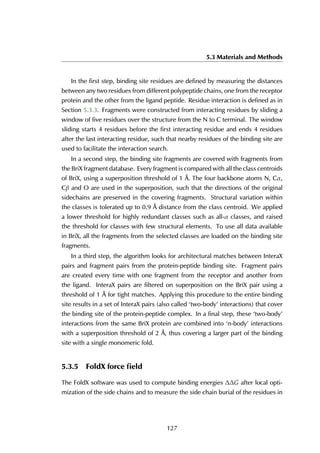
![4.2 Contents of the PepX database
4.2.2 Statistics on structural protein-peptide complexes
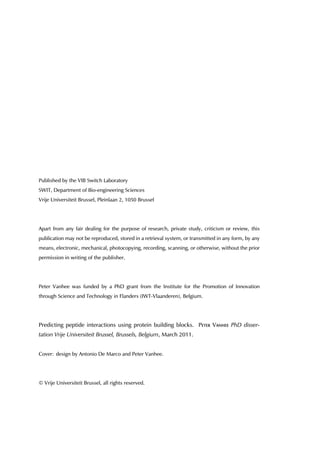
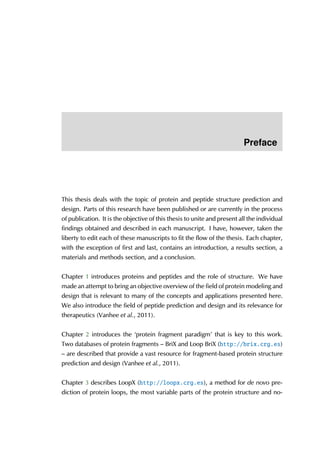
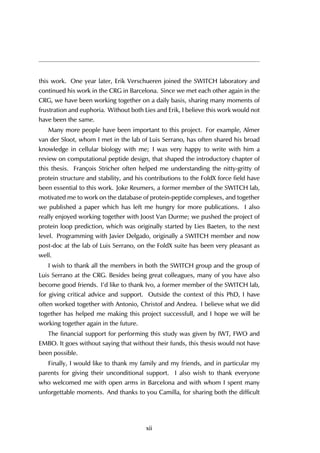
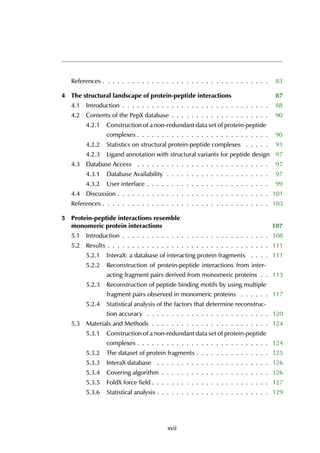
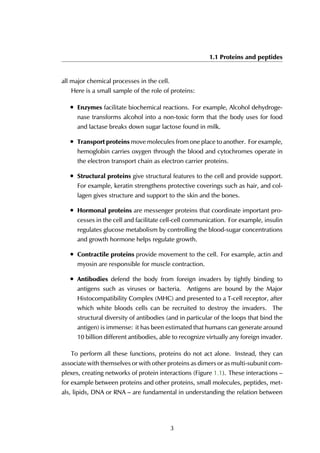
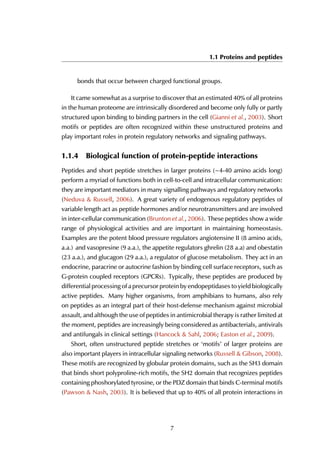
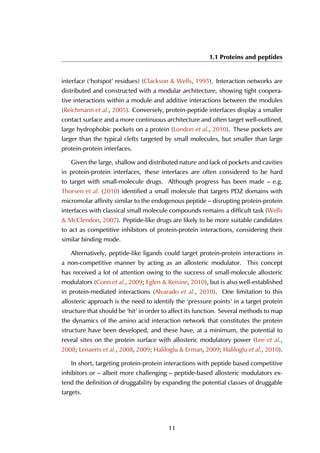
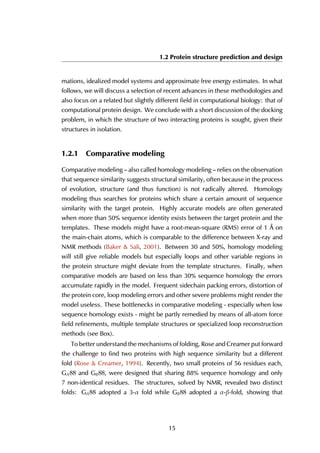
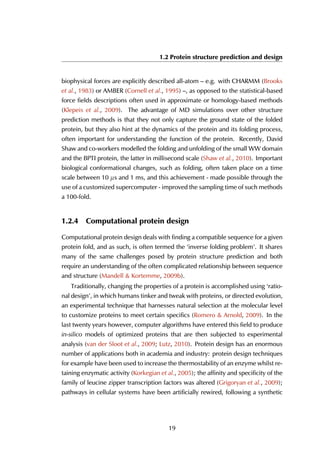
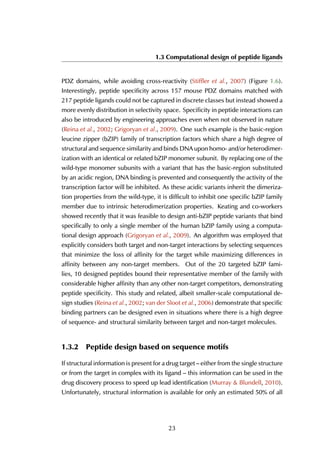
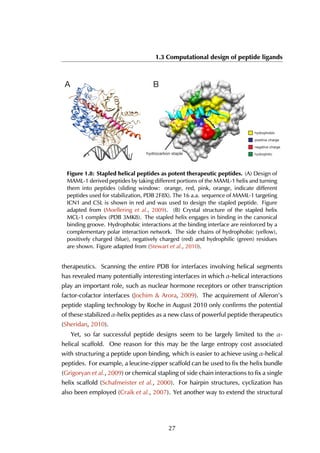
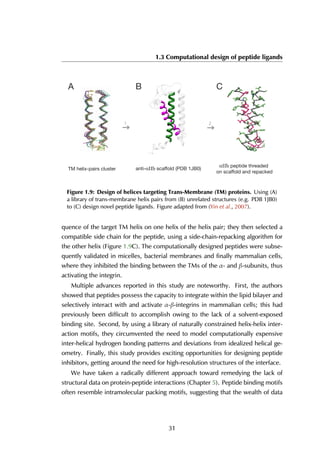
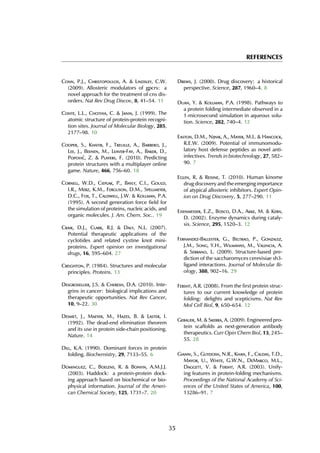
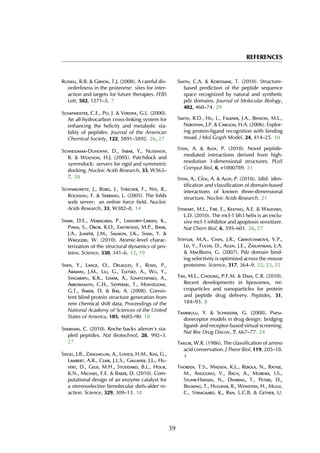
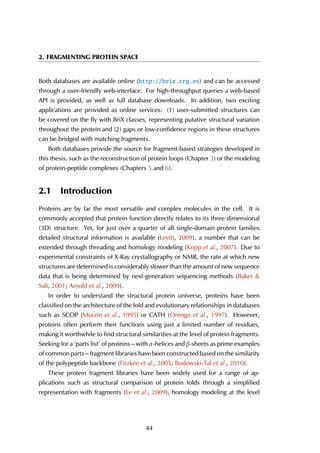
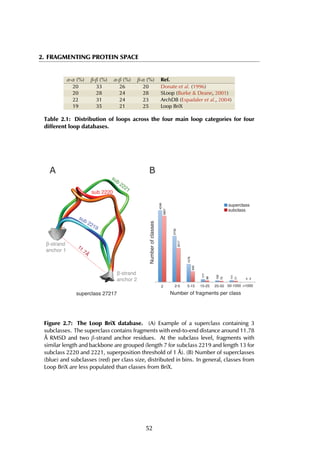
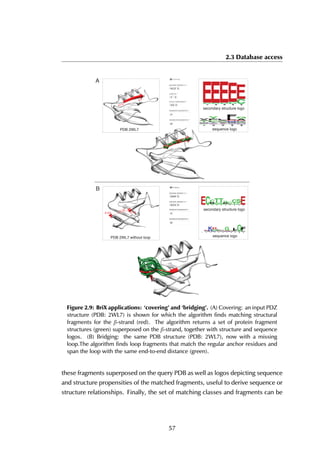
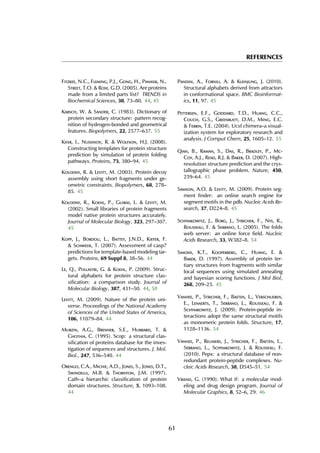
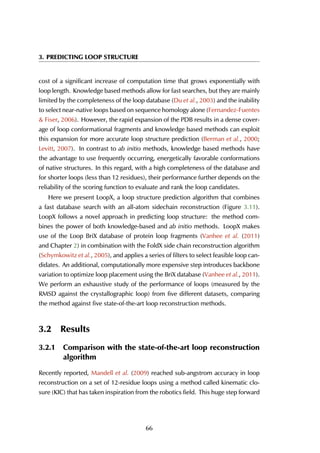
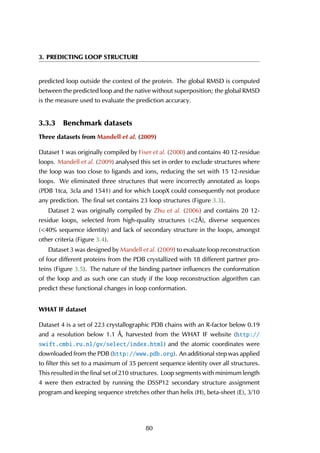
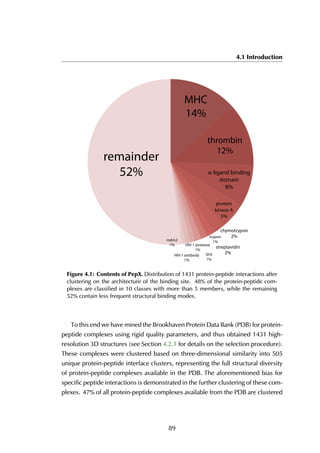
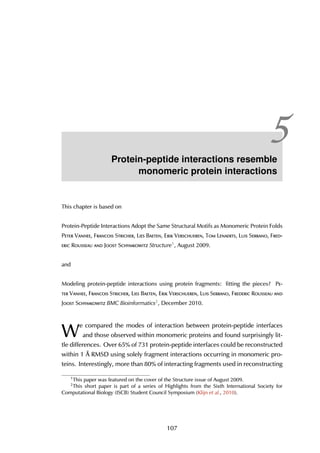
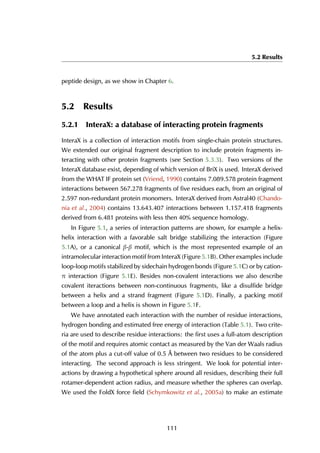
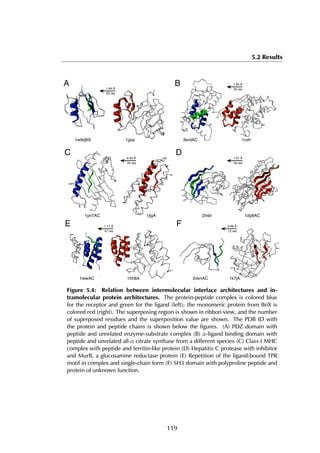
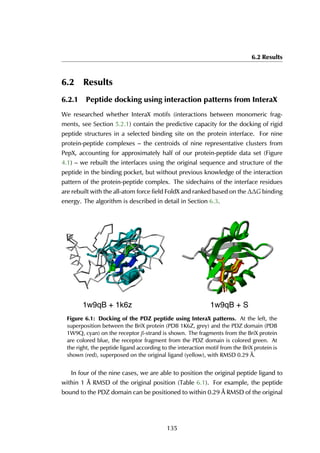
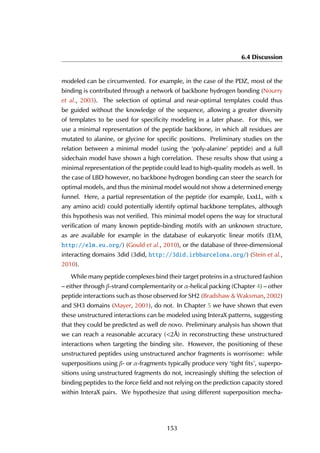
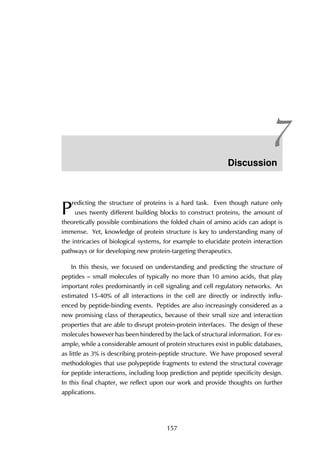
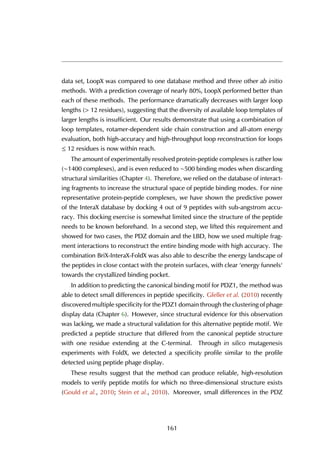
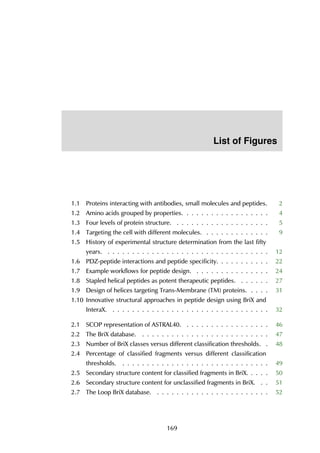
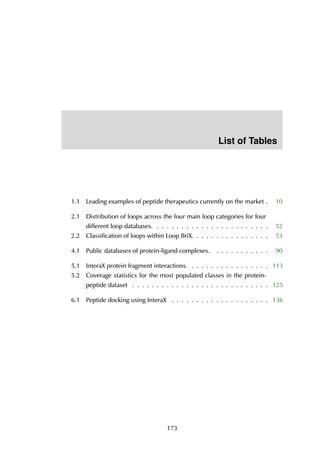
The upper threshold for the peptide length was set to 35 amino acids, but the
majority of the peptides are between 5 and 15 residues long, with a peak at 9
residues (Figure 4.4A). The size of receptors varies between 67 and 2552 residues,
and the largest fraction lies in the [200-400] range (Figure 4.4B).
6
5
5
7
15
10
8
4
4
2
3
3
1
1
1
6
1
1
1
1
1
2
3
3
2
1
1
1
1
1
1
0
2
4
6
8
10
12
14
16
5 10 15 20 25 30 35
%ofligands
Ligand length
9
19
47
13
7
1
1
2
0
0
0
0
10
20
30
40
50
100 200 300 400 500 600 700 800 900 1000 more
%ofreceptors
Receptor length
A B
Figure 4.4: Distribution of peptide and receptor size. (A) The smallest peptide
considered is 5 amino acids long, the longest consists of 35 residues. Circa 70% of all
peptides lies within the [5-15] residue range. (B) The largest protein in the complexes
contains 2552 amino acid residues; the shortest considered is 35 residues long. Most
proteins are smaller than 600 residues, with a peak in the [200-400] range.
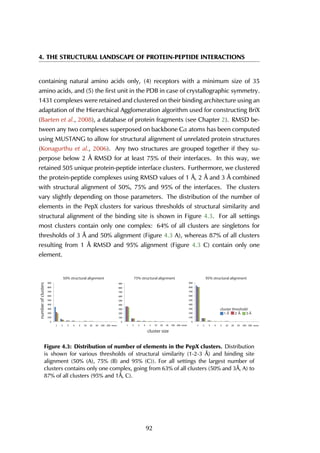
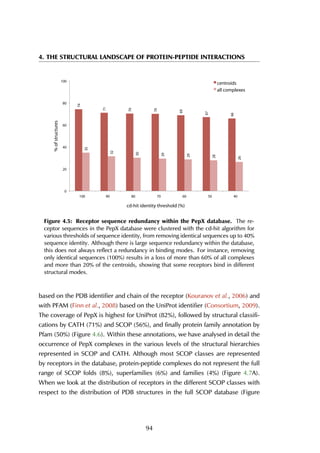
The receptor sequences in the PepX database were clustered with the cd-hit
algorithm (Li & Godzik, 2006) for various thresholds, resulting in datasets where
sequences with 40-100% sequence identity are removed (Figure 4.5). Although
there is large sequence redundancy within the database (removing sequences
with more than 40% sequence identity results in removing more than 70% of all
complexes in the database), this does not always reflect a redundancy in binding
modes. For instance, Major Histocompatibility Complexes have high sequence
identity but bind a wide range of peptides in different modes (Collins et al., 1994;
Elliott & Neefjes, 2006). Preliminary analysis of the sequence redundancy in
the full complex dataset versus the dataset with cluster centroids revealed that
using geometric properties for clustering removes most sequence identity without
discarding relevant structural binding motifs.
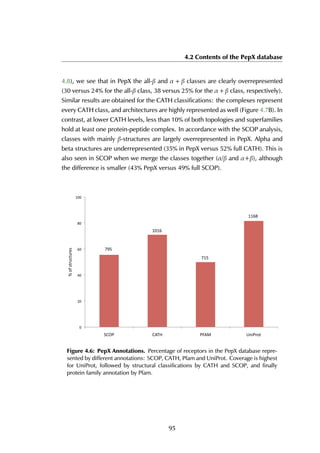
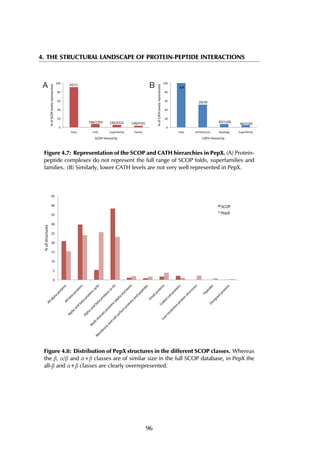
All receptors in protein-peptide complexes have been annotated with the struc-
tural classifications SCOP (Andreeva et al., 2008) and CATH (Cuff et al., 2009)
93](https://image.slidesharecdn.com/phdthesisfreeuniversityofbrussels2011vanhee-190408213007/85/Predicting-peptide-interactions-using-protein-building-blocks-111-320.jpg)

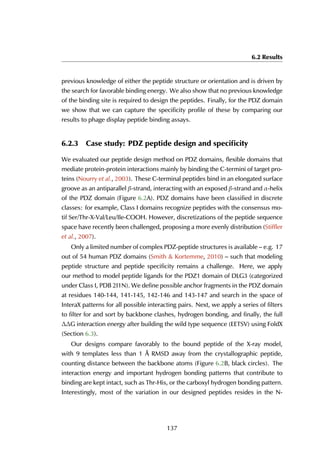
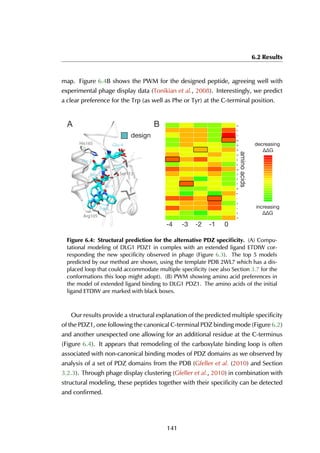
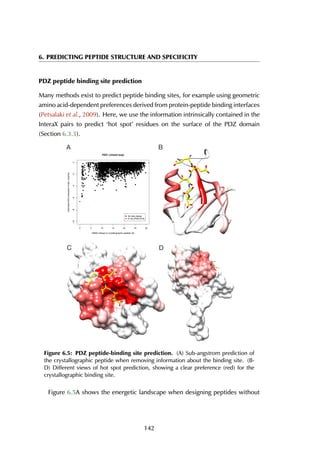
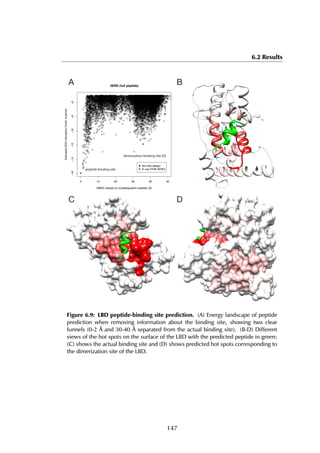
![6.2 Results
previous knowledge of the binding site, showing a clear energy funnel in the [0-2]Å
range, providing evidence for a single peptide binding pocket in PDZ domain as
is generally accepted (Nourry et al., 2003). This example illustrates the use of our
method for the prediction of peptide-binding sites.
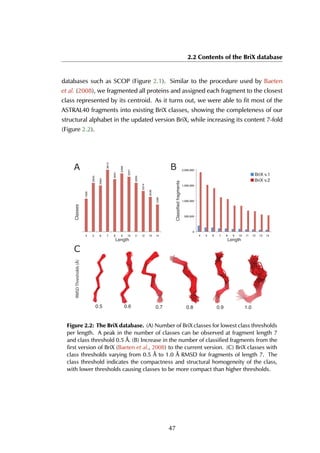
6.2.4 Case study: helical peptide design for the estrogen recep-
tor ligand-binding domain
Helical peptides are important building blocks of a protein’s structure, but are
also often encountered in protein-protein interfaces (Jochim & Arora, 2009). In
one such case, that of the estrogen receptor (ER), interactions between helical
protein segments play an important role in the estrogen signaling pathway. The
estrogen receptor is a transcription factor that is responsible for estrogen signaling
and regulates a number of important hormone-dependent processes in the cell
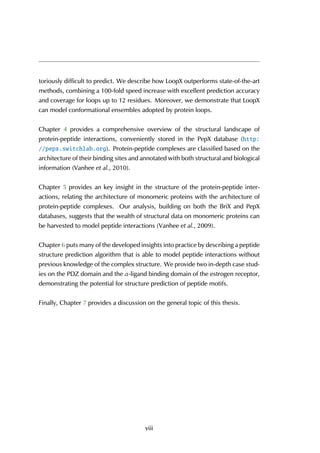
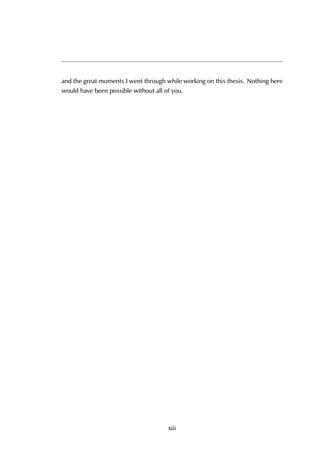
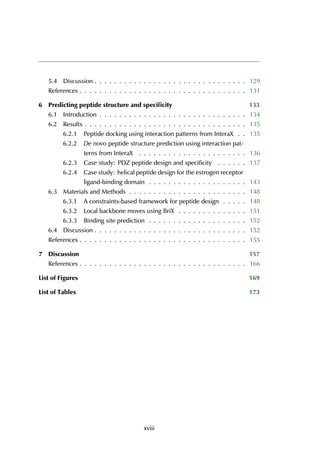
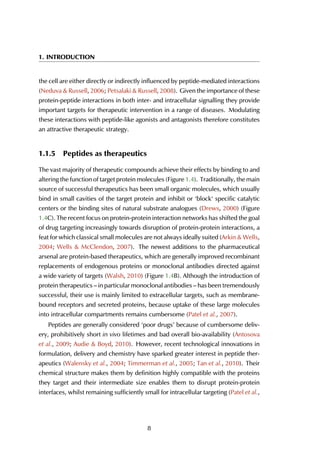
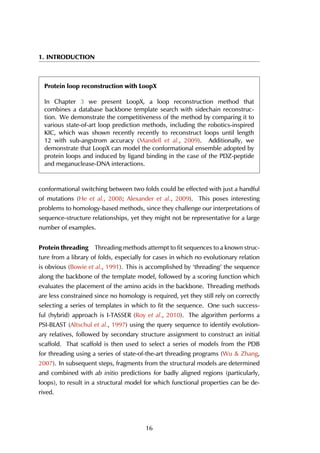
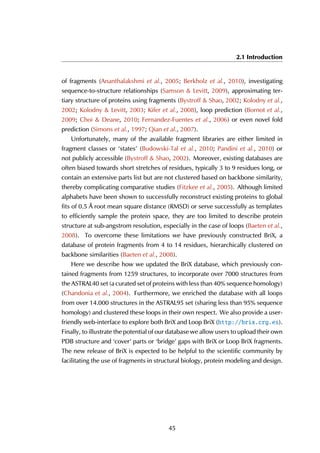
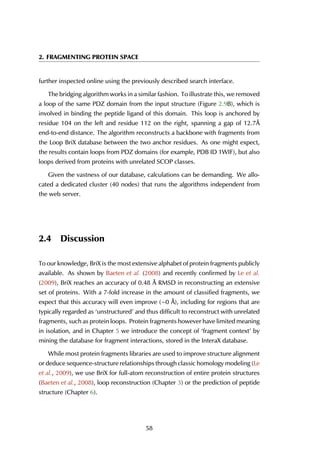
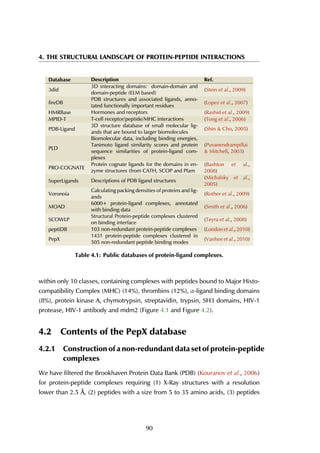
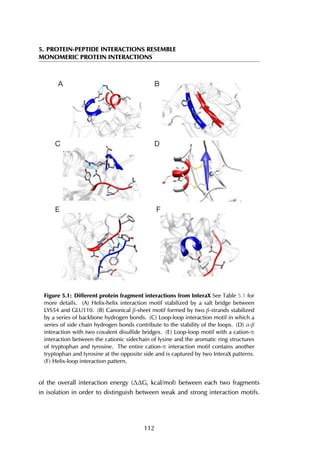
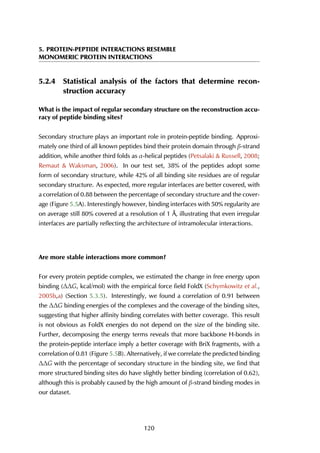
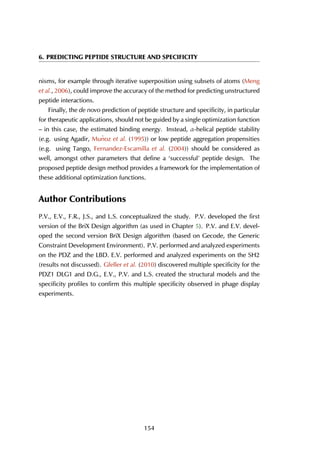
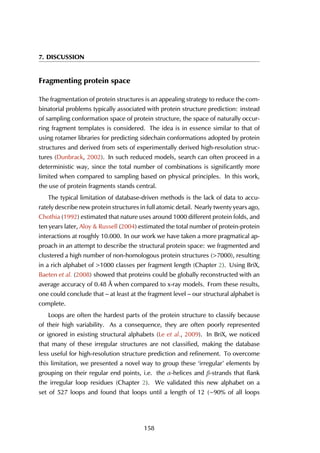
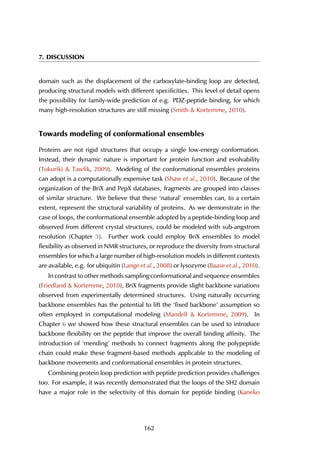
(Heldring et al., 2007). ER contains an evolutionary conserved ligand-binding
domain (LBD) that, after agonist activity induced by estrogen, binds leucine-rich
peptides (LxxLL, with x any amino acid) in a hydrophobic pocket formed by the
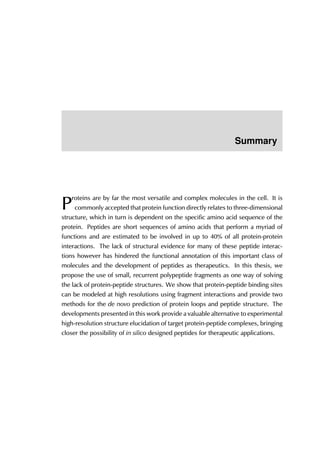
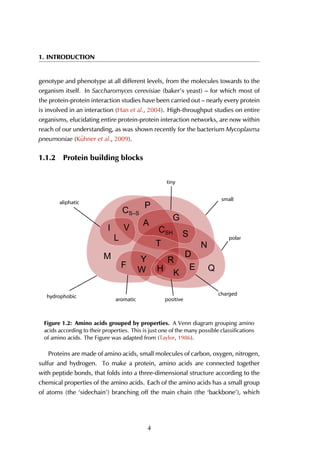
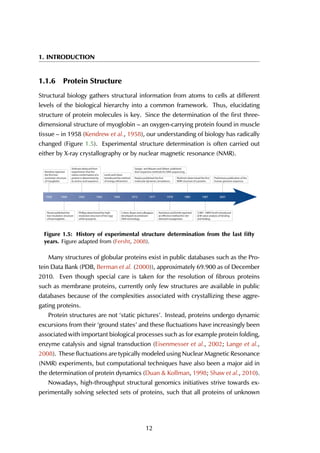
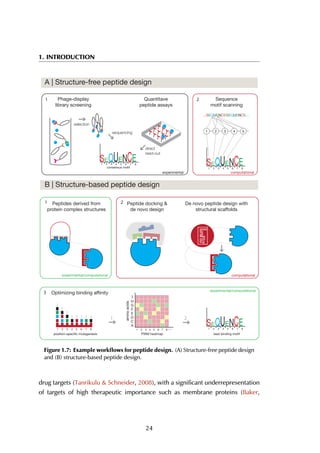
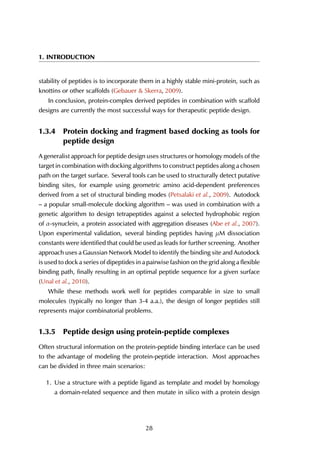
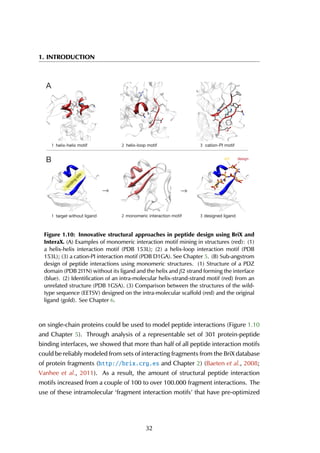
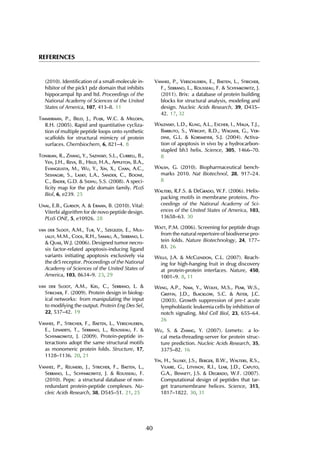
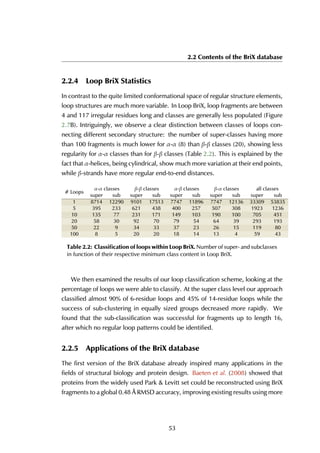
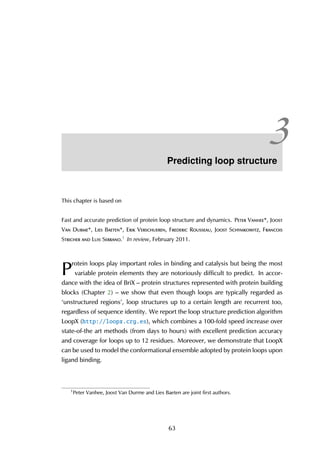
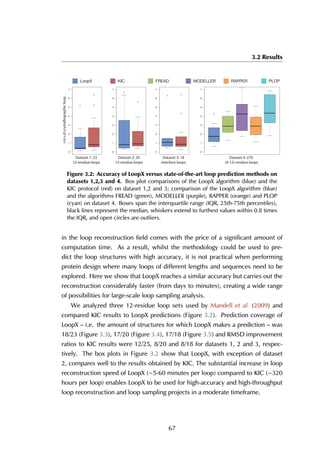
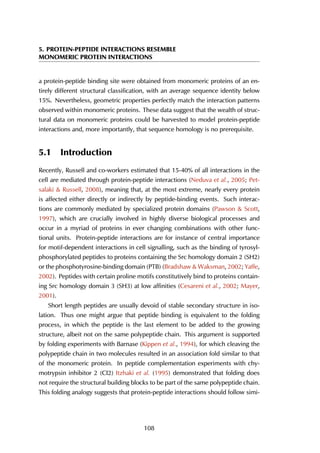
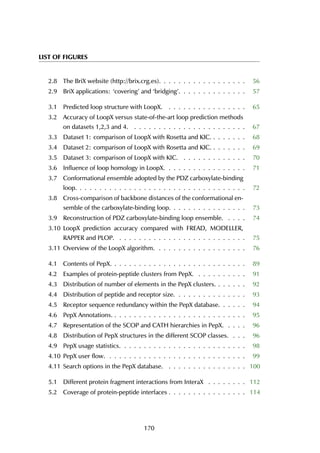
helices H3, H5 and H12 (Figure 6.6A). In absence of an agonist, LBD binds its
own C-terminal tail (H12), that has a similar leucine-rich signature. Finally, when
LBD binds an antagonist, e.g. Tamoxifen or Fulvestrant (Heldring et al., 2007), the
binding pocket is partially or completely deformed, no peptides can bind anymore
and the estrogen signaling pathway is blocked.
Here, we aim at the design of a peptide that blocks the hydrophobic pocket
formed by H3, H5 and H12. Unlike with PDZ peptide design (Section 6.2.3),
we take a ‘multi-body’ approach. We look for BriX fragments that simultaneously
interact with fragments from H3, H5 and H12, as defined by InteraX (Section
6.3.1). The advantage is that peptides will be optimized for binding the entire
interface and not just a single fragment at a time, as they will be constrained to
interact simultaneously with H3, H5 and H15. We use the sequence signature
of the peptide (LHRLL) and the structure of the unbound LBD from PDB 3ERD
(Shiau et al., 1998). We note that while it is relatively easy to position a β-strand
owing to the constrained backbone hydrogen bonding patterns (as in the case
of PDZ), the α-α interactions are much less constrained because they lack any
143](https://image.slidesharecdn.com/phdthesisfreeuniversityofbrussels2011vanhee-190408213007/85/Predicting-peptide-interactions-using-protein-building-blocks-161-320.jpg)
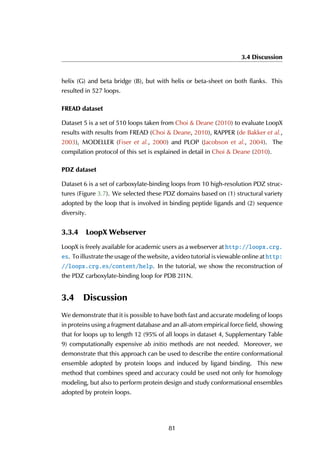
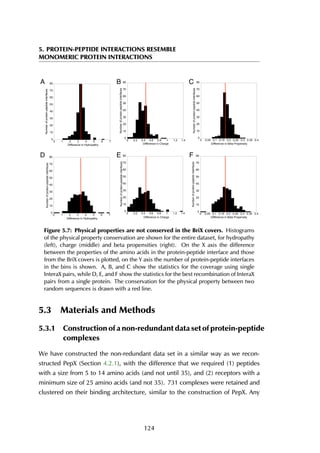
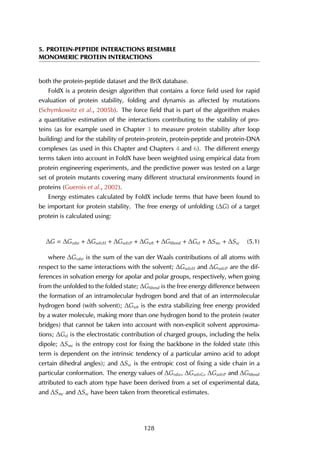
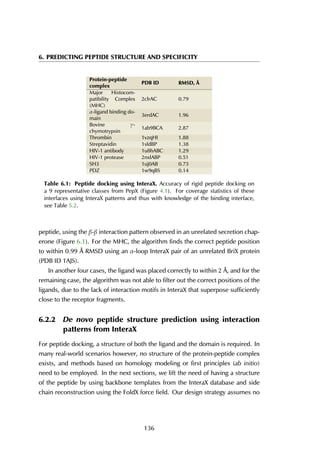
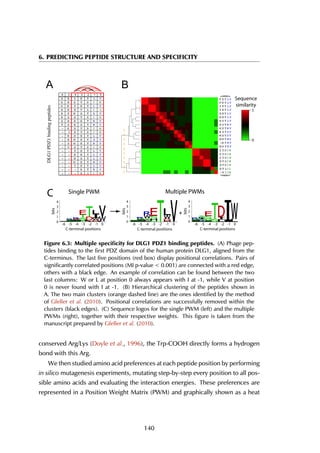
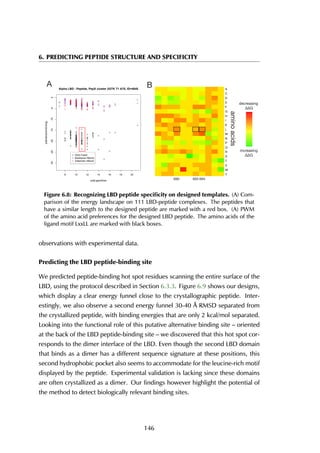
![6. PREDICTING PEPTIDE STRUCTURE AND SPECIFICITY
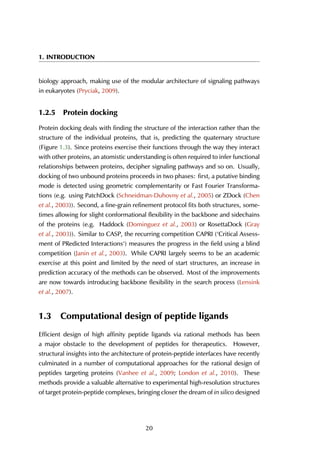
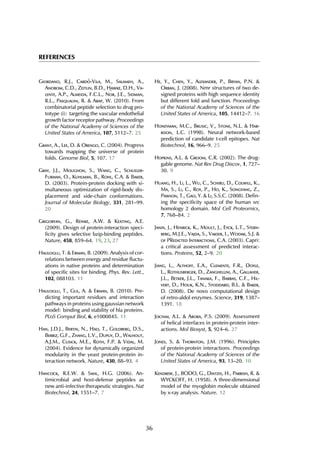
Helix 3
Helix 5
Helix 12
A B
Figure 6.6: Estrogen receptor α-LBD binding site. The binding site of the LBD is
formed by three helices (A) that together create a hydrophobic groove accommodating
the peptide (B). The residue stretches that are used as the anchor fragments in the
design are shown in purple, red and green.
backbone hydrogen bonds and most of the free energy is contributed through
hydrophobic packing. Therefore we rely on a combination of (1) multi-body
fragment interaction optimization using InteraX, (2) backbone clash filters and (3)
total interaction energy measured by FoldX after building full-flexible side chains
on the peptide. Furthermore, while the original peptide ligand from the crystal
structure contains 11 residues, we limit our design to a fragment of 5 residues,
which accurately captures the LxxLL pattern, and superpose the helical structure
of the 3ERD peptide on the designed peptide to extend it to 11 residues.
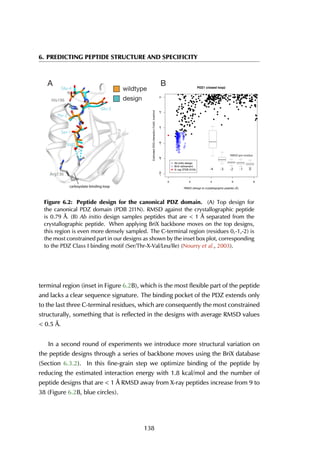
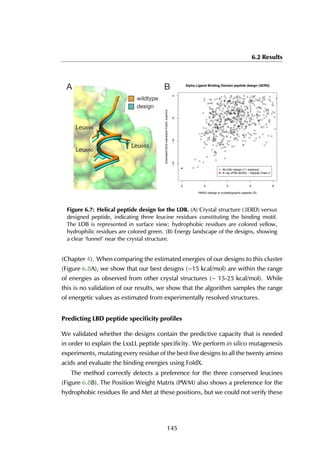
Figure 6.7A shows the designed structure when compared with the crystal
structure (RMSD = 1.05 Å). There is only slight variation on the three conserved
leucine residues that constitute most of the binding energy within the hydrophobic
binding pocket (colored in yellow). The energy landscape of 4052 models reveals a
clear ‘energy funnel‘ towards designs close to the crystallographic peptide (Figure
6.7B). The best designs are within [0-1]Å RMSD (1 design), [1-1.5]Å (2 designs)
and [1.5-2.0] Å (13 designs). We also evaluated the energies of different 11-
residue LBD-binding peptides distilled from the protein-peptide database PepX
144](https://image.slidesharecdn.com/phdthesisfreeuniversityofbrussels2011vanhee-190408213007/85/Predicting-peptide-interactions-using-protein-building-blocks-162-320.jpg)


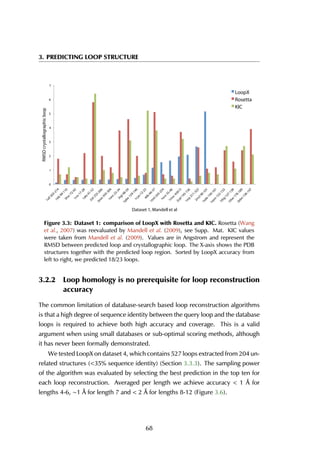
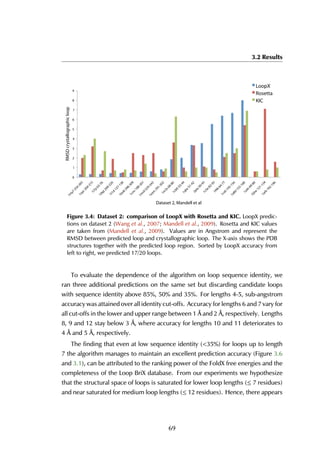
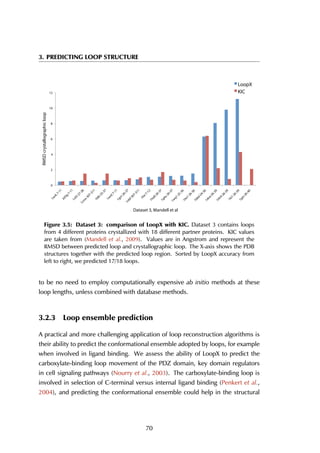
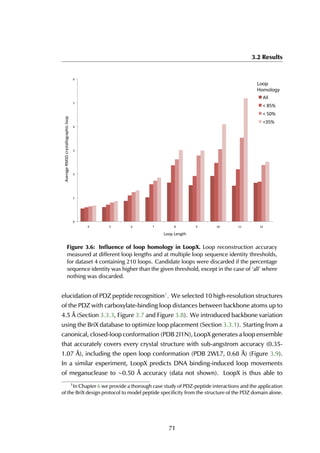
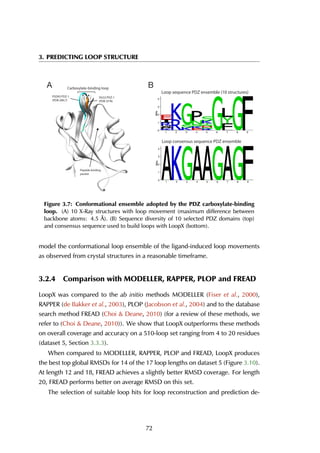
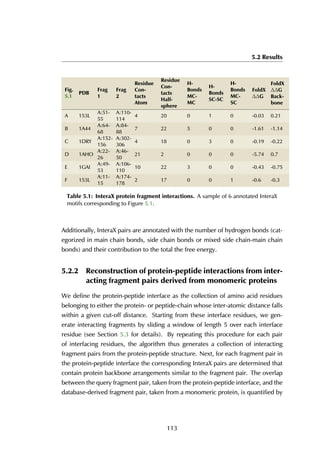
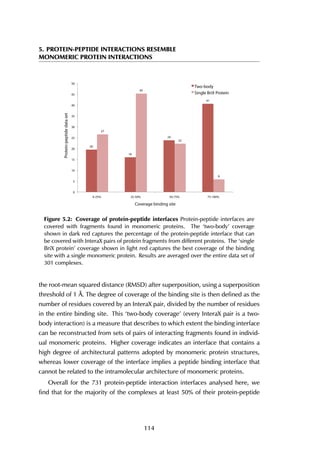
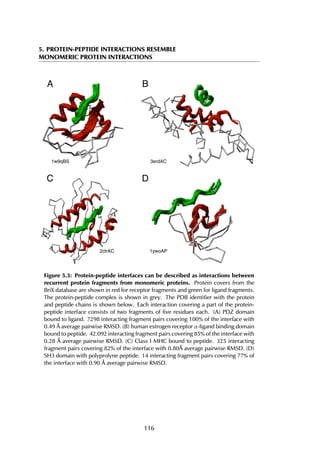
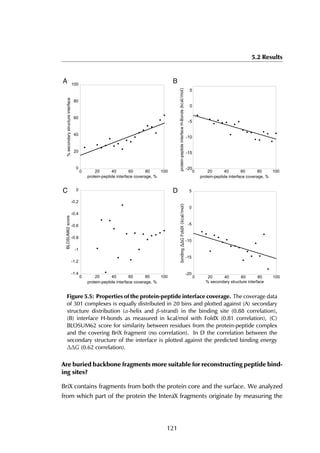
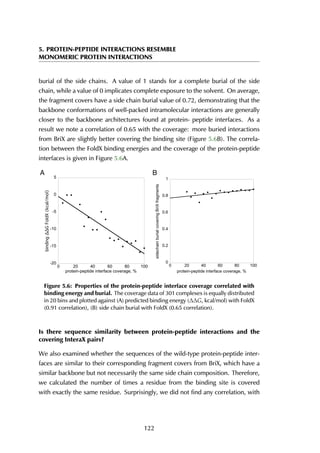
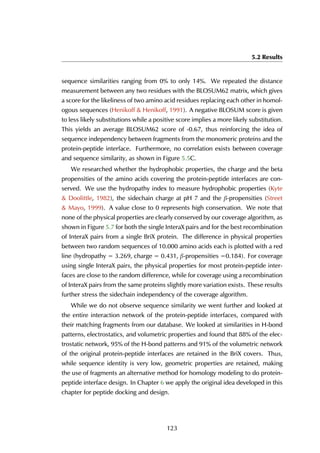
This thesis by Peter Vanhee discusses predicting peptide interactions using protein building blocks as a method to address the lack of structural data for these interactions. It demonstrates the use of small polypeptide fragments in modeling binding sites and presents novel algorithms for predicting protein loop and peptide structures. The findings aim to facilitate the therapeutic application of peptides by providing alternatives to traditional experimental structure elucidation.