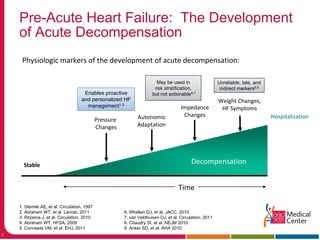
Acute Heart Failure Essentials:
Pre- and Post-Discharge Management
William T. Abraham, MD, FACP, FACC, FAHA, FESC
Professor of Medicine, Physiology, and Cell Biology
Chair of Excellence in Cardiovascular Medicine
Director, Division of Cardiovascular Medicine
Associate Dean for Clinical Research
Director, Clinical Trials Management Office
Deputy Director, Davis Heart & Lung Research Institute
The Ohio State University
Division of Cardiovascular Medicine
2
3
Four Clinical States of Heart Failure
Time
Stable
1
Stable
1
Pre-Acute
Heart Failure
2
Acute
Heart Failure
(Hospitalization)
3
Post-Acute
Heart Failure
4
Days to Weeks
4
Pre-Acute Heart Failure: Opportunity to
Prevent Hospitalization
Time
Pre-Acute
Heart Failure
2
Days to Weeks
How Do We Prevent Heart Failure Hospitalizations?
Maintain Optimal Fluid / Pressure Status
Too “Wet” (High Pressures)
Increased symptoms, increased risk of
hospitalization, increased risk of
arrhythmias, increased mortality
“Just Right” (Normal Pressures)
Feel well, low risk for hospitalization or
death
Too “Dry” (Low Pressures)
Hypotension, dizziness, risk of syncope,
worsening kidney function
6
Pre-Acute Heart Failure: The Development
of Acute Decompensation
Physiologic markers of the development of acute decompensation:
Pressure
Changes
Impedance
Changes
Weight Changes,
HF Symptoms
Hospitalization
Time
Stable
Decompensation
Autonomic
Adaptation
7
Pre-Acute Heart Failure: The Development
of Acute Decompensation
Physiologic markers of the development of acute decompensation:
Pressure
Changes
Impedance
Changes
Weight Changes,
HF Symptoms
Hospitalization
Time
Stable
Decompensation
Autonomic
Adaptation
Unreliable, late, and
indirect markers8,9
May be used in
risk stratification,
but not actionable4-7Enables proactive
and personalized HF
management1-3
1. Steimle AE, et al. Circulation, 1997
2. Abraham WT, et al. Lancet, 2011
3. Ritzema J, et al. Circulation, 2010
4. Abraham WT, HFSA, 2009
5. Conraads VM, et al. EHJ, 2011
6. Whellan DJ, et al. JACC, 2010
7. van Veldhuisen DJ, et al. Circulation, 2011
8. Chaudry SI, et al. NEJM 2010
9. Anker SD, et al. AHA 2010
The Pulmonary Artery Pressure
Measurement System*
Catheter-based delivery system
*FDA approved May 28, 2014
MEMS-based pressure sensor
Home electronics PA Measurement database
9
CHAMPION:  CardioMEMS Heart Sensor Allows Monitoring of
Pressure to Improve Outcomes in NYHA Class III Heart Failure
Patients
550 Pts
w/ CM Implants
All Pts Take Daily
Readings
Treatment
270 Pts
Management Based on
Hemodynamics + Traditional Info
Control
280 Pts
Management Based on
Traditional Info
Primary Endpoint: HF Hospitalizations at 6 Months
Additional Analysis: HF Hospitalizations at All Days (~15 M mean F/U)
Multiple Secondary Endpoints
§ Trial Designed by
Steering Committee with
active FDA input
§ Prospective, multi-center,
randomized, controlled
single-blind clinical trial
§ All subjects followed in
their randomized single-
blind study assignment
until the last patient
reached 6 months of
follow-up
§ 64 US Centers
§ PIs: William Abraham,
Phil Adamson
Abraham WT, et al. Lancet 2011
10
Hypothesis of the CHAMPION Trial
Medications should be adjusted based on
pulmonary artery pressures
unless contraindicated by clinical status of patient
In addition to basing treatment
on signs and symptoms
Heart failure
hospitalizations
CHAMPION Clinical Trial: Managing to
Target PA Pressures
550 Pts w/CMEMS Implants
All Pts Take Daily readings
Treatment
270 Pts
Management Based on 
PA Pressure +Traditional Info
Control
280 Pts
Management Based on 
Traditional Info
ther
Primary Endpoint: rate of HF Hospitalization
26 (
Secondary Endpoints included:
§ Change in PA Pressure at 6 months
§ No. of patients admitted to hospital for HF
§ Days alive outside of hospital
§ QOL
PA pressures were managed to target goal 
pressures by physicians with appropriate 
titration of HF medications.
Target Goal PA Pressures:
§ PA Pressure Systolic 15 – 35 mmHg
§ PA Pressure diastolic 8 – 20 mmHg
§ PA Pressure mean 10 – 25 mmHg
Adamson PB, et al., J Card Fail 2011
Abraham WT, et al., Lancet 2011
Treatment Recommendations 
for Elevated PA Pressures
• Add or increase diuretic
– increase/add loop diuretic
– change loop diuretic
– add thiazide diuretic
– IV loop diuretic
• Add or increase vasodilator
– add or increase nitrate
Cumulative HF Hospitalizations Reduced
At 6 Months and Full Duration of Randomized Study
0
20
40
60
80
100
120
140
160
180
200
220
240
260
280
Days from Implant
0 90 180 270 360 450 540 630 720 810 900
270 262 244 210 169 131 108 82 29 5 1
280 267 252 215 179 137 105 67 25 10 0
No. at Risk
Treatment
Control
Treatment (158 HF Hospitalizations)
Control (254 HF Hospitalizations)
Study Duration
37% RRR, p < 0.0001
≤ 6 Months
28% RRR,
p = 0.0002
> 6 Months
45% RRR,
p < 0.0001
Reduction in Hospitalizations Over Full
Duration of Randomized Study
Treatment
(n=270)
Control
(n=280)
Absolute 
Reduction
Relative 
Reduction p-value
HR (CI)
Heart Failure
Hospitalizations
182 279 97
0.67
(0.55 – 0.80)
<0.0001
Death or
Heart Failure
Hospitalizations
232 343 111 0.69
(0.59 – 0.82)
<0.0001
Results from Andersen Gill model
Hazard Ratio (HR) and 95% Confidence Interval (CI)
All Cause
Hospitalizations
554 672 118
0.84
(0.75 – 0.95)
0.0032
Death or All
Cause
Hospitalizations
604 736 132
0.84
(0.76 – 0.94)
0.0017
Ejection Fraction 
Randomization 
Group
Number of
Heart Failure 
Hospitalizations
Annualized Rate of 
Hospitalization for 
Heart Failure
Hazard Ratio
(95% CI)
[p-value]
≥40%
Treatment Group
(n=62)
29 0.43 0.50
(0.35-0.70)
[p<0.0001]
Control Group
(n=57)
59 0.86
≥50% 
Treatment Group
(n=35)
13 0.41 0.30
(0.18-0.48)
[p<0.0001]
Control Group
(n=31)
31 1.39
<40%
Treatment Group
(n=208)
153 0.67 0.74
(0.63-0.89)
[p=0.0010]
Control Group
(n=222)
220 0.90
PA Pressure-Guided Therapy Benefits
Patients with Common HF Comorbidities
Comorbidity N size (control) N size (treatment)
HF Hospitalization rate 
reduction at 15 months 
in treatment group
History of myocardial 
infarction1 137 134
46%
(p < 0.001 vs. control)
COPD2,3 96 91
41%
(p = 0.0009 vs. control)
Pulmonary 
hypertension4 163 151
36%
(p = 0.0002 vs. control)
AF5 135 120
41%
(p < 0.0001 vs. control)
Chronic Kidney Disease6 150 147
42%
(p = 0.0001 vs. control)
1. Strickland WL, et al. JACC 2011
2. Criner G, et al. European Respiratory Journal, 2012
3. Martinez F, et al. European Respiratory Journal, 2012
4. Benza R, et al. Journal of Cardiac Failure, 2012
5. Miller AB, et al. JACC, 2012
6. Abraham et al., HFSA 2014
Impact of PA Pressure Guided HF Management
on HF Hospitalizations in GDMT Population
0.39
0.69
HFrEF Patients on ACE/ARB and Beta Blocker Prior to
Implant
HF hospitalization rates
0
0.1
0.2
0.3
0.4
0.5
0.6
0.7
0.8
AnnualizedHFHospitalizationRate
PA Pressure Guided HF Management (Treatment Group)
Guideline Directed Standard of Care (Control Group)
43% Relative Risk Reduction
[HR 0.57, 95% CI 0.45-0.74, p<0.0001]
Number needed to treat: 3
Abraham et al. ACC 2015
Impact of PA Pressure Guided HF Management on
All-Cause Mortality in GDMT Population
57% Relative Risk Reduction
[HR 0.43, 95% CI 0.24-0.76, p=0.0026]
Number needed to treat: 7
Abraham et al. ACC 2015
18
Post-Acute Heart Failure: Opportunity to
Prevent Rehospitalization
Time
Post-Acute
Heart Failure
4
Days to Weeks
19
Post-Acute Heart Failure: Relapse Before
Recovery
More than 50% of ADHF patient discharged from the hospital are still “wet” and
do not receive adequate ongoing diuresis as outpatients1
Rehospitalization
Time
Stable
Hospitalization
1Adams KF, et al., Am Heart J 2006
117
31
18
60
13
4
HF Hospitalizations All Cause 30 Day Readmissions HF 30 Day Readmissions
0
20
40
60
80
100
120
Number of Hospitalizations
Control (Standard of Care) Treatment (PA pressure monitoring)
§ Retrospective analysis of patients 65 years or older (n = 245)
§ Compared 30-day readmissions and HF hospitalizations between
patients managed with
PA pressure vs Standard of Care
§ Results showed statistically significant reductions in readmissions and
HF hospitalizations
in treatment group
CHAMPION Clinical Trial: Substantial reduction in
30-day readmissions in Medicare-eligible patients
Adamson, et al. AHA 2014
58% reduction
p = 0.0062
78% reduction
p = 0.0027
In Medicare-eligible patients 65 years or older PA pressure monitoring with the
CardioMEMS™ HF System significantly reduced 30-day readmissions
49% reduction
p < 0.0001
21
What Else Can We Do to Prevent
Rehospitalization?
Yancy CW, et al., Circulation 2013
Accessed at http://circ.ahajournals.org/content/128/16/e240
Ohio State Post-Discharge Management
§ Nurse navigator calls patient 48 hours post-
discharge to review discharge instruction (diet,
medications) and assess how the patient is doing
§ Nurse practitioner sees the patient 7 days post-
discharge for comprehensive in-clinic assessment,
diuretic dose adjustment, and GDMT dose titration
if indicated
§ Heart failure physician sees patient 3-4 weeks
post-discharge comprehensive in-clinic
assessment, diuretic dose adjustment, and GDMT
dose titration if indicated
Other Post-Discharge Considerations
§ Many patient continue to exhibit some degree of
resistance to oral diuretics
§ May need to consider outpatient use of
intravenous (or subcutaneous?) diuretic therapy
§ May use Emergency Department Observation Unit
to treat relapsing patients, before they require
rehospitalization
§ Revaluate for precipitating causes of worsening
heart failure

Pre and post- discharge management.

  • 1.
    Acute Heart FailureEssentials: Pre- and Post-Discharge Management William T. Abraham, MD, FACP, FACC, FAHA, FESC Professor of Medicine, Physiology, and Cell Biology Chair of Excellence in Cardiovascular Medicine Director, Division of Cardiovascular Medicine Associate Dean for Clinical Research Director, Clinical Trials Management Office Deputy Director, Davis Heart & Lung Research Institute The Ohio State University Division of Cardiovascular Medicine
  • 2.
  • 3.
    3 Four Clinical Statesof Heart Failure Time Stable 1 Stable 1 Pre-Acute Heart Failure 2 Acute Heart Failure (Hospitalization) 3 Post-Acute Heart Failure 4 Days to Weeks
  • 4.
    4 Pre-Acute Heart Failure:Opportunity to Prevent Hospitalization Time Pre-Acute Heart Failure 2 Days to Weeks
  • 5.
    How Do WePrevent Heart Failure Hospitalizations? Maintain Optimal Fluid / Pressure Status Too “Wet” (High Pressures) Increased symptoms, increased risk of hospitalization, increased risk of arrhythmias, increased mortality “Just Right” (Normal Pressures) Feel well, low risk for hospitalization or death Too “Dry” (Low Pressures) Hypotension, dizziness, risk of syncope, worsening kidney function
  • 6.
    6 Pre-Acute Heart Failure:The Development of Acute Decompensation Physiologic markers of the development of acute decompensation: Pressure Changes Impedance Changes Weight Changes, HF Symptoms Hospitalization Time Stable Decompensation Autonomic Adaptation
  • 7.
    7 Pre-Acute Heart Failure:The Development of Acute Decompensation Physiologic markers of the development of acute decompensation: Pressure Changes Impedance Changes Weight Changes, HF Symptoms Hospitalization Time Stable Decompensation Autonomic Adaptation Unreliable, late, and indirect markers8,9 May be used in risk stratification, but not actionable4-7Enables proactive and personalized HF management1-3 1. Steimle AE, et al. Circulation, 1997 2. Abraham WT, et al. Lancet, 2011 3. Ritzema J, et al. Circulation, 2010 4. Abraham WT, HFSA, 2009 5. Conraads VM, et al. EHJ, 2011 6. Whellan DJ, et al. JACC, 2010 7. van Veldhuisen DJ, et al. Circulation, 2011 8. Chaudry SI, et al. NEJM 2010 9. Anker SD, et al. AHA 2010
  • 8.
    The Pulmonary ArteryPressure Measurement System* Catheter-based delivery system *FDA approved May 28, 2014 MEMS-based pressure sensor Home electronics PA Measurement database
  • 9.
    9 CHAMPION:  CardioMEMS Heart SensorAllows Monitoring of Pressure to Improve Outcomes in NYHA Class III Heart Failure Patients 550 Pts w/ CM Implants All Pts Take Daily Readings Treatment 270 Pts Management Based on Hemodynamics + Traditional Info Control 280 Pts Management Based on Traditional Info Primary Endpoint: HF Hospitalizations at 6 Months Additional Analysis: HF Hospitalizations at All Days (~15 M mean F/U) Multiple Secondary Endpoints § Trial Designed by Steering Committee with active FDA input § Prospective, multi-center, randomized, controlled single-blind clinical trial § All subjects followed in their randomized single- blind study assignment until the last patient reached 6 months of follow-up § 64 US Centers § PIs: William Abraham, Phil Adamson Abraham WT, et al. Lancet 2011
  • 10.
    10 Hypothesis of theCHAMPION Trial Medications should be adjusted based on pulmonary artery pressures unless contraindicated by clinical status of patient In addition to basing treatment on signs and symptoms Heart failure hospitalizations
  • 11.
    CHAMPION Clinical Trial:Managing to Target PA Pressures 550 Pts w/CMEMS Implants All Pts Take Daily readings Treatment 270 Pts Management Based on  PA Pressure +Traditional Info Control 280 Pts Management Based on  Traditional Info ther Primary Endpoint: rate of HF Hospitalization 26 ( Secondary Endpoints included: § Change in PA Pressure at 6 months § No. of patients admitted to hospital for HF § Days alive outside of hospital § QOL PA pressures were managed to target goal  pressures by physicians with appropriate  titration of HF medications. Target Goal PA Pressures: § PA Pressure Systolic 15 – 35 mmHg § PA Pressure diastolic 8 – 20 mmHg § PA Pressure mean 10 – 25 mmHg Adamson PB, et al., J Card Fail 2011 Abraham WT, et al., Lancet 2011 Treatment Recommendations  for Elevated PA Pressures • Add or increase diuretic – increase/add loop diuretic – change loop diuretic – add thiazide diuretic – IV loop diuretic • Add or increase vasodilator – add or increase nitrate
  • 12.
    Cumulative HF HospitalizationsReduced At 6 Months and Full Duration of Randomized Study 0 20 40 60 80 100 120 140 160 180 200 220 240 260 280 Days from Implant 0 90 180 270 360 450 540 630 720 810 900 270 262 244 210 169 131 108 82 29 5 1 280 267 252 215 179 137 105 67 25 10 0 No. at Risk Treatment Control Treatment (158 HF Hospitalizations) Control (254 HF Hospitalizations) Study Duration 37% RRR, p < 0.0001 ≤ 6 Months 28% RRR, p = 0.0002 > 6 Months 45% RRR, p < 0.0001
  • 13.
    Reduction in HospitalizationsOver Full Duration of Randomized Study Treatment (n=270) Control (n=280) Absolute  Reduction Relative  Reduction p-value HR (CI) Heart Failure Hospitalizations 182 279 97 0.67 (0.55 – 0.80) <0.0001 Death or Heart Failure Hospitalizations 232 343 111 0.69 (0.59 – 0.82) <0.0001 Results from Andersen Gill model Hazard Ratio (HR) and 95% Confidence Interval (CI) All Cause Hospitalizations 554 672 118 0.84 (0.75 – 0.95) 0.0032 Death or All Cause Hospitalizations 604 736 132 0.84 (0.76 – 0.94) 0.0017
  • 14.
    Ejection Fraction  Randomization  Group Number of Heart Failure  Hospitalizations Annualized Rate of  Hospitalization for  Heart Failure Hazard Ratio (95% CI) [p-value] ≥40% Treatment Group (n=62) 29 0.430.50 (0.35-0.70) [p<0.0001] Control Group (n=57) 59 0.86 ≥50%  Treatment Group (n=35) 13 0.41 0.30 (0.18-0.48) [p<0.0001] Control Group (n=31) 31 1.39 <40% Treatment Group (n=208) 153 0.67 0.74 (0.63-0.89) [p=0.0010] Control Group (n=222) 220 0.90
  • 15.
    PA Pressure-Guided TherapyBenefits Patients with Common HF Comorbidities Comorbidity N size (control) N size (treatment) HF Hospitalization rate  reduction at 15 months  in treatment group History of myocardial  infarction1 137 134 46% (p < 0.001 vs. control) COPD2,3 96 91 41% (p = 0.0009 vs. control) Pulmonary  hypertension4 163 151 36% (p = 0.0002 vs. control) AF5 135 120 41% (p < 0.0001 vs. control) Chronic Kidney Disease6 150 147 42% (p = 0.0001 vs. control) 1. Strickland WL, et al. JACC 2011 2. Criner G, et al. European Respiratory Journal, 2012 3. Martinez F, et al. European Respiratory Journal, 2012 4. Benza R, et al. Journal of Cardiac Failure, 2012 5. Miller AB, et al. JACC, 2012 6. Abraham et al., HFSA 2014
  • 16.
    Impact of PAPressure Guided HF Management on HF Hospitalizations in GDMT Population 0.39 0.69 HFrEF Patients on ACE/ARB and Beta Blocker Prior to Implant HF hospitalization rates 0 0.1 0.2 0.3 0.4 0.5 0.6 0.7 0.8 AnnualizedHFHospitalizationRate PA Pressure Guided HF Management (Treatment Group) Guideline Directed Standard of Care (Control Group) 43% Relative Risk Reduction [HR 0.57, 95% CI 0.45-0.74, p<0.0001] Number needed to treat: 3 Abraham et al. ACC 2015
  • 17.
    Impact of PAPressure Guided HF Management on All-Cause Mortality in GDMT Population 57% Relative Risk Reduction [HR 0.43, 95% CI 0.24-0.76, p=0.0026] Number needed to treat: 7 Abraham et al. ACC 2015
  • 18.
    18 Post-Acute Heart Failure:Opportunity to Prevent Rehospitalization Time Post-Acute Heart Failure 4 Days to Weeks
  • 19.
    19 Post-Acute Heart Failure:Relapse Before Recovery More than 50% of ADHF patient discharged from the hospital are still “wet” and do not receive adequate ongoing diuresis as outpatients1 Rehospitalization Time Stable Hospitalization 1Adams KF, et al., Am Heart J 2006
  • 20.
    117 31 18 60 13 4 HF Hospitalizations AllCause 30 Day Readmissions HF 30 Day Readmissions 0 20 40 60 80 100 120 Number of Hospitalizations Control (Standard of Care) Treatment (PA pressure monitoring) § Retrospective analysis of patients 65 years or older (n = 245) § Compared 30-day readmissions and HF hospitalizations between patients managed with PA pressure vs Standard of Care § Results showed statistically significant reductions in readmissions and HF hospitalizations in treatment group CHAMPION Clinical Trial: Substantial reduction in 30-day readmissions in Medicare-eligible patients Adamson, et al. AHA 2014 58% reduction p = 0.0062 78% reduction p = 0.0027 In Medicare-eligible patients 65 years or older PA pressure monitoring with the CardioMEMS™ HF System significantly reduced 30-day readmissions 49% reduction p < 0.0001
  • 21.
    21 What Else CanWe Do to Prevent Rehospitalization? Yancy CW, et al., Circulation 2013 Accessed at http://circ.ahajournals.org/content/128/16/e240
  • 22.
    Ohio State Post-DischargeManagement § Nurse navigator calls patient 48 hours post- discharge to review discharge instruction (diet, medications) and assess how the patient is doing § Nurse practitioner sees the patient 7 days post- discharge for comprehensive in-clinic assessment, diuretic dose adjustment, and GDMT dose titration if indicated § Heart failure physician sees patient 3-4 weeks post-discharge comprehensive in-clinic assessment, diuretic dose adjustment, and GDMT dose titration if indicated
  • 23.
    Other Post-Discharge Considerations §Many patient continue to exhibit some degree of resistance to oral diuretics § May need to consider outpatient use of intravenous (or subcutaneous?) diuretic therapy § May use Emergency Department Observation Unit to treat relapsing patients, before they require rehospitalization § Revaluate for precipitating causes of worsening heart failure