Download as PDF, PPTX


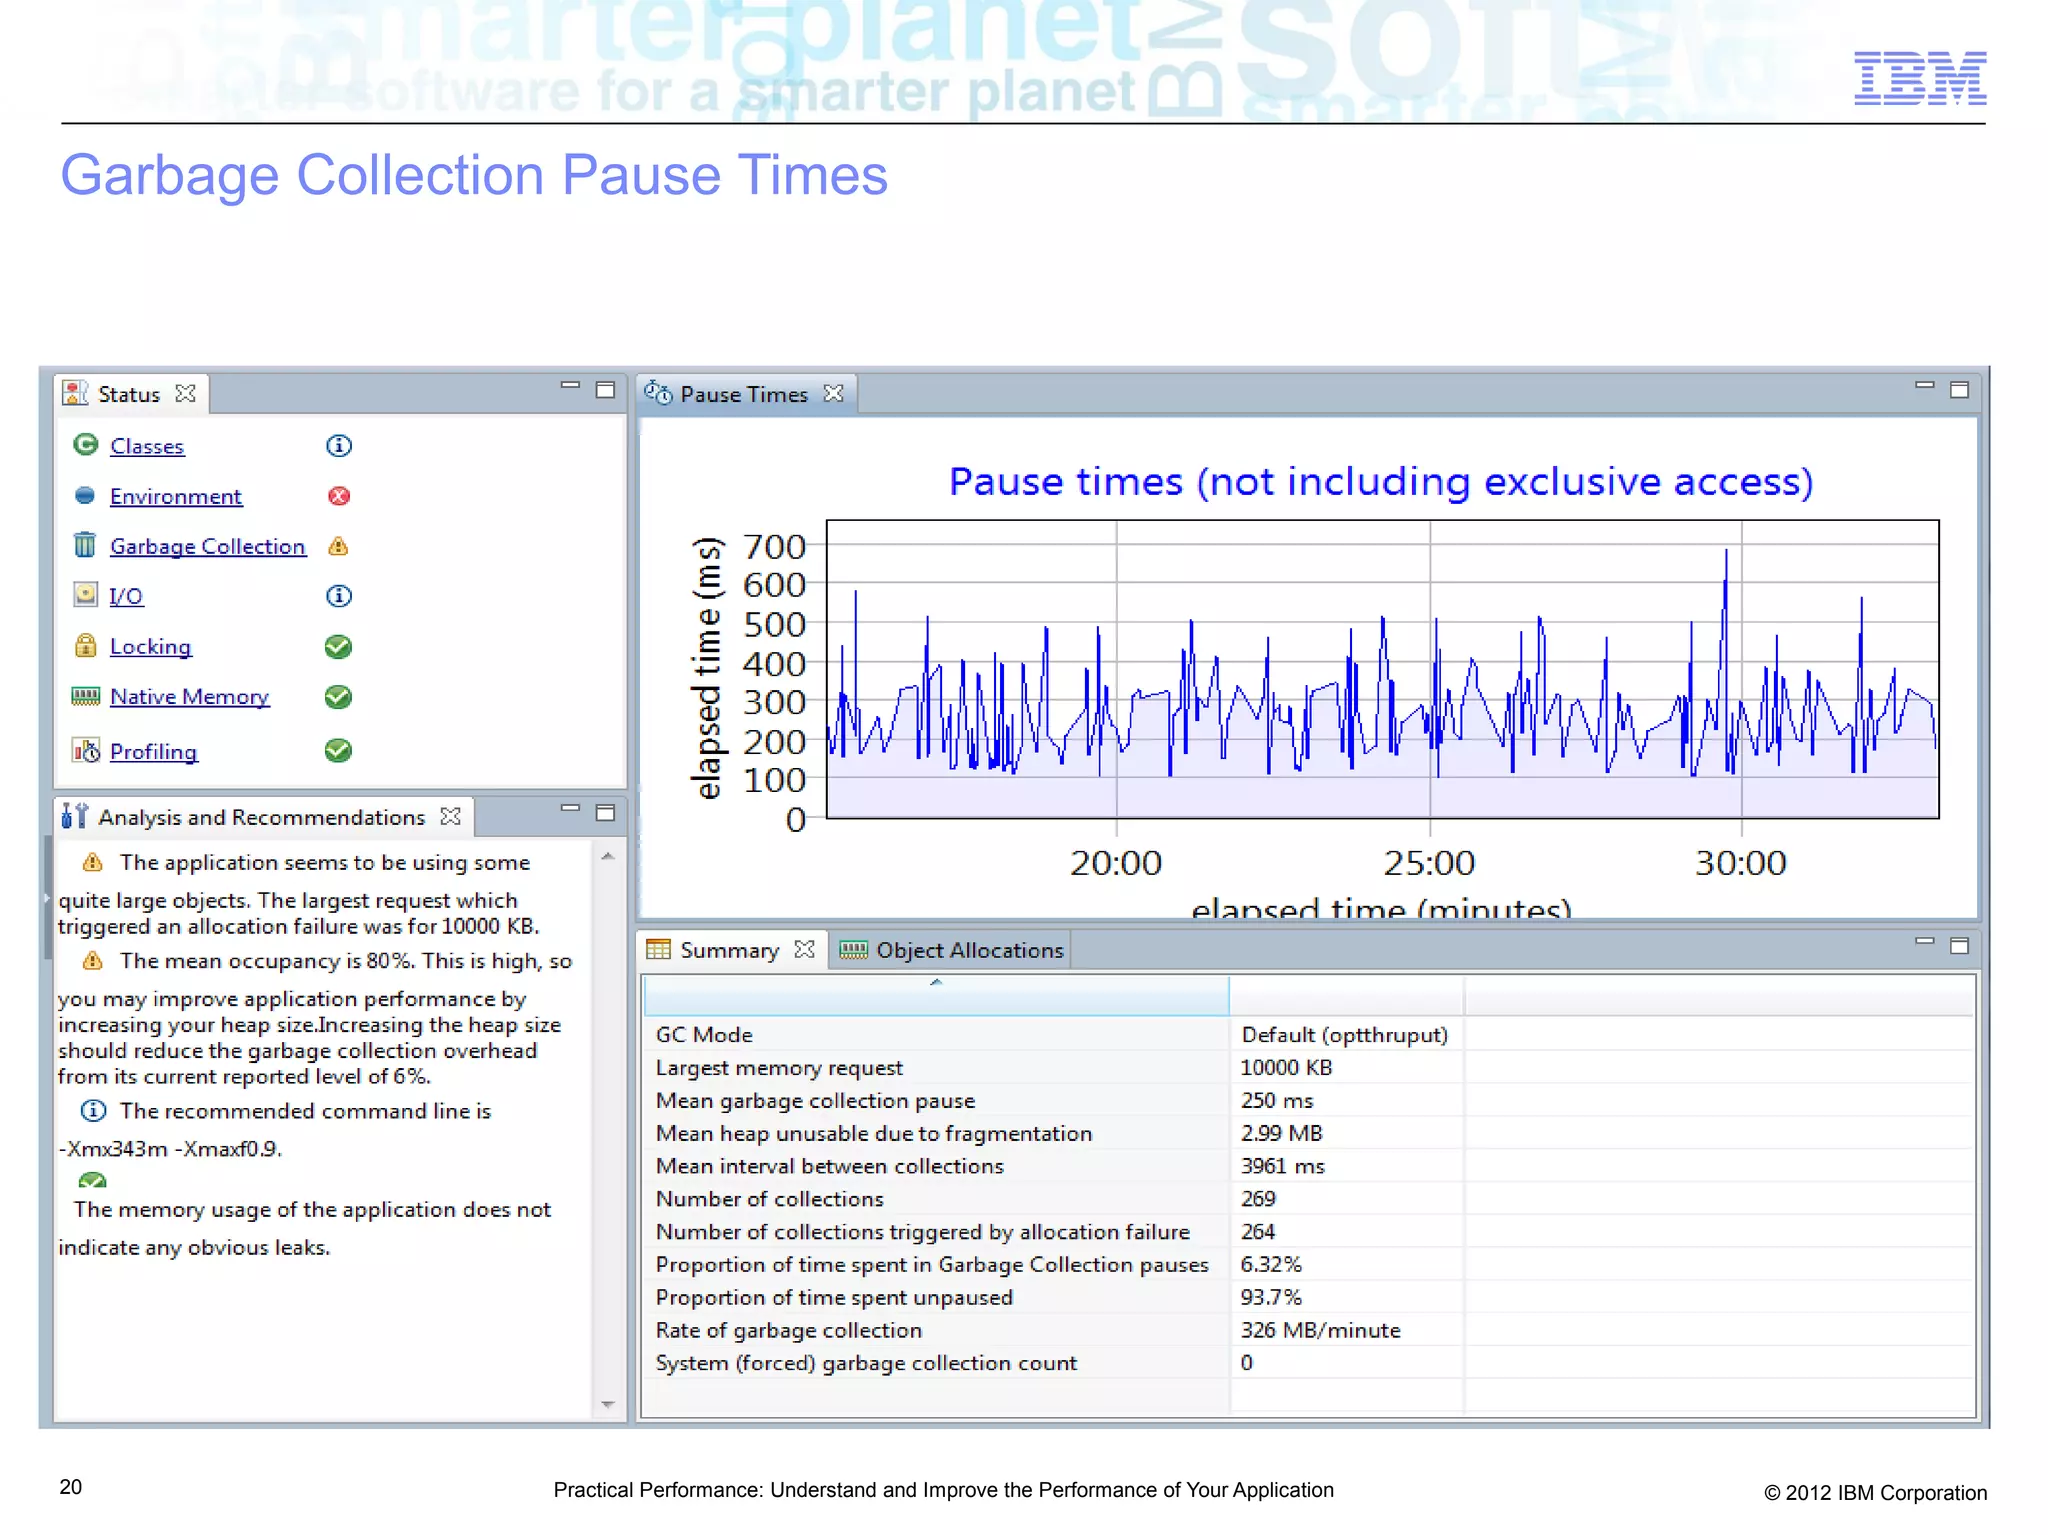


This presentation by Chris Bailey focuses on understanding and improving Java application performance, detailing methodologies for performance analysis and common bottlenecks. It outlines a layered approach to diagnose issues at the infrastructure, Java runtime, and application levels, emphasizing the importance of measuring and resolving resource constraints. Additionally, it provides practical guidance on performance testing and enhancements, including garbage collection management and synchronization strategies.