
Recommended
Recommended
More Related Content
Similar to PPT Measures of protein quality.pptx in monogastric
Similar to PPT Measures of protein quality.pptx in monogastric (20)
Recently uploaded
Recently uploaded (20)
PPT Measures of protein quality.pptx in monogastric
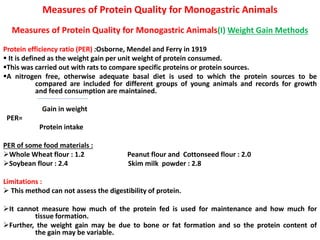
- 1. Measures of Protein Quality for Monogastric Animals Measures of Protein Quality for Monogastric Animals(I) Weight Gain Methods Protein efficiency ratio (PER) :Osborne, Mendel and Ferry in 1919 It is defined as the weight gain per unit weight of protein consumed. This was carried out with rats to compare specific proteins or protein sources. A nitrogen free, otherwise adequate basal diet is used to which the protein sources to be compared are included for different groups of young animals and records for growth and feed consumption are maintained. Gain in weight PER= Protein intake PER of some food materials : Whole Wheat flour : 1.2 Peanut flour and Cottonseed flour : 2.0 Soybean flour : 2.4 Skim milk powder : 2.8 Limitations : This method can not assess the digestibility of protein. It cannot measure how much of the protein fed is used for maintenance and how much for tissue formation. Further, the weight gain may be due to bone or fat formation and so the protein content of the gain may be variable.
- 2. Measures of Protein Quality for Monogastric Animals (I) Weight Gain Methods (1.)Protein efficiency ratio (PER) :Osborne, Mendel and Ferry in 1919 It is defined as the weight gain per unit weight of protein consumed. This was carried out with rats to compare specific proteins or protein sources. A nitrogen free, otherwise adequate basal diet is used to which the protein sources to be compared are included for different groups of young animals and records for growth and feed consumption are maintained. Gain in weight PER= Protein intake PER of some food materials : Whole Wheat flour : 1.2 Peanut flour and Cottonseed flour : 2.0 Soybean flour : 2.4 Skim milk powder : 2.8 Limitations : This method can not assess the digestibility of protein. It cannot measure how much of the protein fed is used for maintenance and how much for tissue formation. Further, the weight gain may be due to bone or fat formation and so the protein content of the gain may be variable.
- 3. (2.)Net protein retention (NPR): • It is a modification of the PER method. It makes an allowance for maintenance. It is claimed to give more accurate results than the PER method. Weight gain of TPG-weight loss of NPG NPR = Protein intake • where TPG = Group fed on test protein. • NPG= Group fed on non- protein (protein free) diet.
- 4. (3.)Gross protein value (GPV): It refers to a measurement with chicks fed a depletion diet containing 8% protein for 2 weeks, after which they are divided into three groups. The live weight gain of chicks receiving a basal diet containing 80g CP/kg are compared with those of chicks receiving the basal diet plus 30g CP/kg of a test protein and of others receiving the basal diet plus 30g CP/kg of casein. g increased weight gain/g test protein • GPV= g increased weight gain/g casein • The extra live weight gain per unit of supplementary test protein, stated as a proportion of the extra live weight gain per unit of supplementary casein
- 5. II. Nitrogen Balance Experiments (1.)Biological value (BV): Karl Thomas It is defined as the proportion of the nitrogen absorbed which is retained by the animal. N intake-(FN+UN) % BV= x 100 NI-FN NI-(FN-MFN)-(UN-EUN) % BV= NI-(FN-MFN) • Where NI = Nitrogen intake FN = Total faecal nitrogen
- 6. (2.)Net protein utilization (NPU) : The usefulness of a protein to an animal will depend upon its digestibility as well as its BV. NPU is the product of these two values and is the proportion of N intake which is retained. The product of NPU and the percentage CP is the net protein value (NPV) of the feed and is a measure of protein actually utilizable by the animal.
- 7. (3)Protein replacement value (PRV) : Murlin (1938) devised this measurement to overcome the limitations of the Thomas- Mitchell biological value. Replacement value of food protein is a measure of the retention of the total nitrogen intake rather than the digestible nitrogen. It compares the extent to which a test protein will give the same N balance as an equal amount of standard protein. 100- (NB1-NB2) PRV= X 100 NI Where: • NB1 is the N balance of animals fed standard protein • NB2 is the N balance of animals fed the test protein and NI as N intake.
- 8. III. Body Nitrogen Retention Method Miller and Bender (1955) devised this method. This is based on a comparison of the body N content resulting from a test protein with that resulting over the same period on a nitrogen-free diet. The value is computed as follows: Body N content Body N content with with test protein – N-free diet Body N retention= NI
- 9. III. Estimation of protein quality with amino acid composition (1.)Chemical score: Black and Mitchell (1946) In this concept the quality of a protein is decided by that constituent indispensable amino acid which is in greatest deficit when compared with a standard. The standard generally used is egg protein, but now many workers use a defined amino acid mixture recommended by FAO. For example: Amino acid levels in % egg protein (standard) and % wheat protein (test protein) are given. Then amino acid deficiencies are calculated. The amino acid present in the greatest deficit is considered as the limiting amino acid and the complement of its percentage deficit is chemical score for that protein. Between egg protein and wheat protein, calculation revealed lysine was the most limiting amino acid (-63% deficit) and hence chemical score for wheat is 100-63=37 Chemical score appears to be a useful measurement for separating protein into categories of usefulness. With protein that is deficient in several amino acids, correction of one deficiency still leaves a combination that is biologically imperfect.
- 10. (2.) The essential amino acid index (EAAI): B.L. Oser (1951) This measure based on the contribution the protein makes to all essential amino acids rather than to the one greatest deficit. It may be defined as the geometric mean of the ten egg ratios found by comparing the content of ten EAAs in a feed protein with that found in whole egg protein. Algebraically the index is expressed as: 100a 100b 100c 100j EAAI = 10 x x x ………….. ae be ce je Where : a, b, c, ….j =% concentrations of the indispensable amino in feed protein ae, be, ce, …..je = % concentrations of same amino acids in egg protein. For computation it is convenient to express the equation in logarithmic: 1 100a 100b 100j log EAA index = log + log + ……………… 10 ae be je Antilog of the above gives the EAAI of that test protein