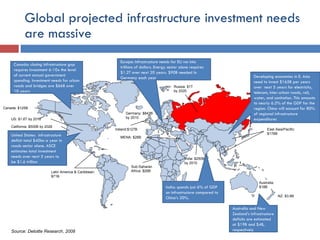
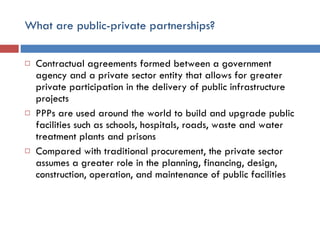
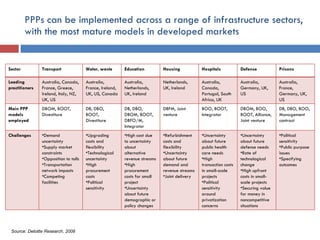
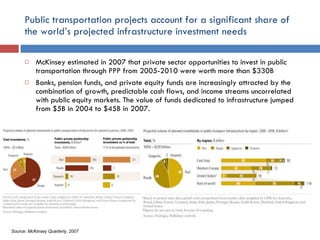
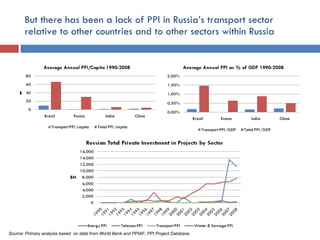
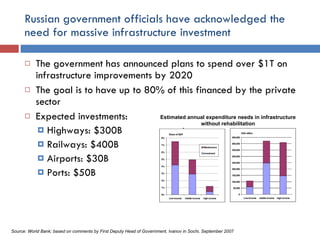
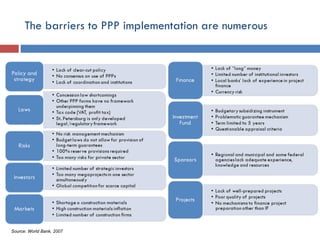
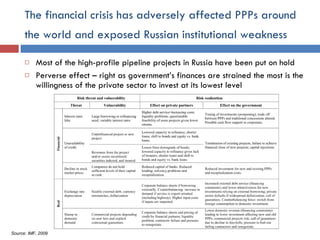
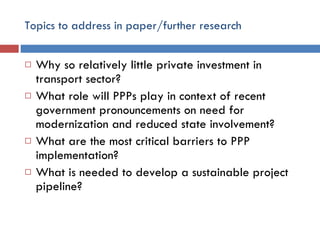
TRANSPORT INFRASTRUCTURE IN THE RUSSIAN FEDERATION Is Russia Ready for Public-Private Partnerships?
Global projected infrastructure investment needs are massive Canada: closing infrastructure gap requires investment 6-10x the level of current annual government spending. Investment needs for urban roads and bridges are $66B over 10 years United States:  infrastructure deficit total $40bn a year in roads sector alone. ASCE estimates total investment needs over next 5 years to be $1.6 trillion Australia and New Zealand’s infrastructure deficits are estimated at $19B and $4B, respectively Canada: $125B US: $1.6T by 2010 California: $500B by 2026 Latin America & Caribbean: $71B MENA: $28B Ireland:$127B Germany: $843B by 2010 Sub-Saharan Africa: $26B India: $250B by 2010 East Asia/Pacific: $178B Russia: $1T by 2020 Australia: $18B NZ: $3.6B Europe: Infrastructure needs for EU run into trillions of dollars. Energy sector alone requires $1.2T over next 20 years. $90B needed in Germany each year India: spends just 6% of GDP on infrastructure compared to China’s 20%.  Developing economies in E. Asia need to invest $165B per years over  next 5 years for electricity, telecom, inter-urban roads, rail, water, and sanitation. This amounts to nearly 6.2% of the GDP for the region. China will account for 80% of regional infrastructure expenditures Source: Deloitte Research, 2008
In developing countries, the private sector has long contributed to public infrastructure investment 2008 US$ billions New projects Source: World Bank and PPIAF, PPI Project Database.
This has occurred across a diverse range of sectors and geographies Total: US$797.3 billion (2008 US$) Total: US$843.3 billion (2008 US$) 1990–2000 2001–08 Source: World Bank and PPIAF, PPI Project Database.
What are public-private partnerships? Contractual agreements formed between a government agency and a private sector entity that allows for greater private participation in the delivery of public infrastructure projects PPPs are used around the world to build and upgrade public facilities such as schools, hospitals, roads, waste and water treatment plants and prisons Compared with traditional procurement, the private sector assumes a greater role in the planning, financing, design, construction, operation, and maintenance of public facilities
PPPs are unlikely to fully replace traditional financing of infrastructure, but offer several benefits to governments Allow the costs of investment to be spread over the lifetime of the asset Solid track record of on-time, on-budget delivery Transfer certain risks to private sector and provide incentives for assets to be properly maintained Can lower the cost of infrastructure by reducing construction and overall lifecycle costs Encourage strong customer service orientation Enable the public sector to focus on outcome-based public value
Various procurement models are employed for PPPs to allocate specific risks NEW PROJECTS EXISTING SERVICES & FACILITIES Design-Build Design-Build- Maintain Design-Build-Operate Design-Build-Operate-Maintain Build-Own-Operate-Transfer Build-Own-Operate Service Contracts Management Contracts Lease Concession Divestiture The government contracts with a private partner to design and build a facility in accordance with set forth requirements. The government assumes responsibility for operations and maintenance after completion. Also known as Build-Transfer-Operate. The private sector designs and builds a facility. Once completed, the title is transferred to the public sector, while the private sector operates the facility for a specified period. The government transfers an asset, either in part or in full, to the private sector. Generally the government will include certain conditions with the sale of the asset to ensure that improvements are made and citizens continue to be served. The government contracts with a private entity to provide services the government previously performed The government grants a private entity exclusive rights to provide, operate, and maintain an asset over a long period in accordance with performance requirements. The public sector retains ownership of the asset, while the operator owns any improvements to the asset. The government grants the right to finance, design, build, operate, and maintain a project to a private entity, which retains ownership. The private entity is not required to transfer the facility back to the government Source: Deloitte Research; National Council for PPPs Public responsibility Private responsibility
PPPs can be implemented across a range of infrastructure sectors, with the most mature models in developed markets Source: Deloitte Research, 2008 Sector Transport Water, waste Education Housing Hospitals Defense Prisons Leading practitioners Australia, Canada, France, Greece, Ireland, Italy, NZ, UK, US Australia, France, Ireland, UK, US, Canada Australia, Netherlands, UK, Ireland Netherlands, UK, Ireland Australia, Canada, Portugal, South Africa, UK Australia, Germany, UK, US Australia, France, Germany, UK, US Main PPP models employed DBOM, BOOT, Divestiture DB, DBO, BOOT, Divestiture DB, DBO, DBOM, BOOT, DBFO/M, Integrator DBFM, Joint venture BOO, BOOT, Integrator DBOM, BOO, BOOT, Alliance, Joint venture DB, DBO, BOO, Management contract Challenges Demand uncertainty Supply market constraints Opposition to tolls Transportation network impacts Competing facilities Upgrading costs and flexibility Technological uncertainty High procurement costs Political sensitivity High cost due to uncertainty about alternative revenue streams High procurement costs for small project Uncertainty about future demographic or policy changes Refurbishment costs and flexibility Uncertainty about future demand and revenue streams Joint delivery Uncertainty about future public health care needs High transaction costs in small-scale projects Political sensitivity around privatization concerns Uncertainty about future defense needs Rate of technological change High upfront costs in small-scale projects Securing value for money in noncompetitive situations Political sensitivity  Public purpose issues Specifying outcomes
Public transportation projects account for a significant share of the world’s projected infrastructure investment needs McKinsey estimated in 2007 that private sector opportunities to invest in public transportation through PPP from 2005-2010 were worth more than $330B Banks, pension funds, and private equity funds are increasingly attracted by the combination of growth, predictable cash flows, and income streams uncorrelated with public equity markets. The value of funds dedicated to infrastructure jumped from $5B in 2004 to $45B in 2007. Source: McKinsey Quarterly, 2007
In developing markets, private investment in transport infrastructure has been at historically high levels, driven by India and China Source: World Bank and PPIAF, PPI Project Database.  2008 US$ billions New projects 2008 US$ billions Investment commitments to transport projects with private participation, by country income group, 1990–2008 Investment commitments to transport projects with private participation in developing countries, by subsector, 1990–2008
Russia has been a leading destination for PPI in the developing world Top 10 by investment in infrastructure projects with private participation in 2001‒08 * Includes investment in projects reaching financial closure in 1990‒2008. Top 10 by new infrastructure projects with private participation in 2001‒08 Note: China and India are classified as lower-middle-income countries by the World Bank, and Brazil and the Russian Federation as upper-middle-income countries. Source: World Bank and PPIAF, PPI Project Database.  Country Investment* (2008 US$ billions) Share of total (%) Brazil 111.9  13.3  India 110.2  13.1  Russian Federation 74.7  8.9  China 57.2  6.8  Mexico 49.3  5.9  Turkey 32.0  3.8  Poland 24.8  2.9  Indonesia 22.9  2.7  Nigeria 22.2  2.6  South Africa 21.4  2.5  Total 526.7  62.5 Country New projects Share of total (%) China 602 30.6 India 232 11.8 Brazil 141 7.2 Russian Federation 56 2.8 Mexico 54 2.7 Nigeria 45 2.3 Colombia 43 2.2 Chile 35 1.8 Indonesia 32 1.6 Malaysia 32 1.6 Total 1,272 64.6
But there has been a lack of PPI in Russia’s transport sector relative to other countries and to other sectors within Russia Source: Primary analysis based  on data from World Bank and PPIAF, PPI Project Database.
Russia’s transport infrastructure, which has suffered from relative neglect over the past twenty years, is being upgraded only slowly Non-pipeline freight turnover was 2,100B ton-km in 2006, of which 90% was by rail Structure of transport system has changed since Soviet times reflecting reduced subsidies and more private cars Public transport carried 21B passengers in 2006 vs. 44B in 2000 Railways: 87,000km of track in 2006 (2 nd  highest in world), half of which is electrified  Roads: 870,000km (738,000km paved) in 2005 Safety record is poor; mortality from road accidents in 2005, 24 per 100,000 people Upgrade of road network has accelerated with creation in 2006 of $2.5B investment fund, a large part of which is earmarked for PPPs Air transport: 45M passengers in 2007, up from 23M in 2000 Russian airlines face increased competition from foreign airlines which accounted for 45% of volumes in 2007 Sea ports: 43; port development being driven by aggressive expansion plans of oil majors Russian oil exports – 248M tons in 2006 Current projects to increase export capacity are not sufficient to keep pace with the expansion of crude oil output Source: EIU Country Report 2008; Rosstat
Russian government officials have acknowledged the need for massive infrastructure investment The government has announced plans to spend over $1T on infrastructure improvements by 2020 The goal is to have up to 80% of this financed by the private sector Expected investments: Highways: $300B Railways: $400B Airports: $30B Ports: $50B Source: World Bank; based on comments by First Deputy Head of Government, Ivanov in Sochi, September 2007 Estimated annual expenditure needs in infrastructure without rehabilitation
In recent years, Russia has taken a number of measures to improve the frameworks and institutions necessary for PPP implementation Legal framework Federal Concession Law – sets stage for utilization of PPPs in transportation, energy, education, health care, and utilities sectors St. Petersburg PPP Law – offers flexible framework for structuring, tendering, and supporting non-concession based projects St. Petersburg has most advanced project pipeline  Development institutions Investment Fund – intended to be one of the state’s primary PPP funding sources and to act as a catalyst in attracting private investment State Development Bank (Vneshekonombank) – state-owned banking institutions assigned with promoting Russian infrastructure financing Sept. 2008 – committed to 69 projects worth Rb 392B
From 2007-08, several high profile PPPs were tendered, marking the first real test of new Russian PPP legislation The potential volume of private investment in Russian transport infrastructure has been estimated at 12-15B Euros per year Source: Freshfields Bruckhaus Derringer, 2008 Project Description Facts Western High Speed Diameter Motorway (WHSD) 46km motorway linking St. Petersburg’s trade seaports with the national road network. To the north it will provide a connection to Scandinavia  Construction started in 9/05 and expected to be completed in 6-7 years Total project contract value estimated at $9B 50% of construction costs to Federal government St. Petersburg-Moscow Motorway  The first 58km section of the toll motorway linking the 2 cities aims to relieve congestion on one of the busiest highways in Russia Estimated value of up to $2.1B Estimated to take 5 years to complete 50% funding from the state Orlovsky Tunnel 1km long tunnel under the River Neva in St. Petersburg will open inland shipping to international transport. And will increase general capacity of the Volgo Waterway In August 2006, the project was allocated $300mm from the Investment Fund, with the balance from the city budget Nadzemny Express 26km rail  line that will pass through 5 southern city districts and will encompass extensions to Pulkovo Airport and Petrodvorets 16 stations and 30km of track Concession for 30 years Pulkovo Airport St. Petersburg’s main airport is arguably the most important part of transport infrastructure in northwest Russia and is fast developing.  $1.5B to be invested through an SPV to upgrade the airport Concession for 30 years
But Russia has a long way to go before PPPs are as commonplace as in Western markets The announced deals to date have mostly been high-profile “one-offs”, concentrated in St. Petersburg Hard to see a clear pipeline of projects due to lack of central PPP unit In general, level of PPP “readiness” is perceived to be low Source: McKinsey Quarterly, 2007 Readiness composed of 3 factors: Extent of government commitment to PPPs Clarity of vision, project pipeline robustness and transparency, stakeholder perception Effectiveness of governance legal/institutional frameworks, clear parameters for choosing projects, effective and capable government institutions Track record in execution  Business plans that identify main risks, strong tender process, feedback mechanisms
The barriers to PPP implementation are numerous Source: World Bank, 2007
Russia is still at an early stage of PPP development, but can learn from the pioneers Source: Deloitte Research, 2008 Establish policy & legislative framework Initiate central PPP policy unit to guide implementation Develop deal structure Get transactions right and develop public sector comparator model Begin to build marketplace Apply early lessons from transport to other sector Establish dedicated PPP units in agencies Begin developing new hybrid delivery models Expand and help shape PPP marketplace Leverage new sources of funds from capital markets Use PPPs to drive service innovation PPP market gains depth – use is expanded to multiple projects and sectors Refine new innovative models More creative, flexible approaches applied to roles of public and private sectors Use of more sophisticated risk models Grater focus on total lifecycle of project Sophisticated infrastructure market with pension funds and private equity funds Public sector learns from private partner methods as competition changes the way government operations function Underutilized assets leveraged into financial assets Organizational and skill set changes in government implemented to support greater role of PPPs Stage One Stage Two Stage Three
The financial crisis has adversely affected PPPs around the world and exposed Russian institutional weakness   Most of the high-profile pipeline projects in Russia have been put on hold Perverse effect – right as government’s finances are strained the most is the willingness of the private sector to invest at its lowest level Source: IMF, 2009
Topics to address in paper/further research Why so relatively little private investment in transport sector? What role will PPPs play in context of recent government pronouncements on need for modernization and reduced state involvement? What are the most critical barriers to PPP implementation? What is needed to develop a sustainable project pipeline?

PPPs in Russian Transportation Sector

  • 1.
    TRANSPORT INFRASTRUCTURE INTHE RUSSIAN FEDERATION Is Russia Ready for Public-Private Partnerships?
  • 2.
    Global projected infrastructureinvestment needs are massive Canada: closing infrastructure gap requires investment 6-10x the level of current annual government spending. Investment needs for urban roads and bridges are $66B over 10 years United States: infrastructure deficit total $40bn a year in roads sector alone. ASCE estimates total investment needs over next 5 years to be $1.6 trillion Australia and New Zealand’s infrastructure deficits are estimated at $19B and $4B, respectively Canada: $125B US: $1.6T by 2010 California: $500B by 2026 Latin America & Caribbean: $71B MENA: $28B Ireland:$127B Germany: $843B by 2010 Sub-Saharan Africa: $26B India: $250B by 2010 East Asia/Pacific: $178B Russia: $1T by 2020 Australia: $18B NZ: $3.6B Europe: Infrastructure needs for EU run into trillions of dollars. Energy sector alone requires $1.2T over next 20 years. $90B needed in Germany each year India: spends just 6% of GDP on infrastructure compared to China’s 20%. Developing economies in E. Asia need to invest $165B per years over next 5 years for electricity, telecom, inter-urban roads, rail, water, and sanitation. This amounts to nearly 6.2% of the GDP for the region. China will account for 80% of regional infrastructure expenditures Source: Deloitte Research, 2008
  • 3.
    In developing countries,the private sector has long contributed to public infrastructure investment 2008 US$ billions New projects Source: World Bank and PPIAF, PPI Project Database.
  • 4.
    This has occurredacross a diverse range of sectors and geographies Total: US$797.3 billion (2008 US$) Total: US$843.3 billion (2008 US$) 1990–2000 2001–08 Source: World Bank and PPIAF, PPI Project Database.
  • 5.
    What are public-privatepartnerships? Contractual agreements formed between a government agency and a private sector entity that allows for greater private participation in the delivery of public infrastructure projects PPPs are used around the world to build and upgrade public facilities such as schools, hospitals, roads, waste and water treatment plants and prisons Compared with traditional procurement, the private sector assumes a greater role in the planning, financing, design, construction, operation, and maintenance of public facilities
  • 6.
    PPPs are unlikelyto fully replace traditional financing of infrastructure, but offer several benefits to governments Allow the costs of investment to be spread over the lifetime of the asset Solid track record of on-time, on-budget delivery Transfer certain risks to private sector and provide incentives for assets to be properly maintained Can lower the cost of infrastructure by reducing construction and overall lifecycle costs Encourage strong customer service orientation Enable the public sector to focus on outcome-based public value
  • 7.
    Various procurement modelsare employed for PPPs to allocate specific risks NEW PROJECTS EXISTING SERVICES & FACILITIES Design-Build Design-Build- Maintain Design-Build-Operate Design-Build-Operate-Maintain Build-Own-Operate-Transfer Build-Own-Operate Service Contracts Management Contracts Lease Concession Divestiture The government contracts with a private partner to design and build a facility in accordance with set forth requirements. The government assumes responsibility for operations and maintenance after completion. Also known as Build-Transfer-Operate. The private sector designs and builds a facility. Once completed, the title is transferred to the public sector, while the private sector operates the facility for a specified period. The government transfers an asset, either in part or in full, to the private sector. Generally the government will include certain conditions with the sale of the asset to ensure that improvements are made and citizens continue to be served. The government contracts with a private entity to provide services the government previously performed The government grants a private entity exclusive rights to provide, operate, and maintain an asset over a long period in accordance with performance requirements. The public sector retains ownership of the asset, while the operator owns any improvements to the asset. The government grants the right to finance, design, build, operate, and maintain a project to a private entity, which retains ownership. The private entity is not required to transfer the facility back to the government Source: Deloitte Research; National Council for PPPs Public responsibility Private responsibility
  • 8.
    PPPs can beimplemented across a range of infrastructure sectors, with the most mature models in developed markets Source: Deloitte Research, 2008 Sector Transport Water, waste Education Housing Hospitals Defense Prisons Leading practitioners Australia, Canada, France, Greece, Ireland, Italy, NZ, UK, US Australia, France, Ireland, UK, US, Canada Australia, Netherlands, UK, Ireland Netherlands, UK, Ireland Australia, Canada, Portugal, South Africa, UK Australia, Germany, UK, US Australia, France, Germany, UK, US Main PPP models employed DBOM, BOOT, Divestiture DB, DBO, BOOT, Divestiture DB, DBO, DBOM, BOOT, DBFO/M, Integrator DBFM, Joint venture BOO, BOOT, Integrator DBOM, BOO, BOOT, Alliance, Joint venture DB, DBO, BOO, Management contract Challenges Demand uncertainty Supply market constraints Opposition to tolls Transportation network impacts Competing facilities Upgrading costs and flexibility Technological uncertainty High procurement costs Political sensitivity High cost due to uncertainty about alternative revenue streams High procurement costs for small project Uncertainty about future demographic or policy changes Refurbishment costs and flexibility Uncertainty about future demand and revenue streams Joint delivery Uncertainty about future public health care needs High transaction costs in small-scale projects Political sensitivity around privatization concerns Uncertainty about future defense needs Rate of technological change High upfront costs in small-scale projects Securing value for money in noncompetitive situations Political sensitivity Public purpose issues Specifying outcomes
  • 9.
    Public transportation projectsaccount for a significant share of the world’s projected infrastructure investment needs McKinsey estimated in 2007 that private sector opportunities to invest in public transportation through PPP from 2005-2010 were worth more than $330B Banks, pension funds, and private equity funds are increasingly attracted by the combination of growth, predictable cash flows, and income streams uncorrelated with public equity markets. The value of funds dedicated to infrastructure jumped from $5B in 2004 to $45B in 2007. Source: McKinsey Quarterly, 2007
  • 10.
    In developing markets,private investment in transport infrastructure has been at historically high levels, driven by India and China Source: World Bank and PPIAF, PPI Project Database. 2008 US$ billions New projects 2008 US$ billions Investment commitments to transport projects with private participation, by country income group, 1990–2008 Investment commitments to transport projects with private participation in developing countries, by subsector, 1990–2008
  • 11.
    Russia has beena leading destination for PPI in the developing world Top 10 by investment in infrastructure projects with private participation in 2001‒08 * Includes investment in projects reaching financial closure in 1990‒2008. Top 10 by new infrastructure projects with private participation in 2001‒08 Note: China and India are classified as lower-middle-income countries by the World Bank, and Brazil and the Russian Federation as upper-middle-income countries. Source: World Bank and PPIAF, PPI Project Database. Country Investment* (2008 US$ billions) Share of total (%) Brazil 111.9 13.3 India 110.2 13.1 Russian Federation 74.7 8.9 China 57.2 6.8 Mexico 49.3 5.9 Turkey 32.0 3.8 Poland 24.8 2.9 Indonesia 22.9 2.7 Nigeria 22.2 2.6 South Africa 21.4 2.5 Total 526.7 62.5 Country New projects Share of total (%) China 602 30.6 India 232 11.8 Brazil 141 7.2 Russian Federation 56 2.8 Mexico 54 2.7 Nigeria 45 2.3 Colombia 43 2.2 Chile 35 1.8 Indonesia 32 1.6 Malaysia 32 1.6 Total 1,272 64.6
  • 12.
    But there hasbeen a lack of PPI in Russia’s transport sector relative to other countries and to other sectors within Russia Source: Primary analysis based on data from World Bank and PPIAF, PPI Project Database.
  • 13.
    Russia’s transport infrastructure,which has suffered from relative neglect over the past twenty years, is being upgraded only slowly Non-pipeline freight turnover was 2,100B ton-km in 2006, of which 90% was by rail Structure of transport system has changed since Soviet times reflecting reduced subsidies and more private cars Public transport carried 21B passengers in 2006 vs. 44B in 2000 Railways: 87,000km of track in 2006 (2 nd highest in world), half of which is electrified Roads: 870,000km (738,000km paved) in 2005 Safety record is poor; mortality from road accidents in 2005, 24 per 100,000 people Upgrade of road network has accelerated with creation in 2006 of $2.5B investment fund, a large part of which is earmarked for PPPs Air transport: 45M passengers in 2007, up from 23M in 2000 Russian airlines face increased competition from foreign airlines which accounted for 45% of volumes in 2007 Sea ports: 43; port development being driven by aggressive expansion plans of oil majors Russian oil exports – 248M tons in 2006 Current projects to increase export capacity are not sufficient to keep pace with the expansion of crude oil output Source: EIU Country Report 2008; Rosstat
  • 14.
    Russian government officialshave acknowledged the need for massive infrastructure investment The government has announced plans to spend over $1T on infrastructure improvements by 2020 The goal is to have up to 80% of this financed by the private sector Expected investments: Highways: $300B Railways: $400B Airports: $30B Ports: $50B Source: World Bank; based on comments by First Deputy Head of Government, Ivanov in Sochi, September 2007 Estimated annual expenditure needs in infrastructure without rehabilitation
  • 15.
    In recent years,Russia has taken a number of measures to improve the frameworks and institutions necessary for PPP implementation Legal framework Federal Concession Law – sets stage for utilization of PPPs in transportation, energy, education, health care, and utilities sectors St. Petersburg PPP Law – offers flexible framework for structuring, tendering, and supporting non-concession based projects St. Petersburg has most advanced project pipeline Development institutions Investment Fund – intended to be one of the state’s primary PPP funding sources and to act as a catalyst in attracting private investment State Development Bank (Vneshekonombank) – state-owned banking institutions assigned with promoting Russian infrastructure financing Sept. 2008 – committed to 69 projects worth Rb 392B
  • 16.
    From 2007-08, severalhigh profile PPPs were tendered, marking the first real test of new Russian PPP legislation The potential volume of private investment in Russian transport infrastructure has been estimated at 12-15B Euros per year Source: Freshfields Bruckhaus Derringer, 2008 Project Description Facts Western High Speed Diameter Motorway (WHSD) 46km motorway linking St. Petersburg’s trade seaports with the national road network. To the north it will provide a connection to Scandinavia Construction started in 9/05 and expected to be completed in 6-7 years Total project contract value estimated at $9B 50% of construction costs to Federal government St. Petersburg-Moscow Motorway The first 58km section of the toll motorway linking the 2 cities aims to relieve congestion on one of the busiest highways in Russia Estimated value of up to $2.1B Estimated to take 5 years to complete 50% funding from the state Orlovsky Tunnel 1km long tunnel under the River Neva in St. Petersburg will open inland shipping to international transport. And will increase general capacity of the Volgo Waterway In August 2006, the project was allocated $300mm from the Investment Fund, with the balance from the city budget Nadzemny Express 26km rail line that will pass through 5 southern city districts and will encompass extensions to Pulkovo Airport and Petrodvorets 16 stations and 30km of track Concession for 30 years Pulkovo Airport St. Petersburg’s main airport is arguably the most important part of transport infrastructure in northwest Russia and is fast developing. $1.5B to be invested through an SPV to upgrade the airport Concession for 30 years
  • 17.
    But Russia hasa long way to go before PPPs are as commonplace as in Western markets The announced deals to date have mostly been high-profile “one-offs”, concentrated in St. Petersburg Hard to see a clear pipeline of projects due to lack of central PPP unit In general, level of PPP “readiness” is perceived to be low Source: McKinsey Quarterly, 2007 Readiness composed of 3 factors: Extent of government commitment to PPPs Clarity of vision, project pipeline robustness and transparency, stakeholder perception Effectiveness of governance legal/institutional frameworks, clear parameters for choosing projects, effective and capable government institutions Track record in execution Business plans that identify main risks, strong tender process, feedback mechanisms
  • 18.
    The barriers toPPP implementation are numerous Source: World Bank, 2007
  • 19.
    Russia is stillat an early stage of PPP development, but can learn from the pioneers Source: Deloitte Research, 2008 Establish policy & legislative framework Initiate central PPP policy unit to guide implementation Develop deal structure Get transactions right and develop public sector comparator model Begin to build marketplace Apply early lessons from transport to other sector Establish dedicated PPP units in agencies Begin developing new hybrid delivery models Expand and help shape PPP marketplace Leverage new sources of funds from capital markets Use PPPs to drive service innovation PPP market gains depth – use is expanded to multiple projects and sectors Refine new innovative models More creative, flexible approaches applied to roles of public and private sectors Use of more sophisticated risk models Grater focus on total lifecycle of project Sophisticated infrastructure market with pension funds and private equity funds Public sector learns from private partner methods as competition changes the way government operations function Underutilized assets leveraged into financial assets Organizational and skill set changes in government implemented to support greater role of PPPs Stage One Stage Two Stage Three
  • 20.
    The financial crisishas adversely affected PPPs around the world and exposed Russian institutional weakness Most of the high-profile pipeline projects in Russia have been put on hold Perverse effect – right as government’s finances are strained the most is the willingness of the private sector to invest at its lowest level Source: IMF, 2009
  • 21.
    Topics to addressin paper/further research Why so relatively little private investment in transport sector? What role will PPPs play in context of recent government pronouncements on need for modernization and reduced state involvement? What are the most critical barriers to PPP implementation? What is needed to develop a sustainable project pipeline?

Editor's Notes

  • #2 I am focusing my paper on Russia, and the potential for PPPs in the transport sector Why Russia? In the context of broader issues of privatization, Russia has an interesting track record I admit, the concept of partnerships between the private and public sector seems a little oxymoronic in a place like Russia, where the state has played such a heavy hand in the economy, and where the public would have good reason to be distrustful of the private sector Why the transport sector? Well, I didn’t want to write about energy or sewage plants. Also, Russia is the largest country on Earth, and so the potential for investment in transportation is considerable
  • #3 Russia is not unique in the fact that it faces a huge infrastructure gap Evidence of the need for additional resources is widespread, from congested roads, collapsing bridges, deteriorating and overcrowded hospitals and schools Governments in developed and developing countries alike need to invest trillions of dollars to maintain existing infrastructure and invest in new projects as their long-term economic growth depends on it
  • #4 As this World Bank data shows, the private sector has long been instrumental in investing in public infrastructure, even in developing countries
  • #5 This has occurred across a range of sectors and geographies Telecoms and electricity have been the heavyweights for private investment in developing markets, mirroring the waves of privatization and deregulation that occurred in those industries beginning in the 1990s, and reflecting the state’s heavy initial involvement Latin America was an early adopter of private investment in infrastructure, although the European and Central Asian region – including Russia – has been among the fastest growing
  • #6 So, what are PPPs exactly? Essentially, they’re arrangements in which the private sector supplies infrastructure assets and services that is traditionally provided by public authorities A key component of them is the notion of the efficient allocation of risks between parties that have comparative advantages in their ability to bear those risks
  • #7 Governments have some basic reasons to allow for private sector investment in infrastructure: to serve as a catalyst for reforming public services, to save money, and to create additional financing capacity outside the constraints of public budgets Some other specific benefits are worth mentioning: - PPPs allow the cost of investments to be spread over the life of the asset versus more conventional procurement methods, which require significant upfront capital costs and which require pay-as-you-go financing. Private sector involvement allows for projects to be constructed more quickly, and private sponsors have incentive to complete the project as quickly as possible The public sector provision of infrastructure is vulnerable to politics and budgetary pressures, which can result in deferred maintenance. California for example has deferred transportation maintenance of $23B in state and local-level. Governments can ameliorate these problems by transferring certain construction and maintenance risks to a private partner cost savings materialize in different forms, such as more efficient construction processes. Also, by shifting the responsibility of operation and maintenance to the private sector, it creates incentives to ensure longer-term construction quality
  • #8 Similar to the continuum of different forms of privatization on the front of the syllabus, there are multiple forms of PPPs with varying levels of public or private responsibility The specific PPP model chosen depends on a number of factors related to the sector, the legal and regulatory environment, and the private and public sector participants’ specific economic objectives
  • #9 This chart from a Deloitte study shows the various sectors that PPPs can be applied to and the varying project forms Unsurprisingly, leading practitioners are pretty much all developed markets with deep financial markets and dynamic private sectors
  • #10 The transportation sector alone accounts for a significant share of total infrastructure needs, which McKinsey estimated at $3 trillion from 2005-2010, while the opportunities for private participation were estimated at $330 B These opportunities have become more attractive for institutional investors seeking sources of predictable revenue streams
  • #11 In developing markets, rapid economic growth in India and China in particular has necessitated huge investment in transportation, with commensurate private sector participation
  • #12 When we consider overall private investment in infrastructure, Russia has been a leader in the past decade
  • #13 Curiously, however, this hasn’t been true for the transportation sector Even when we look at private transport investment per capita or relative to GDP, it pales in comparison to other emerging economies and within Russia to other sectors
  • #14 As you might expect, therefore, transportation infrastructure in Russia is in a pretty dismal state
  • #15 Government officials have at least acknowledged this deficiency and have announced big plans for upgrades The number put forth is $1 trillion by 2020, with significant private sector involvement This is good as estimated annual needs in infrastructure investment for middle-income countries averages at 5% of GDP
  • #16 Russia has made some progress in recent years to facilitate PPPs coming to market In 2005, they passed a concession law creating a legal foundation for projects But some problems remain, such as project assets not being allowed to be pledge by the contractor to raise bank lending, and the conflict between the need for approvals annual budgetary expenditure and long-term govt commitments St. Petersburg as well, has passed its own law for non-concession based projects. It is considered to be more flexible than the federal law, which is why most of the pipelines in the project have taken place there Also, the state has diverted some of its petrodollars to create an infrastructure investment fund to attract private investment, which reached $3B in late 2008. the fund is being used to finance equity investments in up to 75% of total capital project costs or as guarantees of up to 60% of the borrowings for a particular project In 2007, the government merged 3 state-owned banks and ECAs and seeded $7.4 bn to form a new state development bank Mandate is to operate on a non-competitive basis with commercial banks to co-finance projects in ruble-denominated loans Its also supposed to act as the central PPP unit for Russia, coordinating interagency efforts to regulate PPPs and harmonize laws and practices
  • #18 Russia has a long way to go despite the fanfare in recent years Most of the deals have been large one-offs before the financial crisis hit In general, PPP “readiness” as characterized by McKinsey is quite low. This reflects relatively immature market conditions for PPPs, which carry higher risks to international investors than other countries
  • #19 The challenges are many I wont go through these all, but will highlight the lack of an effective, centralized PPP unit, the lack of a developed financial sector, the restrictiveness of the federal concession law, the lack of experience of govt institutions in project finance, and the perceived risks of dealing with the Russian govt are pretty key
  • #20 So what can Russia do? It needs to emulate the market leaders. This means nothing short of reforming the entire institutional and legal environment It has taken some steps but it’s not enough
  • #21 Part of the problem is that the economic crisis has impacted PPPs everywhere. Private investors have become more risk-averse and risky places like Russia are the first markets to be abandoned Interest rates increases have increased cost of borrowing Trade credit and access to finance has dried up due to the liquidity crises A survey by the World Bank earlier this year highlights the impact on new projects. Of the 316 projects surveyed between July 2008 and February 2009, 95% reported delays