Download as PDF, PPTX


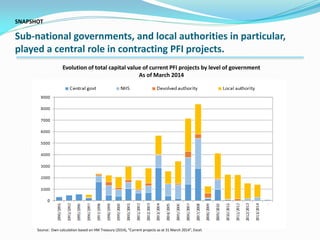
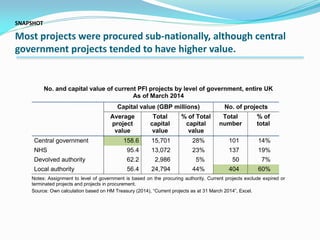
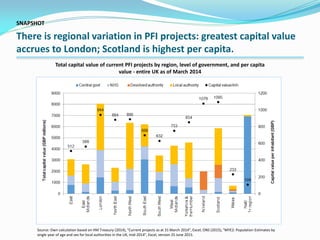

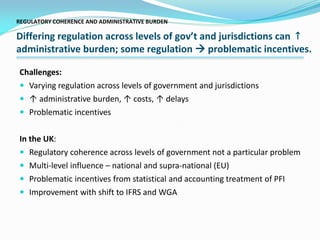

The document outlines the role of sub-national governments in managing Private Finance Initiative (PFI) projects across different levels of government in the UK, highlighting challenges such as regulatory coherence, financing, and administrative capacity. It notes that while most projects are procured sub-nationally, central projects tend to have higher capital values, with regional variations in project financing. Emerging lessons emphasize the importance of intergovernmental cooperation and the need for improved capacity and regulatory frameworks to enhance the effectiveness of PFI at local levels.


![Evolving the PFI model_ Balancing public interest and private expertise[12].pdf](https://cdn.slidesharecdn.com/ss_thumbnails/evolvingthepfimodelbalancingpublicinterestandprivateexpertise12-241030180838-bcc93b26-thumbnail.jpg?width=640&height=640&fit=bounds)


