1. Today in Science
You will Need:
1)Pencil/Pen, Colored Pencils, Highlighters or
Markers
2) One sheet of lined paper set up for Cornell
Notes
3)Log #4 – Update – Managers Log in please
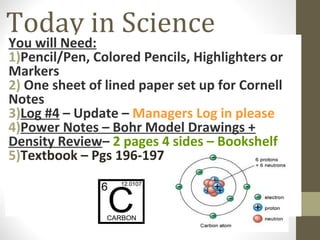
4)Power Notes – Bohr Model Drawings +
Density Review– 2 pages 4 sides – Bookshelf
5)Textbook – Pgs 196-197
2. Reminders
1. Signed and corrected test Grades online – Returned Wednesday & Due Fri.
2. Test #3 Retakes – Starts Monday 12/2
3. Power Notes- Bohr Model Drawings
Colored Pencils, Highlighters or Markers-
must highlight notes
4. Review and Reflect on Page 1 only
3. Bohr Model Drawings
The concept of elements has been around
since ancient times. We now know that
each element has its own unique number
of protons. Although each element can
have a varying amount of neutrons or
electrons, its basic characteristics,
properties and how it reacts with other
elements is basically the same.
4. Bohr Model Drawings
Neils Bohr is the scientist responsible for
the atomic model that looks very much like
our solar system. The Periodic Table not
only tells us about each individual atom
but is also set up to show us how to draw
the Bohr Model….well, at least for the first
three rows.
6. Bohr Model Drawings
The Bohr Model is helpful in not only
understanding the electron configuration
but for also understanding why and how
some elements will bond with other
elements.
8. Cornell Note Paper
Valence and the Periodic
Table
Transition Elements
Example:
1. The columns or families each
element is located in tells you
the number of valence
electrons for families 1,
2…..13,14,15,16,17 and 18
-
Elements in Family 1 have 1
valence electrons
Elements in Family 2 have 2
valence electrons
Elements in Family 13 have 3
valence electrons
2. The pattern continues up to
Family 18
3. The pattern DOES NOT occur for
the Transition elements (short
columns)
Remember:
Metals give away their electrons,
while nonmetals take.
9. Basic Configuration
Example:
1.The Periodic Table Connections
– 1st 3 rows only
-Rows = # of shells or levels
around the nucleus
-# of elements in each row = # of
electrons found on that level
Row
1=
1 shell around nucleus;
maximum of 2 electrons on shell
Row
2=
2 shells around nucleus;
maximum of 8 electrons on shell
Row
3=
3 shells around nucleus;
maximum of 8 electrons on shell
10. Lewis Dot Diagrams
1. Shows only valence electrons
2. Illustrated using ELEMENT
SYMBOL and DOTS to
represent only the valence
electrons.
Example:
Beryllium is in Family #2
3. Therefore Beryllium has a
VALENCE of 2
Be
11. Drawing the Bohr Models
and Lewis Dot Diagrams
1. Locate the element on the P.T.
2. Record the info about the
element.
3. Draw the nucleus and write the
# of each type of subatomic
particle inside.
4. Draw the correct amount of
shells outside the nucleus
based on the row #
5. Start loading electrons on the
specific shells from the inside
out.
6. Remember: YOU MUST load
each shell full before moving
farther out to the next shell.
12. Let’s try a couple:
Lithium
Row= 2
Protons = 3 +
Neutrons = 7-3=4
Electrons = 3 Lewis Dot
P = 3+
N = 4
Li
2-
1-
13. Let’s try a couple:
Oxygen
Row= 2
Protons = 8 +
Neutrons = 16-8=8
Electrons = 8 Lewis Dot
P = 8+
N = 8
O
2-
6-
14. Let’s try a couple:
Magnesium
Row= 3
Protons = 12
+
Neutrons = 2412 Electrons = 12=12
Lewis Dot
P =
12+
N = 12
Mg
2-
8-
2-
15. Today’s Tasks
1)Power Notes- Bohr Model Drawings +
Density Review– Due by Wed
2)Retakes for Test #3 – Starts Monday,
Dec. 2nd.