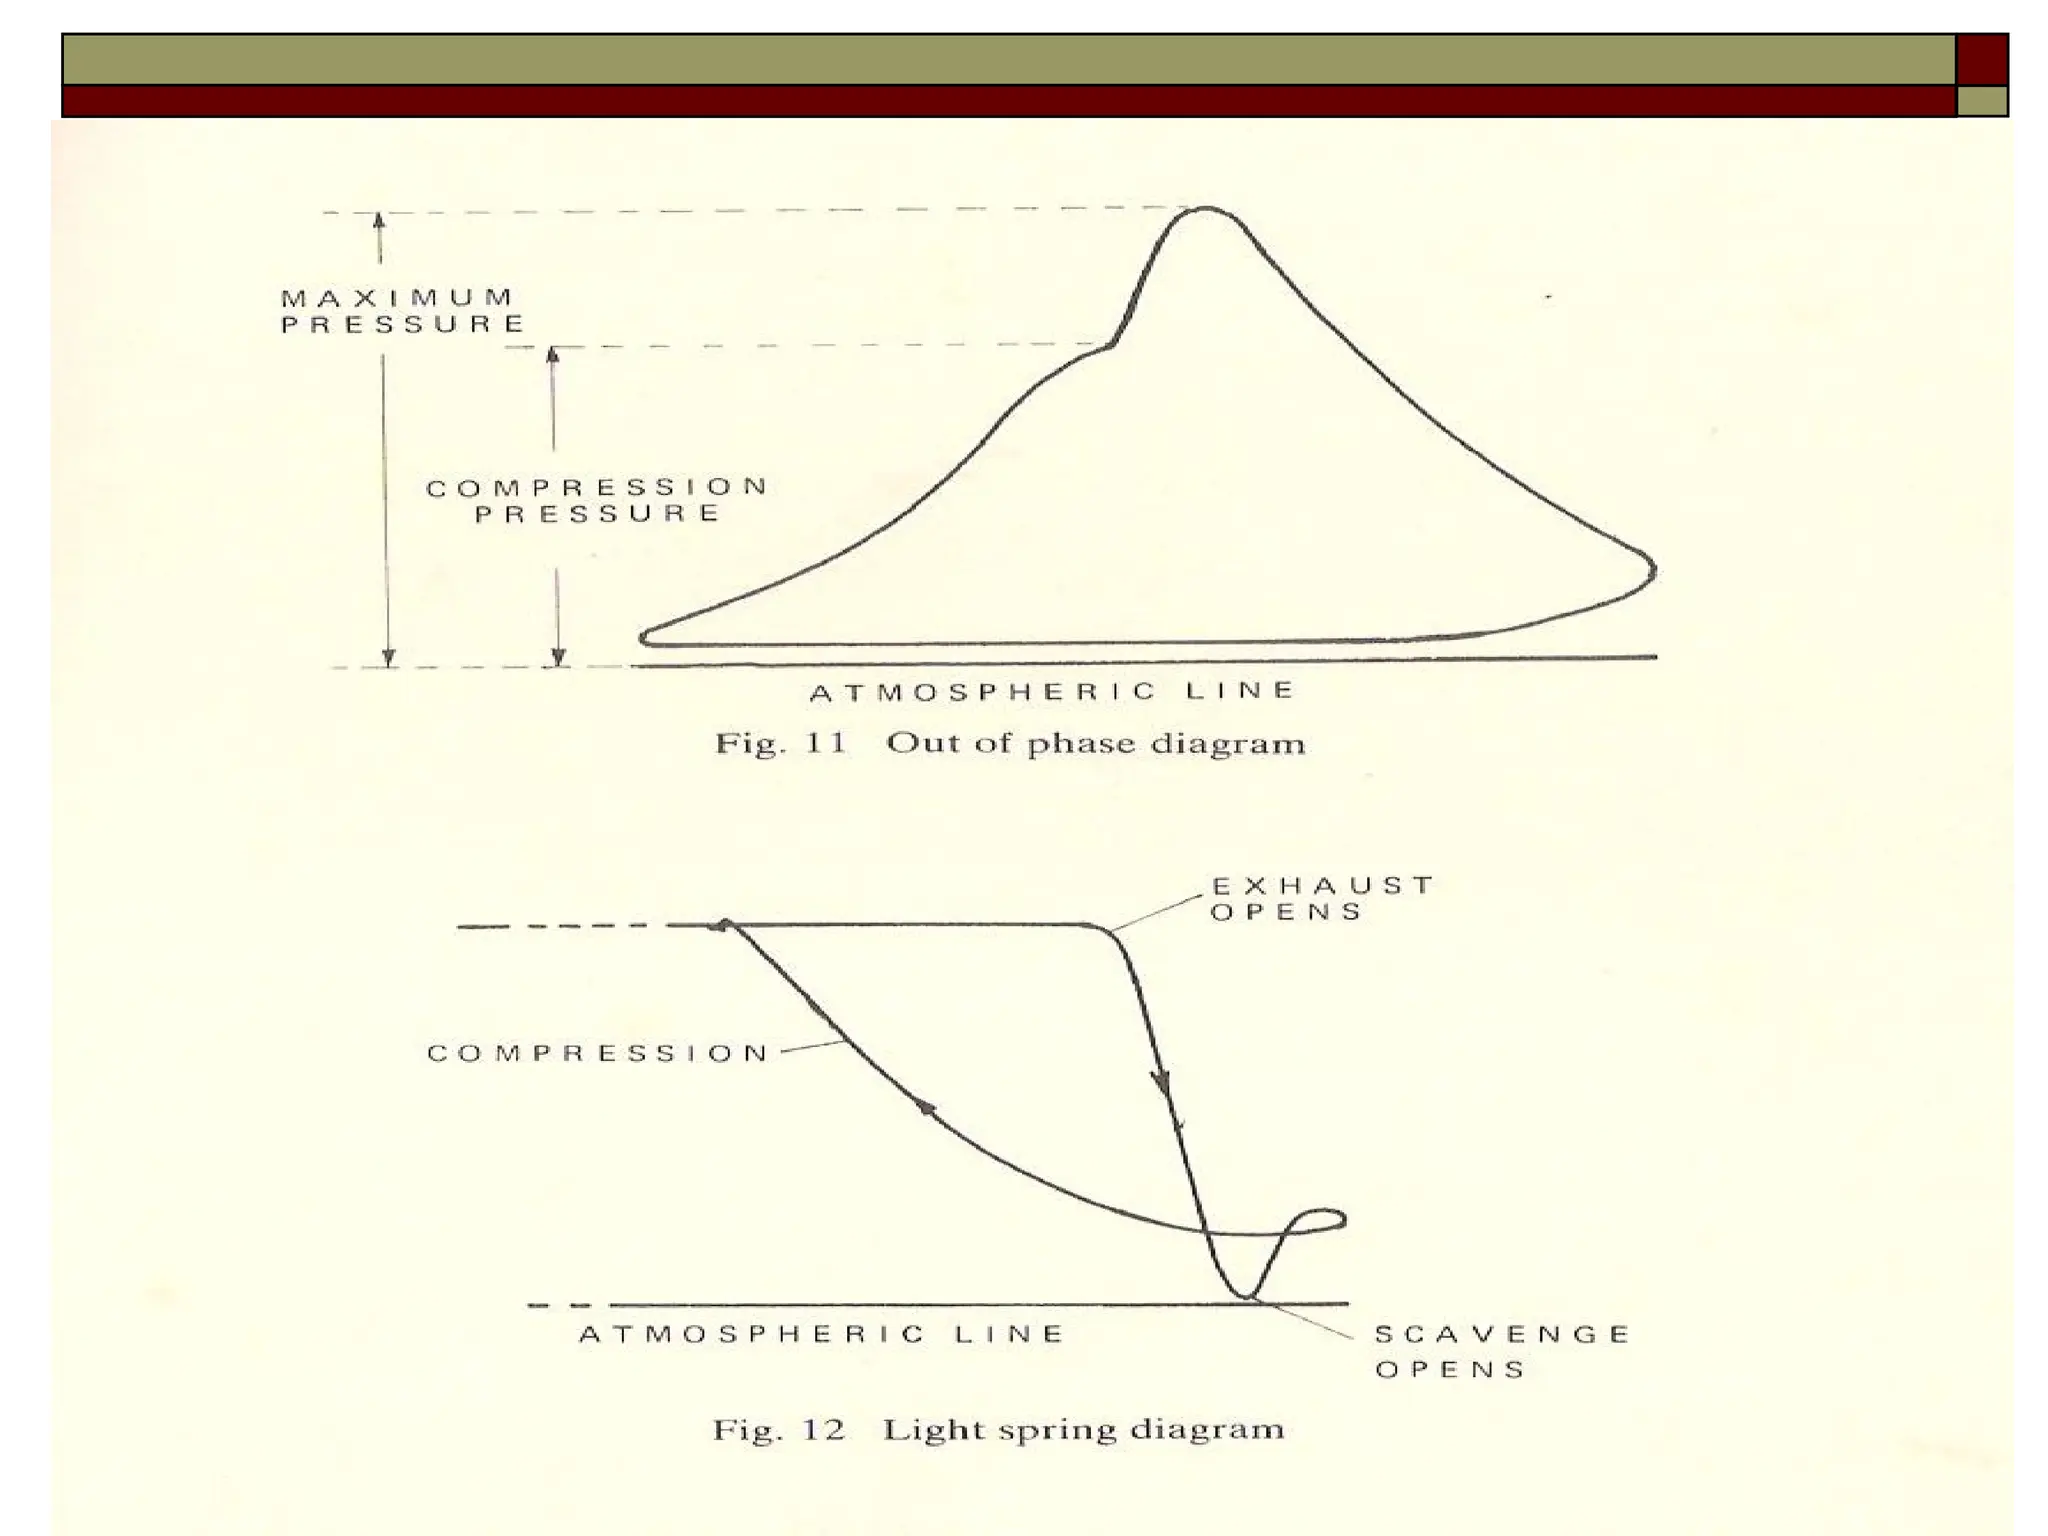
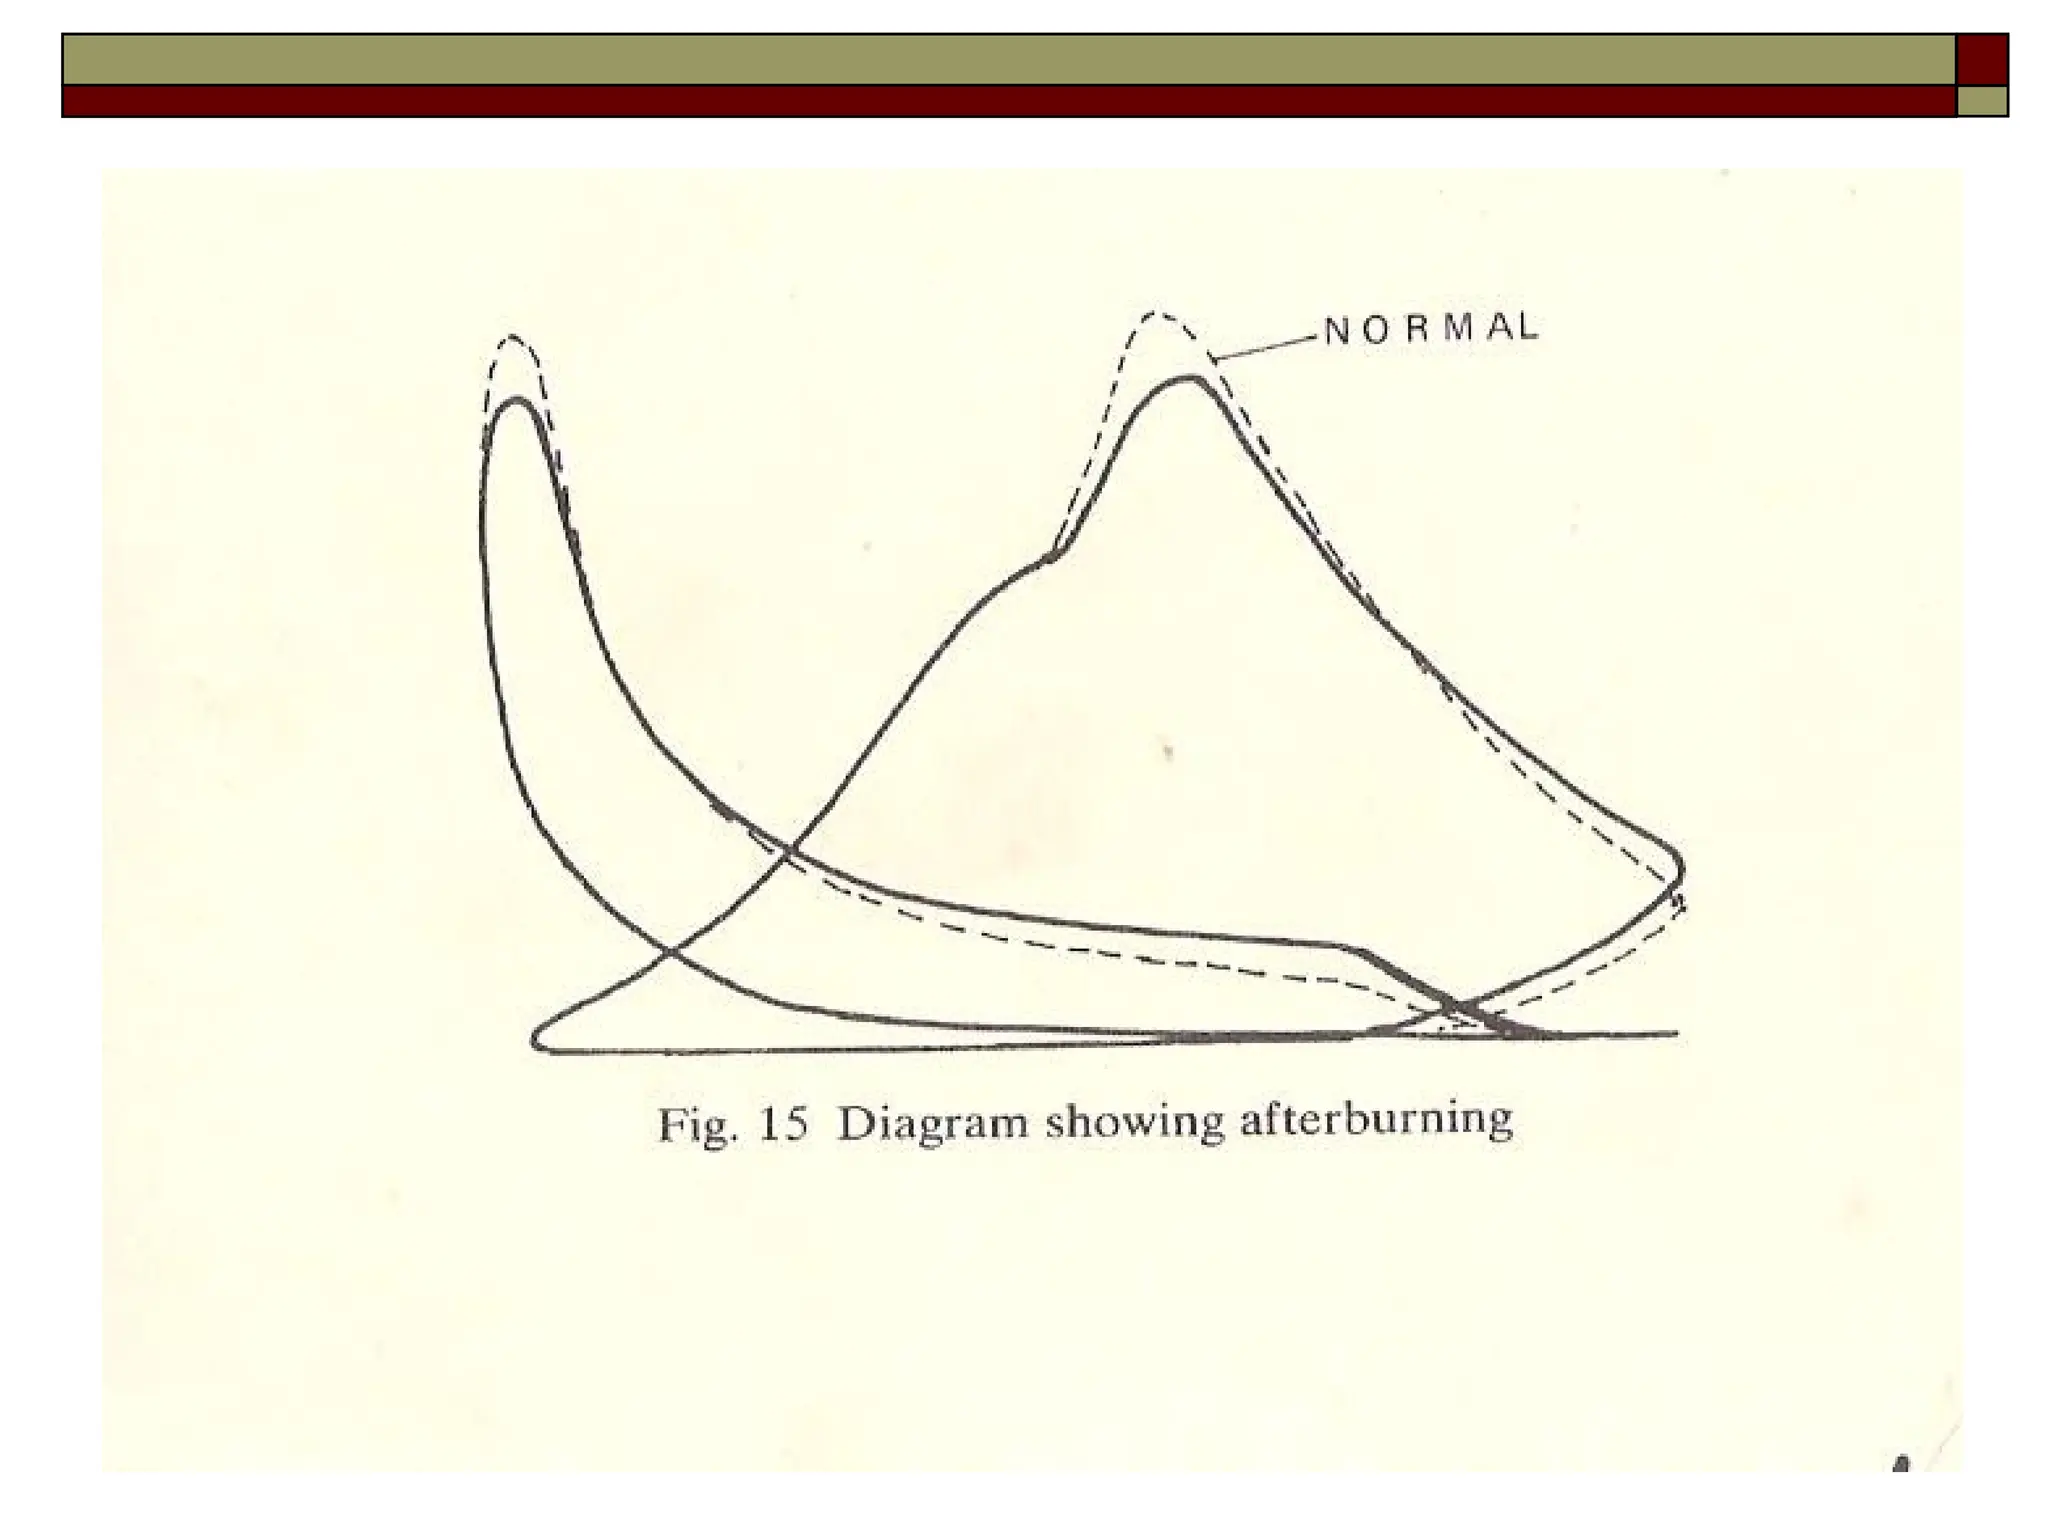
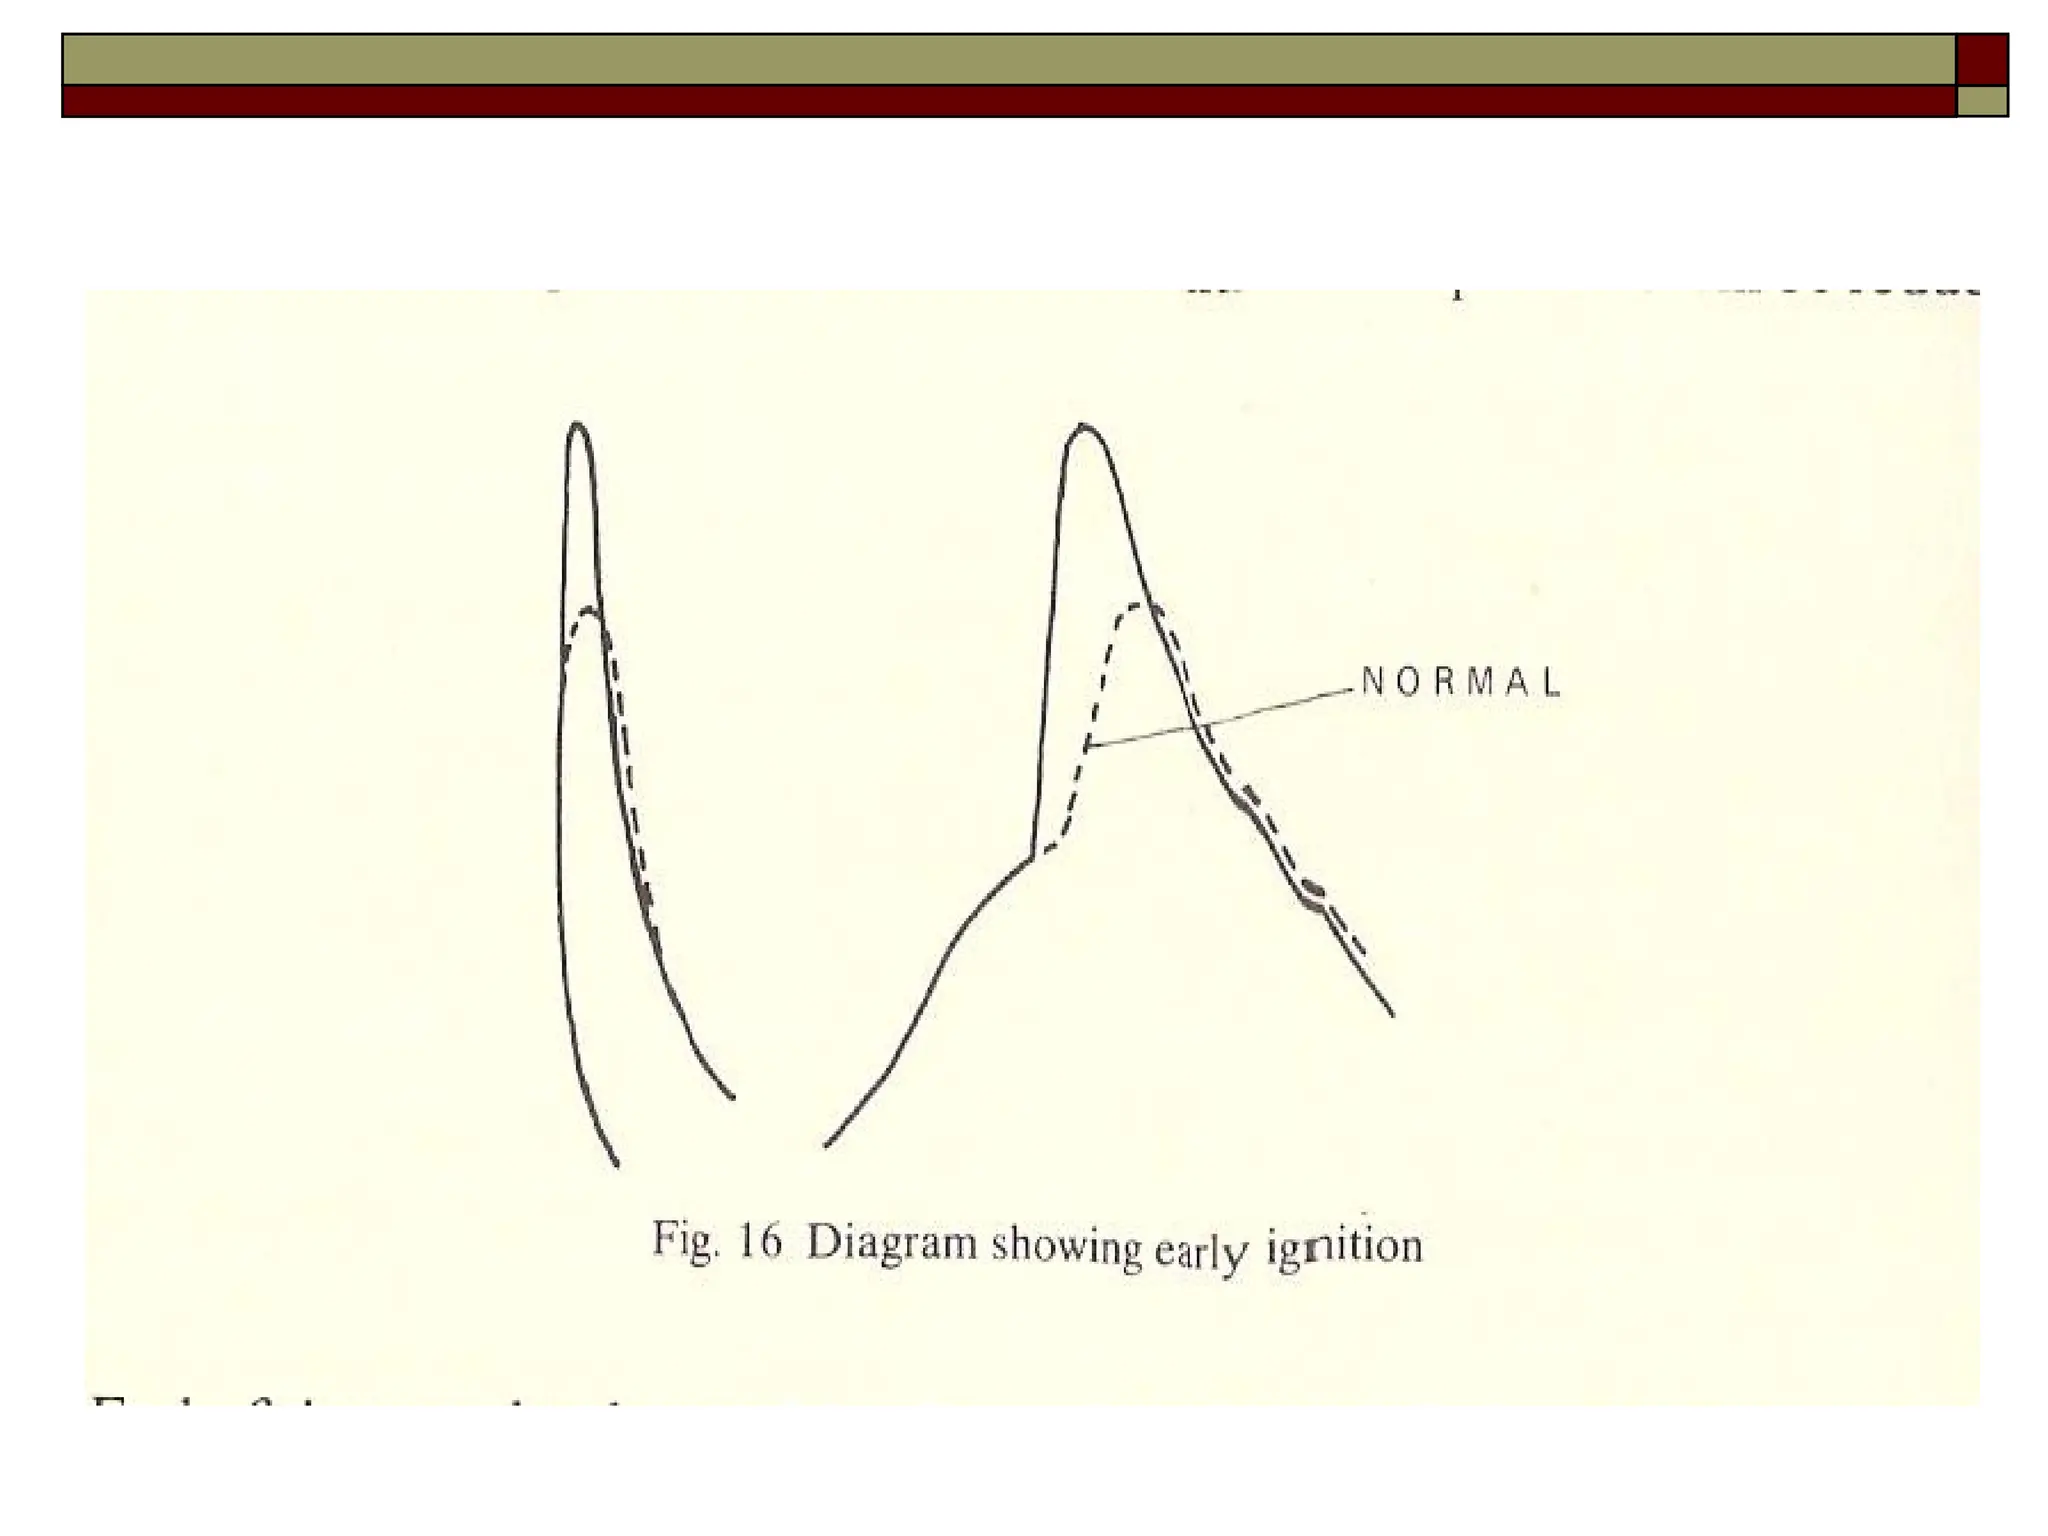
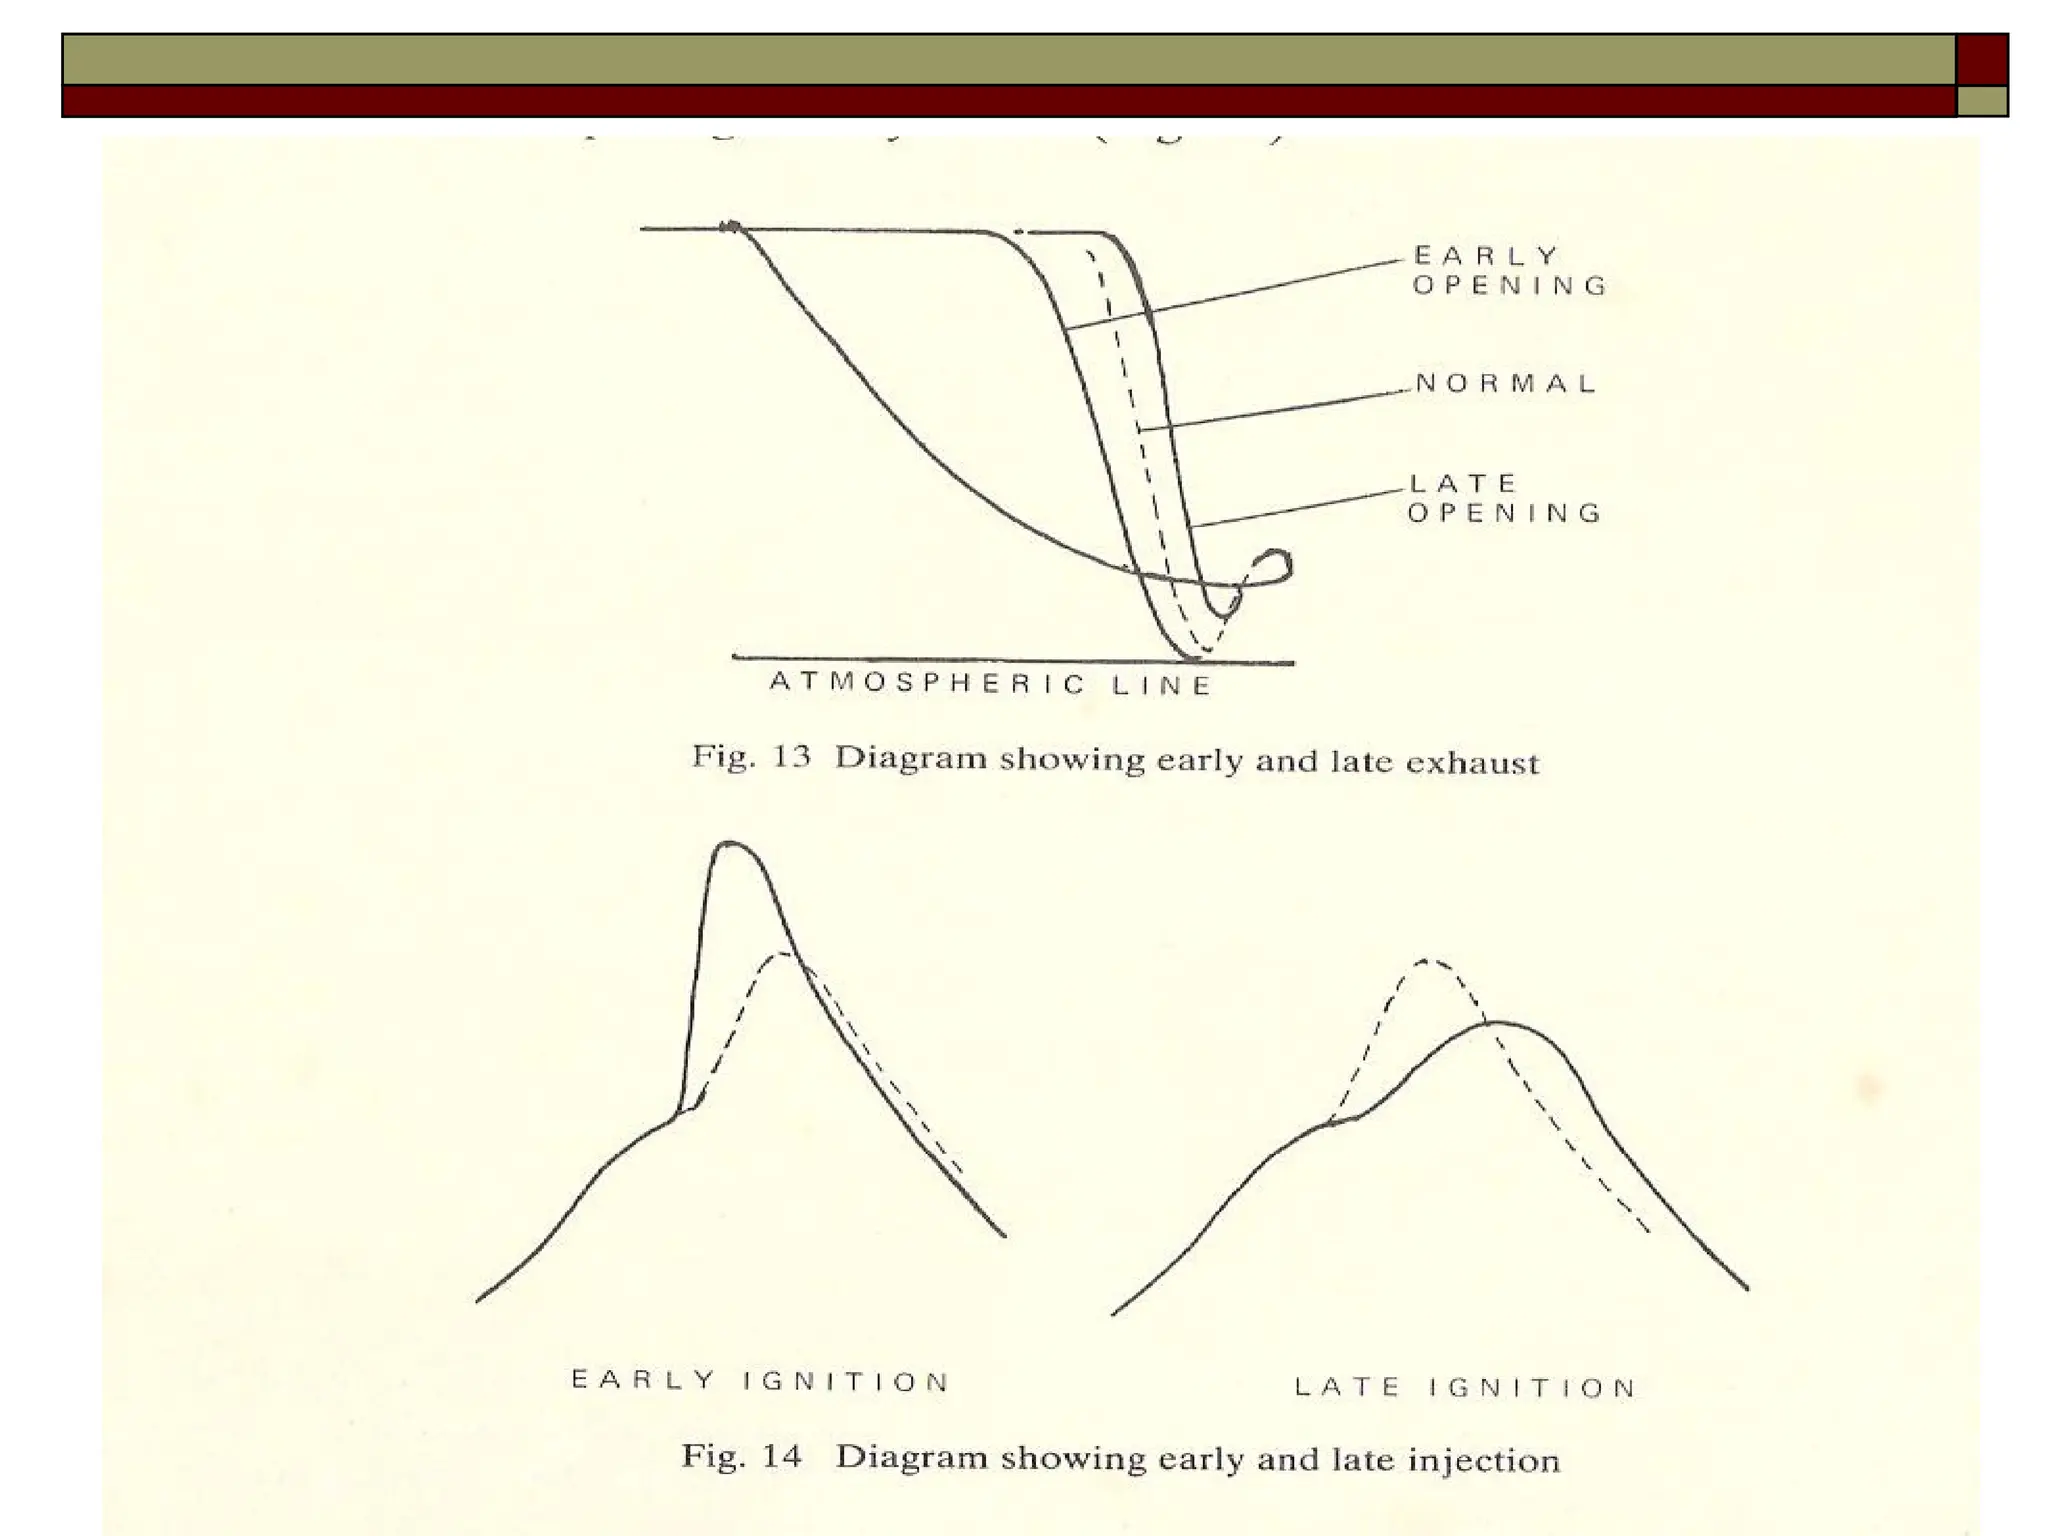
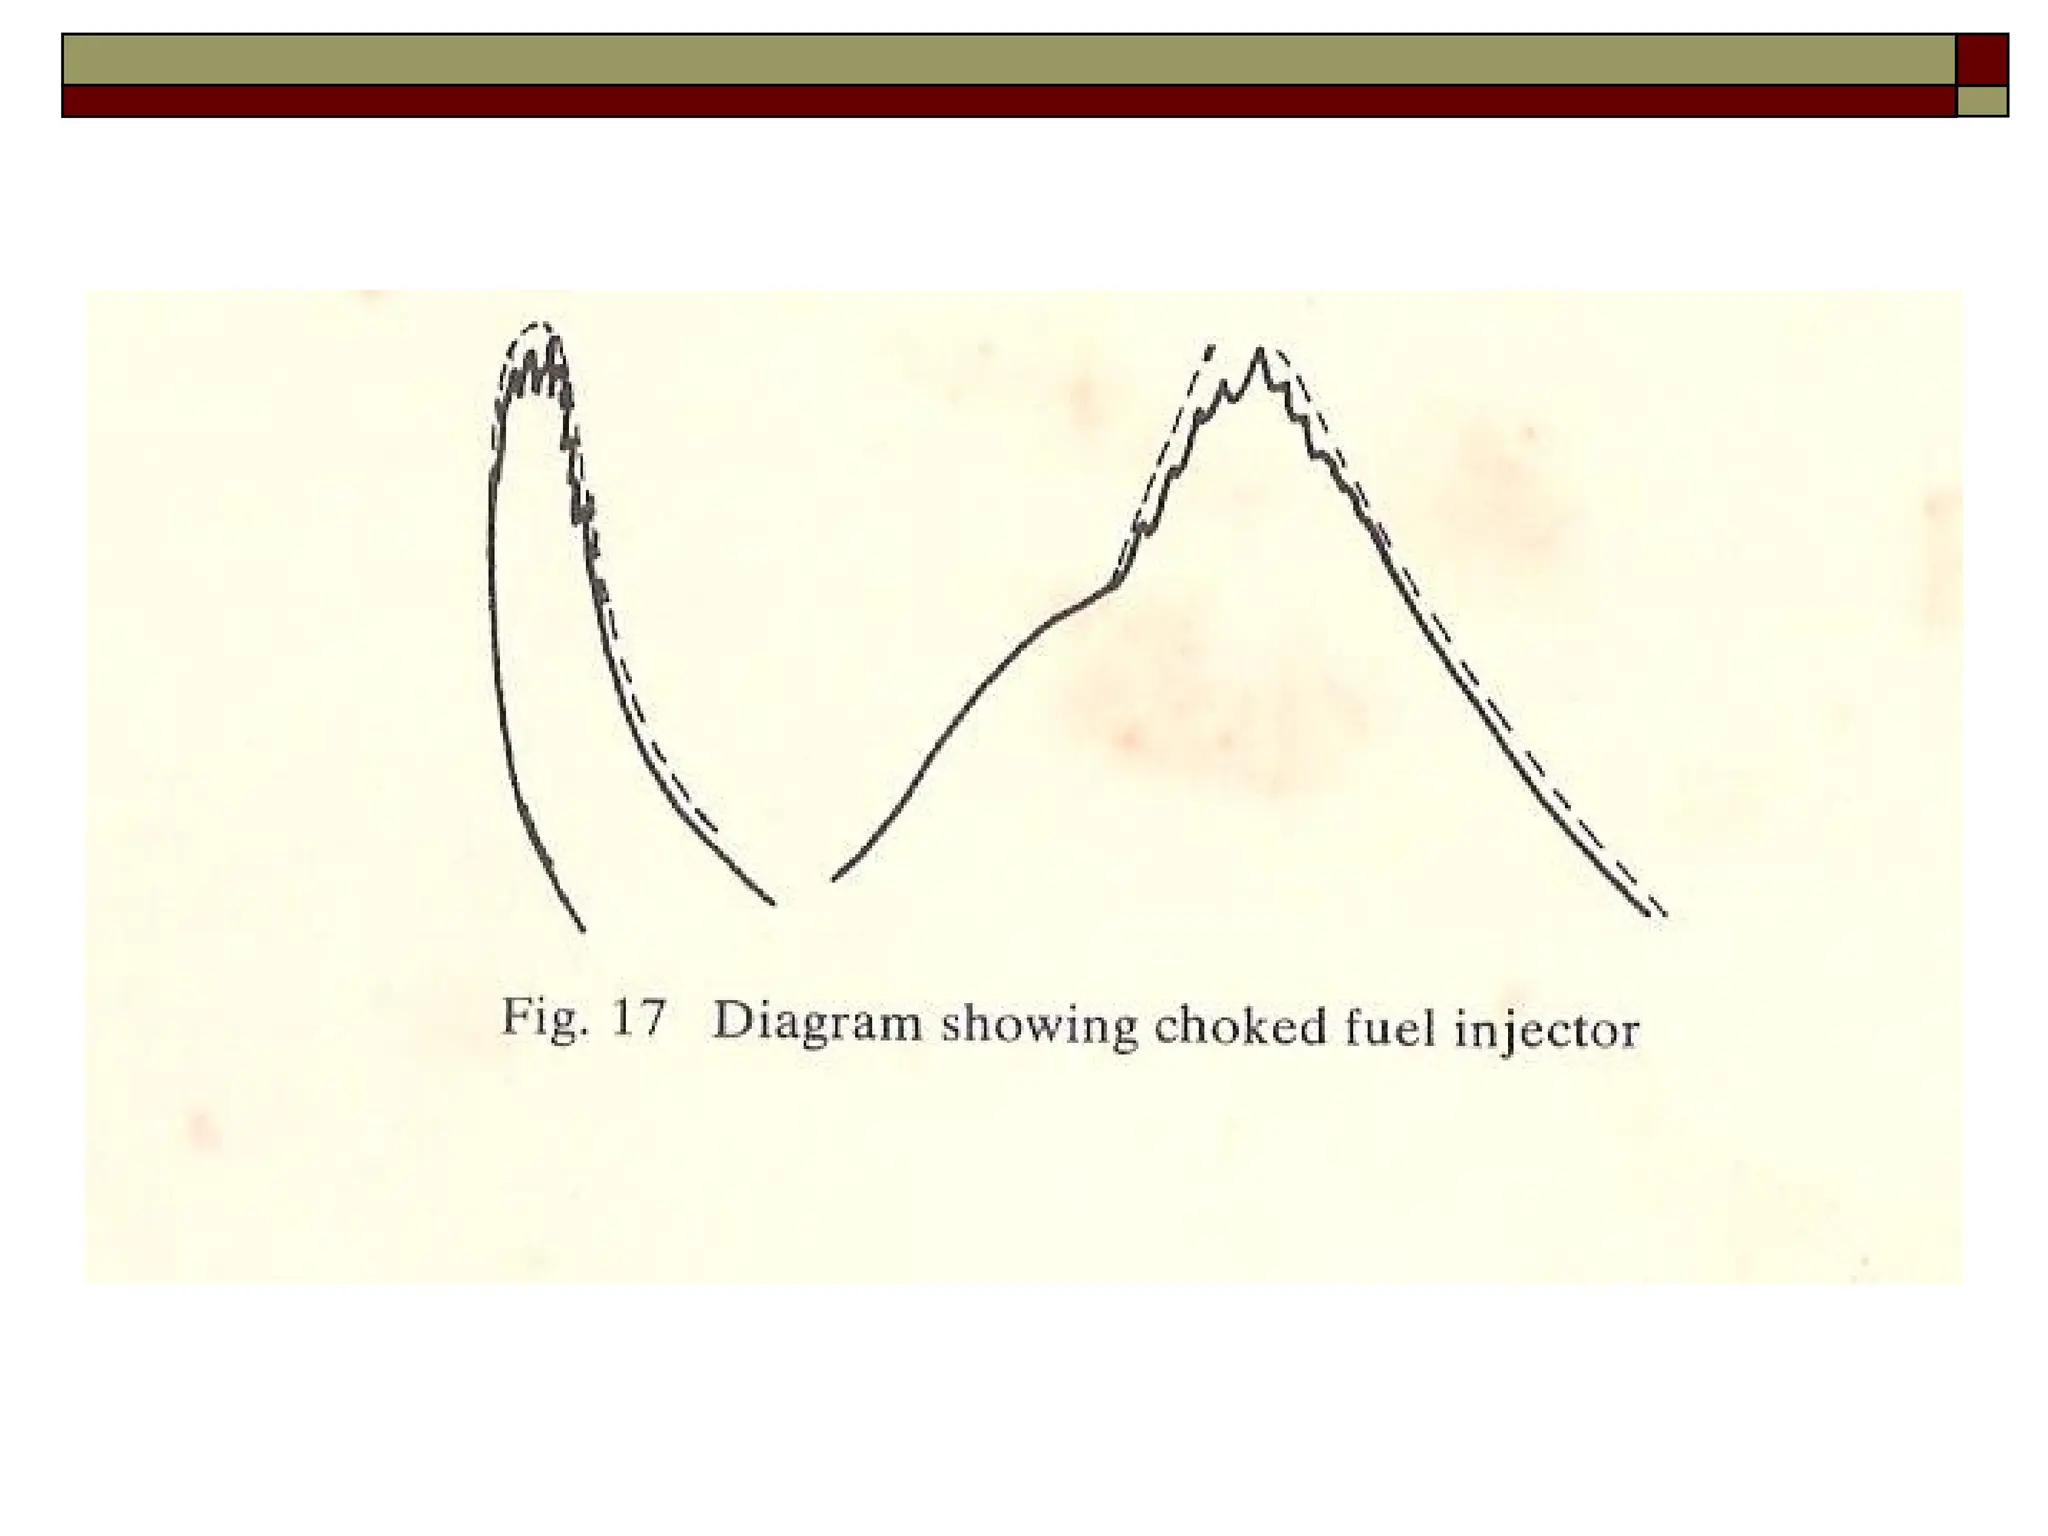
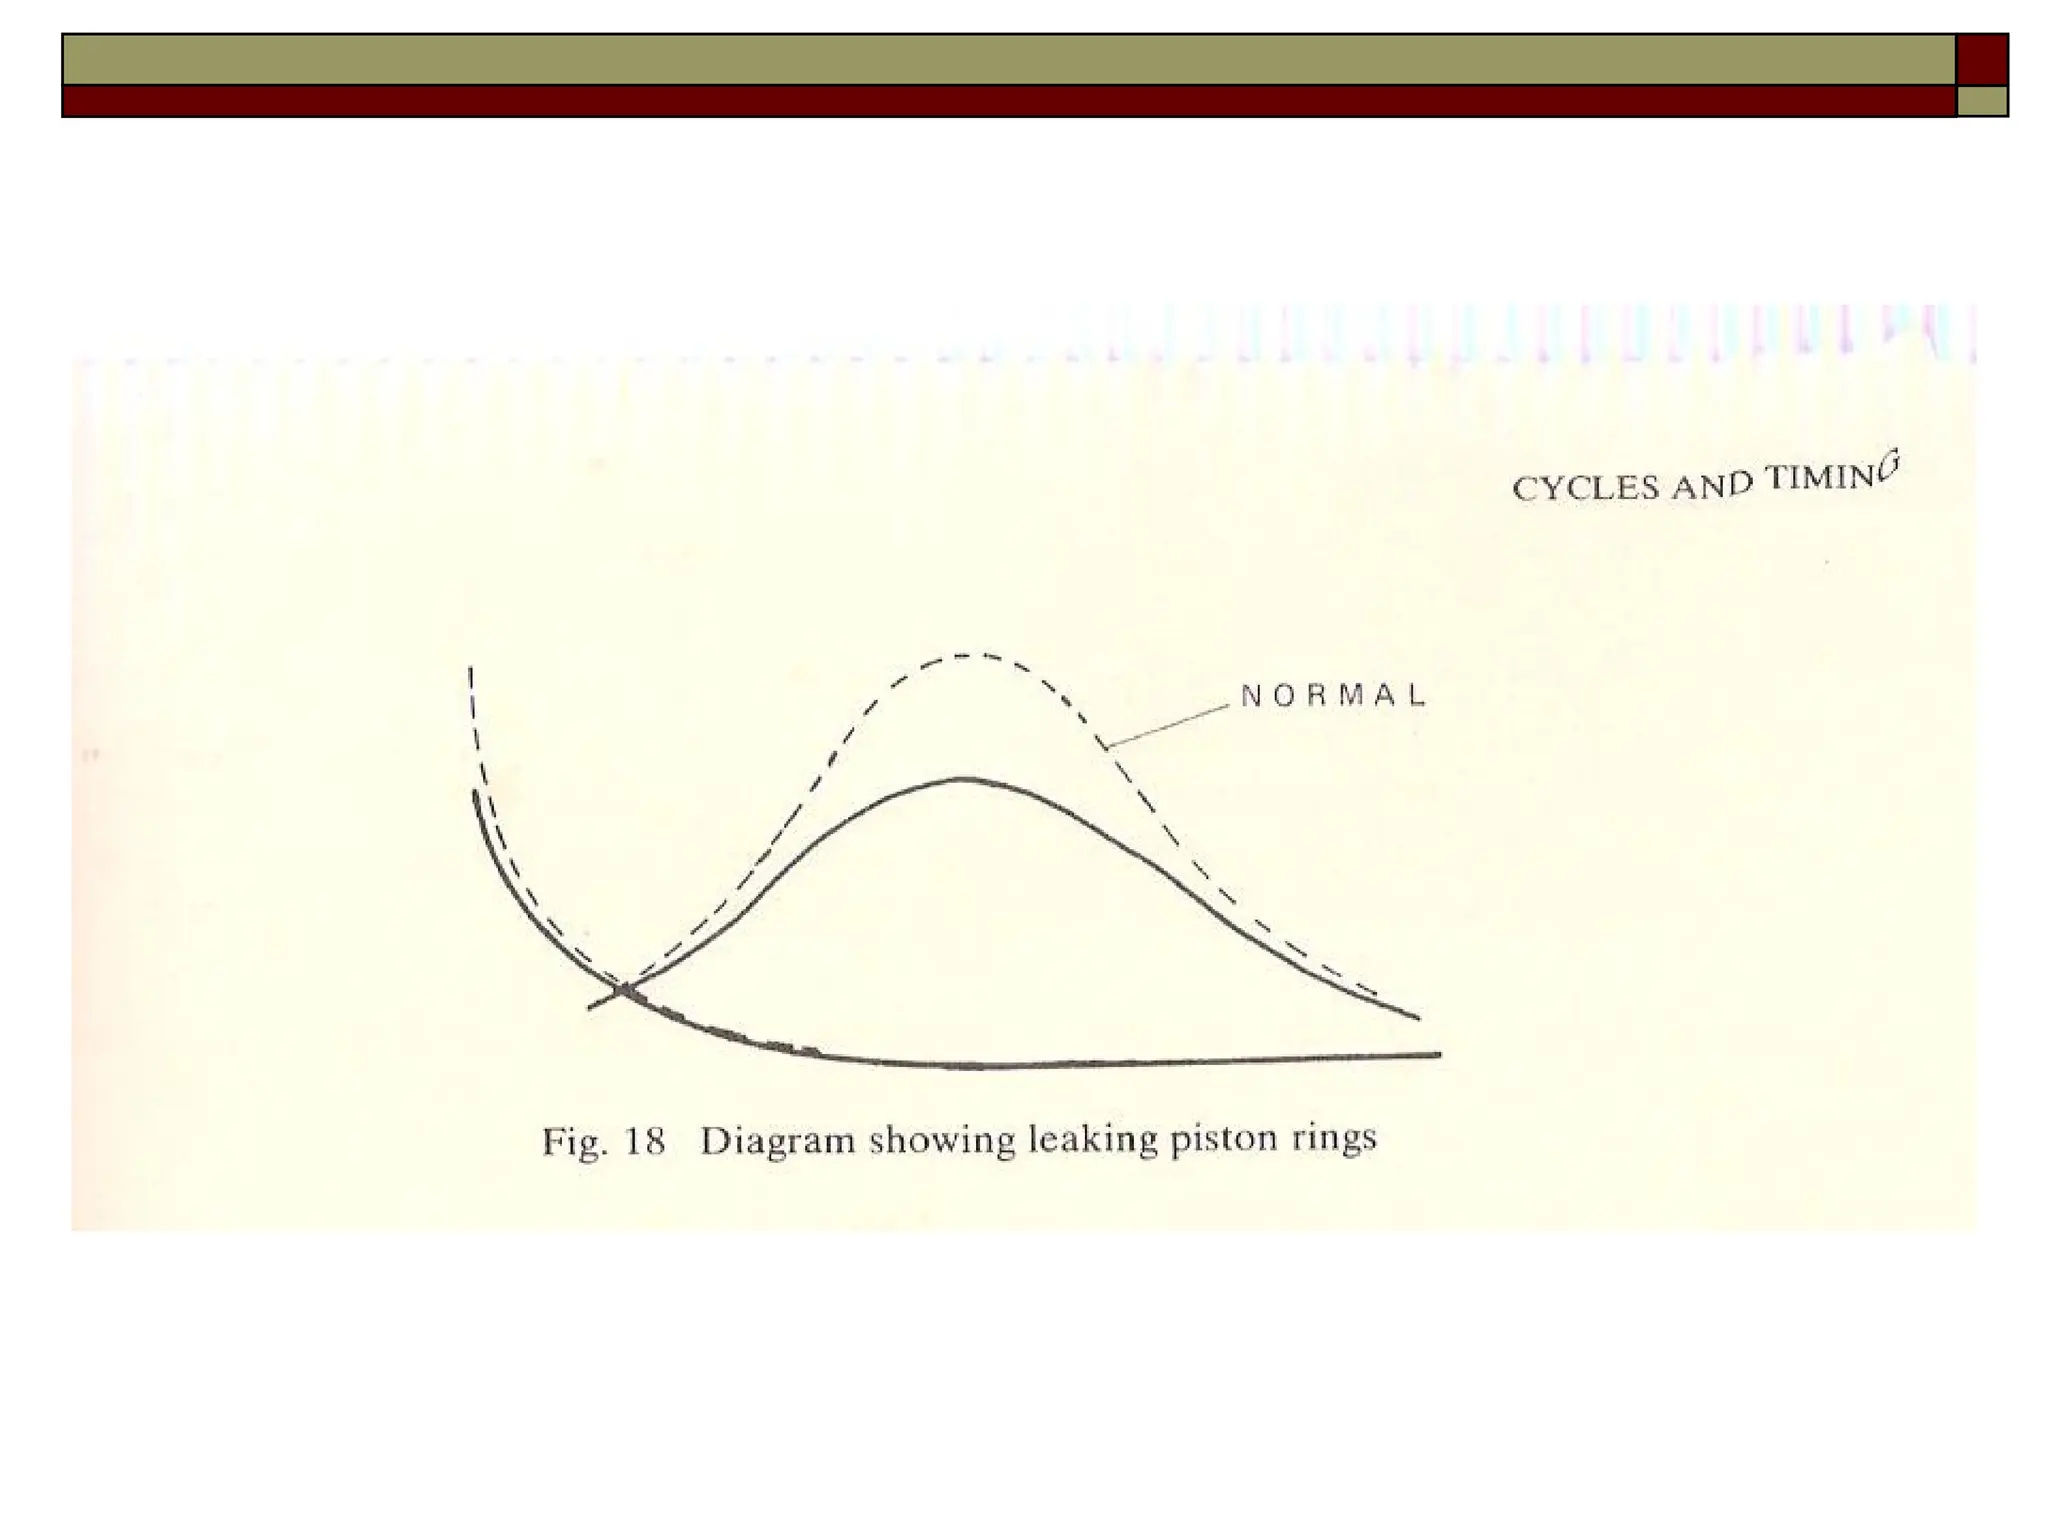
Power Measurement
 At the end of this series of lectures, you
will have an understanding of how
power generated in the marine engine is
calculated.
Nomenclature
 Mean Effective Pressure (MEP)
It is the theoretical constant pressure acting on the piston during
the power stroke.
 Mean Indicated Pressure (MIP)
It is the pressure that is acting on the piston, performs the same
work as the actual pressure in the operating cycle. It is the ratio
of work done during the working cycle to the swept volume. It is
determined graphically from a diagram or calculated from
engine parameters.
Measurement of MIP
This is done by measuring the area of the indicator diagram
using either a Planimeter or counting the area .
Nomenclature
 Measurement of MIP
This is done on board by measuring the area of the indicator
diagram (in sq.cm) and dividing it by the length of the diagram
(cm)
 Indicated Horse Power (IHP)
IHP = P.L.A.N / 4500
P = MIP in kg/sq.cm
L = Engine Stroke, in meters
A = Cross-sectional Area of one cylinder, in sq.cm
N = Speed of engine in rpm (N for 2 stroke ; N/2 for 4
stroke)
4500 = Conversion of kg-m/min to H.P in metric units.
Nomenclature
 Brake Horse Power (BHP)
It is the power output measured at the crankshaft by a brake-
dynamometer on the manufacturer’s test bed.
 Mechanical Efficiency (Value approximately 0.75 ~ 0.85)
Ratio of the brake horse power to the indicated horse power.
= BHP / IHP
 Thermal Efficiency (Value approximately 0.60)
= Heat converted to useful work / Total Heat supplied.
 Rated Power
It is the continuous effective power given by the manufacturer
for a certain rated rpm of the crankshaft, taking into account the
auxiliaries used under normal service conditions.
Nomenclature
 Gross Power
It is the continuous effective power guaranteed by the engine supplier
for an approximate rpm of the crankshaft, using a certain set of
auxiliaries used under normal service conditions without any
allowance for overload.
 Effective Power
It is the power at the output end of the engine, i.e. at the crankshaft
flange position. It is the IHP minus the mechanical losses.
= IHP x Mech. Efficiency
 Maximum Continuous Rating
It is the maximum output power for the engine running continuously
under safe conditions. This is the rating according to the contract
agreed upon.
Trials
Marine Diesel Engines are normally tested by Test-Bed Tests and
Sea Trials.
 Test Bed Trials
These include trials on the engine which is loaded by a water
brake. The following tests are done:
 Consumption Trials
 Starting and Reversing Trials
 Running Astern Trials
 Increased torque trials
 Sea Trials
The sea trial tests are performed on new ships to check the ship’s
performance conforming to acceptable standards specified by the
manufacturer:
Trials
 Lots of trails are carried out in this, the main one being the
Official Test which is carried out in the open sea.The following
tests are carried out:
 Consumption test, Overload Test
 Guarantee speed test between two fixed points at maximum
continuous rated power.
 Cylinder Cut-out test ; Minimum number of units firing test
 Astern running test, Noise Measurement Test etc etc.
 Calculations are done using these numerous tests and power, load
etc calculations are done. The Load Diagram, Propeller Curve etc
are drawn.
Indicator Diagrams
 To enable the evaluation of the power developed in each engine
cylinder
 To highlight conditions during the fuel injection, combustion and
after-burning.
 To highlight conditions prevailing in the cylinder during the
scavenge/exhaust gas exchange process.
 To show the pressure variations in the cylinder with respect to
piston displacements.
 An indicator diagram can be obtained from a diesel engine during
its operation by the use of an engine indicator. We can take a p-v
diagram from the conditions within the cylinder. Similar
diagrams can be taken from each cylinder of the engine.
Indicator Diagram – Two Stroke
Indicator Diagram – Four Stroke
Indicator Instrument
Indicator Diagrams
Indicator Diagrams
 The indicator cock/valve of the chosen cylinder is first blown
through with the engine running at its max rpm / max M.C.R.
The weather and sea condition should be calm and the propeller
slip should be positive with slip as low as possible.
 After blowing through, the cock is shut and indicator connected
to the cylinder. The cord on the drum is attached to some form of
engine stroke mechanism from the crosshead or cam.
 The cock is now opened and the indicator pen is held against the
card wrapped round the drum, tracing a diagram for one cycle of
the engine.
 Pressure is recorded on the ‘y’ axis according to the stiffness of
ths spring. Corresponding cylinder swept volume is recorded on
the ‘x’ axis due to the rotation of the drum by its cord.
Indicator Diagrams
 By turning the indicator cock to a vent position, a horizontal line
representing the atmospheric pressure is added to the diagram.
This can act as a pressure datum line.
 Four types of cards can be obtained from a slow running engine.
 Power Card: taken with the indicator drum in phase with the
piston movement. The area inside represents the work done
during the cycle to scale. This may be used to calculate the power
produced or the MIP for the cylinder. Irregularities in the shape
of the diagram will show operational faults. Maximum or peak
pressure may be measured to scale between the atmospheric line
and the highest point on the diagram.
Indicator Diagrams
 Compression Diagram: This is taken in a similar manner to the
power card but with the fuel shut off from the cylinder. The height
of the diagram shows maximum compression pressure. If
compression and expansion lines coincide, it shows that the
indicator is correctly synchronized with the engine. Reduction in
the height of the diagram shows low compression which may be
due to a worn cylinder liner, faulty piston rings, insufficient
scavenge air or leaky exhaust valve, any of which will cause poor
combustion.
 Draw card or out-of-phase diagram: Taken in a similar manner
to the power card, with the fuel pump engaged but with the
indicator drum 900
out of phase with piston stroke. This illustrates
more clearly the pressure changes during fuel combustion.
Indicator Diagrams
 Light Spring Diagram: Again similar to the power card and in
phase with the engine, but this diagram is taken with a light
compression spring fitted to the indicator showing pressure
changes during exhaust and scavenge to an enlarged scale. It can
be used to detect faults in these operations.
 Provided the cycle operations are correct, power balancing of an
engine can be carried out by comparing power diagrams, or MIP,
from each cylinder.
 Fuel pump controls can be adjusted to increase or decrease the
quantity of fuel injected into each cylinder and this in turn will
raise or lower the power produced within the cylinder. Such
adjustments may be carried out to obtain equal power from each
cylinder, in which case the area of each power card will be equal.
Indicator Diagrams
 Steady running conditions must be maintained while power
balancing is carried out.
 Exhaust temperatures should be noted during power balancing
since a limiting exhaust temperature may make complete
balancing difficult.

Notes - Indicator Diagrams
 While an engine is running at sea, valve or fuel injection timings
can only be checked by instrumentation. Incorrect timings will
affect power output and exhaust temperatures and provided these
are normal and no other irregularities occur, it can be assumed
that engine timing is correct.
 Exhaust valve setting on a slow running engine can be checked
by means of a light spring indicator diagram. This will not give
an accurate timing check but by comparison with a normal
diagram or one taken during original engine trials, it may be seen
if valve opening early or late.
 Fuel injection timing can be checked by means of power and
draw cards taken from cylinder. The draw card particularly will
illustrate early or late injection. This does not show the actual
Notes - Indicator Diagrams
time injection commences but that at which ignition takes place.
 Provided the fuel is in correct condition and the injector
operating normally, the time between injection and ignition is
almost constant. It may be possible to obtain needle lift diagrams
from the fuel injectors, these give accurate timing but not many
engines have facilities for taking them.
 Accurate timing checks, measurements of clearances,
adjustments, inspection and testing of parts can be only carried
out while engine is out of service.
 The limitations of the mechanical indicator is its inability to
compare the output, without which any trouble-shooting of faults
is not possible.
Indicator Diagrams
 In many modern engines sophisticated measuring devices may be
fitted to record cylinder pressures,
 There are portable indicators which can store data that can be
down-loaded to PCs for further analysis.
 There are several advantages to electronic devices, such as
elimination of errors due to mechanical springs (used in
conventional indicators) which limit the use to slow speed
engines.
 Calculation of indicated power, specific fuel consumption, peak
pressure, compression pressure on is done by the microprocessor
and is easy to obtain and accurate.
Indicator Diagrams
Indicator Diagrams
 The T.D.C. position of NO.1 unit is sensed by some type of
sensor, usually located close to the flywheel, and which passes on
the data to the unit.
 Typical faults can be easily traced, such as faults in the injectors,
loss of compression pressure due to broken piston rings or ovality
of liner, or choked scavenge inlet ports.
 The most commonly used software is called the PREMET which
freezes the condition inside, readily calculates the power
developed per cylinder, total power and also enables super-
imposing diagrams of various units are on each other allowing
comparison and fault finding.
Fault Finding - Afterburning
 Afterburning: refers to the slow or late burning of fuel which
takes place during the expansion stroke of the engine cycle. It
causes loss of power, since the fuel is not burned at the correct
moment to transmit energy to the piston effectively. Combustion
may still be incomplete when exhausting takes place and the heat
energy remaining, with the un-burnt fuel, will be lost. Exhaust
gases will be at a high temperature and will contain black smoke
from incomplete combustion. There will be also a higher pressure
of gas at blow down which will increase pulsating in the exhaust
manifold.
Fault Finding - Afterburning
 Detection: by loss in power, high exhaust gas temperature with
smoke. Confirmed by taking power and draw cards. These show
an increase in depth of diagram towards end of expansion
together with late or slow ignition. Due to loss of power there
will be a reduction in engine efficiency due to afterburning. It
may cause burning in the exhaust valves and fouling of the
exhaust gas system including turbo-chargers. These in turn may
give rise to surging of turbo-charger and possible fires in the
uptakes. There will be also an corresponding drop in scavenge
efficiency and higher cyl temps which make liner lubrication
difficult.
Fault Finding - Afterburning
 Causes: causes of afterburning may be incorrect fuel pump
timing, faulty fuel injector, heavy fuel oil temperature too low,
lack of scavenge air or poor combustion.
 Remedies: correct fuel timing by adjusting the fuel pump / fuel
cam or clearance, change fuel injector, maintain fuel temperature
for correct viscosity, clean scavenge ports and turbo-charger. It
should be noted that low fuel temperature and lack of scavenge
air (apart from chocked ports) will affect all cylinders of the
engine.
Fault Finding – Early firing
 Early firing in a cylinder will cause a very high peak pressure at
about the TDC of the piston. This will cause a heavy shock load
to be transmitted to the bearings with a corresponding knock
form the engine. Thermal efficiency will be increased, power will
be raised but exhaust temperature reduced.
 Early firing can be detected by the engine knock and can be
confirmed by an indicator diagram power card which shows a
high peak pressure. It may be caused by early injection, incorrect
fuel conditions, overheated parts such as a hot piston, or even a
scavenge fire causing local heat.
 Remedies include checking and correcting fuel pump timing,
correct fuel temp, cooling of working parts. If not corrected,
shock loads can lead to damage or failure of bearings.
Fault Finding – Chocked Fuel Valve
 May be due to contamination in the fuel in which debris may
choke up the small atomizer holes in the injector. Alternatively it
may be caused by a leaky injector allowing hot gas to blow back
into the injector causing carbon to form and choke the injector.
Overheating of injector nozzle may also cause build-up of
carbon. There will be a loss of engine power. There will probably
be hammering in fuel pipes between fuel pumps and injector and
this may lead to rupture of fuel pipe. A chocked valve can be
confirmed by indicator diagram power and draw cards and
reduced exhaust temperature.
 The remedy is to change the fuel injector, clean the fuel system
and ensure correct centrifuging and filtering of fuel, and maintain
correct fuel valve cooling temperature.
Fault Finding – Leaky Piston Rings
 Detected by poor combustion together with blow past of hot
combustion gases. There will be a loss in engine power with the
possibility of afterburning with the corresponding high exhaust
temperature and smoke. It will cause high rate of cylinder liner
wear due to poor lubrication, and may cause scavenge fires due
to fouling of scavenge spaces. There is also a risk of seized piston
due to local overheating. There will be low compression and
consequently poor combustion. A compression diagram will
show this.
 May be caused by excessive cylinder liner wear; lack of cylinder
lubrication; worn/broken/stuck/poorly maintained piston rings.
Fault Finding – Leaky Piston Rings
 Worn piston ring groove landings also allow rings to cant and
jam; carbon jamming rings in grooves. Gets aggravated if engine
is overloaded.
 Remedy is to gauge cylinder liner and renew if necessary;
overhaul piston; clean ring grooves and gauge them; machine or
fit new groove inserts as necessary, and renew piston rings with
correct clearances. Maintain cylinder lubrication and avoid
overload.
Questions
 What are indicator diagrams? How do they help us?
 Define the following terms: MIP, MEP, IHP, BHP
 Define the following terms: Rated Power, Gross Power, MCR
and effective power.
 Sketch and describe a draw and power card.
 Draw and explain by indicator diagram – Leaky Piston Rings.
 Draw and explain by indicator diagram – Choked Fuel Valve.
 Draw and explain by indicator diagram – Early Firing.
 Draw and explain by indicator diagram – After Burning.

Power Measurement in ships...............

  • 1.
  • 2.
     At theend of this series of lectures, you will have an understanding of how power generated in the marine engine is calculated.
  • 3.
    Nomenclature  Mean EffectivePressure (MEP) It is the theoretical constant pressure acting on the piston during the power stroke.  Mean Indicated Pressure (MIP) It is the pressure that is acting on the piston, performs the same work as the actual pressure in the operating cycle. It is the ratio of work done during the working cycle to the swept volume. It is determined graphically from a diagram or calculated from engine parameters. Measurement of MIP This is done by measuring the area of the indicator diagram using either a Planimeter or counting the area .
  • 4.
    Nomenclature  Measurement ofMIP This is done on board by measuring the area of the indicator diagram (in sq.cm) and dividing it by the length of the diagram (cm)  Indicated Horse Power (IHP) IHP = P.L.A.N / 4500 P = MIP in kg/sq.cm L = Engine Stroke, in meters A = Cross-sectional Area of one cylinder, in sq.cm N = Speed of engine in rpm (N for 2 stroke ; N/2 for 4 stroke) 4500 = Conversion of kg-m/min to H.P in metric units.
  • 5.
    Nomenclature  Brake HorsePower (BHP) It is the power output measured at the crankshaft by a brake- dynamometer on the manufacturer’s test bed.  Mechanical Efficiency (Value approximately 0.75 ~ 0.85) Ratio of the brake horse power to the indicated horse power. = BHP / IHP  Thermal Efficiency (Value approximately 0.60) = Heat converted to useful work / Total Heat supplied.  Rated Power It is the continuous effective power given by the manufacturer for a certain rated rpm of the crankshaft, taking into account the auxiliaries used under normal service conditions.
  • 6.
    Nomenclature  Gross Power Itis the continuous effective power guaranteed by the engine supplier for an approximate rpm of the crankshaft, using a certain set of auxiliaries used under normal service conditions without any allowance for overload.  Effective Power It is the power at the output end of the engine, i.e. at the crankshaft flange position. It is the IHP minus the mechanical losses. = IHP x Mech. Efficiency  Maximum Continuous Rating It is the maximum output power for the engine running continuously under safe conditions. This is the rating according to the contract agreed upon.
  • 7.
    Trials Marine Diesel Enginesare normally tested by Test-Bed Tests and Sea Trials.  Test Bed Trials These include trials on the engine which is loaded by a water brake. The following tests are done:  Consumption Trials  Starting and Reversing Trials  Running Astern Trials  Increased torque trials  Sea Trials The sea trial tests are performed on new ships to check the ship’s performance conforming to acceptable standards specified by the manufacturer:
  • 8.
    Trials  Lots oftrails are carried out in this, the main one being the Official Test which is carried out in the open sea.The following tests are carried out:  Consumption test, Overload Test  Guarantee speed test between two fixed points at maximum continuous rated power.  Cylinder Cut-out test ; Minimum number of units firing test  Astern running test, Noise Measurement Test etc etc.  Calculations are done using these numerous tests and power, load etc calculations are done. The Load Diagram, Propeller Curve etc are drawn.
  • 9.
    Indicator Diagrams  Toenable the evaluation of the power developed in each engine cylinder  To highlight conditions during the fuel injection, combustion and after-burning.  To highlight conditions prevailing in the cylinder during the scavenge/exhaust gas exchange process.  To show the pressure variations in the cylinder with respect to piston displacements.  An indicator diagram can be obtained from a diesel engine during its operation by the use of an engine indicator. We can take a p-v diagram from the conditions within the cylinder. Similar diagrams can be taken from each cylinder of the engine.
  • 10.
  • 11.
  • 12.
  • 13.
  • 15.
    Indicator Diagrams  Theindicator cock/valve of the chosen cylinder is first blown through with the engine running at its max rpm / max M.C.R. The weather and sea condition should be calm and the propeller slip should be positive with slip as low as possible.  After blowing through, the cock is shut and indicator connected to the cylinder. The cord on the drum is attached to some form of engine stroke mechanism from the crosshead or cam.  The cock is now opened and the indicator pen is held against the card wrapped round the drum, tracing a diagram for one cycle of the engine.  Pressure is recorded on the ‘y’ axis according to the stiffness of ths spring. Corresponding cylinder swept volume is recorded on the ‘x’ axis due to the rotation of the drum by its cord.
  • 16.
    Indicator Diagrams  Byturning the indicator cock to a vent position, a horizontal line representing the atmospheric pressure is added to the diagram. This can act as a pressure datum line.  Four types of cards can be obtained from a slow running engine.  Power Card: taken with the indicator drum in phase with the piston movement. The area inside represents the work done during the cycle to scale. This may be used to calculate the power produced or the MIP for the cylinder. Irregularities in the shape of the diagram will show operational faults. Maximum or peak pressure may be measured to scale between the atmospheric line and the highest point on the diagram.
  • 17.
    Indicator Diagrams  CompressionDiagram: This is taken in a similar manner to the power card but with the fuel shut off from the cylinder. The height of the diagram shows maximum compression pressure. If compression and expansion lines coincide, it shows that the indicator is correctly synchronized with the engine. Reduction in the height of the diagram shows low compression which may be due to a worn cylinder liner, faulty piston rings, insufficient scavenge air or leaky exhaust valve, any of which will cause poor combustion.  Draw card or out-of-phase diagram: Taken in a similar manner to the power card, with the fuel pump engaged but with the indicator drum 900 out of phase with piston stroke. This illustrates more clearly the pressure changes during fuel combustion.
  • 18.
    Indicator Diagrams  LightSpring Diagram: Again similar to the power card and in phase with the engine, but this diagram is taken with a light compression spring fitted to the indicator showing pressure changes during exhaust and scavenge to an enlarged scale. It can be used to detect faults in these operations.  Provided the cycle operations are correct, power balancing of an engine can be carried out by comparing power diagrams, or MIP, from each cylinder.  Fuel pump controls can be adjusted to increase or decrease the quantity of fuel injected into each cylinder and this in turn will raise or lower the power produced within the cylinder. Such adjustments may be carried out to obtain equal power from each cylinder, in which case the area of each power card will be equal.
  • 20.
    Indicator Diagrams  Steadyrunning conditions must be maintained while power balancing is carried out.  Exhaust temperatures should be noted during power balancing since a limiting exhaust temperature may make complete balancing difficult. 
  • 21.
    Notes - IndicatorDiagrams  While an engine is running at sea, valve or fuel injection timings can only be checked by instrumentation. Incorrect timings will affect power output and exhaust temperatures and provided these are normal and no other irregularities occur, it can be assumed that engine timing is correct.  Exhaust valve setting on a slow running engine can be checked by means of a light spring indicator diagram. This will not give an accurate timing check but by comparison with a normal diagram or one taken during original engine trials, it may be seen if valve opening early or late.  Fuel injection timing can be checked by means of power and draw cards taken from cylinder. The draw card particularly will illustrate early or late injection. This does not show the actual
  • 22.
    Notes - IndicatorDiagrams time injection commences but that at which ignition takes place.  Provided the fuel is in correct condition and the injector operating normally, the time between injection and ignition is almost constant. It may be possible to obtain needle lift diagrams from the fuel injectors, these give accurate timing but not many engines have facilities for taking them.  Accurate timing checks, measurements of clearances, adjustments, inspection and testing of parts can be only carried out while engine is out of service.  The limitations of the mechanical indicator is its inability to compare the output, without which any trouble-shooting of faults is not possible.
  • 23.
    Indicator Diagrams  Inmany modern engines sophisticated measuring devices may be fitted to record cylinder pressures,  There are portable indicators which can store data that can be down-loaded to PCs for further analysis.  There are several advantages to electronic devices, such as elimination of errors due to mechanical springs (used in conventional indicators) which limit the use to slow speed engines.  Calculation of indicated power, specific fuel consumption, peak pressure, compression pressure on is done by the microprocessor and is easy to obtain and accurate.
  • 24.
  • 25.
    Indicator Diagrams  TheT.D.C. position of NO.1 unit is sensed by some type of sensor, usually located close to the flywheel, and which passes on the data to the unit.  Typical faults can be easily traced, such as faults in the injectors, loss of compression pressure due to broken piston rings or ovality of liner, or choked scavenge inlet ports.  The most commonly used software is called the PREMET which freezes the condition inside, readily calculates the power developed per cylinder, total power and also enables super- imposing diagrams of various units are on each other allowing comparison and fault finding.
  • 26.
    Fault Finding -Afterburning  Afterburning: refers to the slow or late burning of fuel which takes place during the expansion stroke of the engine cycle. It causes loss of power, since the fuel is not burned at the correct moment to transmit energy to the piston effectively. Combustion may still be incomplete when exhausting takes place and the heat energy remaining, with the un-burnt fuel, will be lost. Exhaust gases will be at a high temperature and will contain black smoke from incomplete combustion. There will be also a higher pressure of gas at blow down which will increase pulsating in the exhaust manifold.
  • 27.
    Fault Finding -Afterburning  Detection: by loss in power, high exhaust gas temperature with smoke. Confirmed by taking power and draw cards. These show an increase in depth of diagram towards end of expansion together with late or slow ignition. Due to loss of power there will be a reduction in engine efficiency due to afterburning. It may cause burning in the exhaust valves and fouling of the exhaust gas system including turbo-chargers. These in turn may give rise to surging of turbo-charger and possible fires in the uptakes. There will be also an corresponding drop in scavenge efficiency and higher cyl temps which make liner lubrication difficult.
  • 28.
    Fault Finding -Afterburning  Causes: causes of afterburning may be incorrect fuel pump timing, faulty fuel injector, heavy fuel oil temperature too low, lack of scavenge air or poor combustion.  Remedies: correct fuel timing by adjusting the fuel pump / fuel cam or clearance, change fuel injector, maintain fuel temperature for correct viscosity, clean scavenge ports and turbo-charger. It should be noted that low fuel temperature and lack of scavenge air (apart from chocked ports) will affect all cylinders of the engine.
  • 30.
    Fault Finding –Early firing  Early firing in a cylinder will cause a very high peak pressure at about the TDC of the piston. This will cause a heavy shock load to be transmitted to the bearings with a corresponding knock form the engine. Thermal efficiency will be increased, power will be raised but exhaust temperature reduced.  Early firing can be detected by the engine knock and can be confirmed by an indicator diagram power card which shows a high peak pressure. It may be caused by early injection, incorrect fuel conditions, overheated parts such as a hot piston, or even a scavenge fire causing local heat.  Remedies include checking and correcting fuel pump timing, correct fuel temp, cooling of working parts. If not corrected, shock loads can lead to damage or failure of bearings.
  • 33.
    Fault Finding –Chocked Fuel Valve  May be due to contamination in the fuel in which debris may choke up the small atomizer holes in the injector. Alternatively it may be caused by a leaky injector allowing hot gas to blow back into the injector causing carbon to form and choke the injector. Overheating of injector nozzle may also cause build-up of carbon. There will be a loss of engine power. There will probably be hammering in fuel pipes between fuel pumps and injector and this may lead to rupture of fuel pipe. A chocked valve can be confirmed by indicator diagram power and draw cards and reduced exhaust temperature.  The remedy is to change the fuel injector, clean the fuel system and ensure correct centrifuging and filtering of fuel, and maintain correct fuel valve cooling temperature.
  • 35.
    Fault Finding –Leaky Piston Rings  Detected by poor combustion together with blow past of hot combustion gases. There will be a loss in engine power with the possibility of afterburning with the corresponding high exhaust temperature and smoke. It will cause high rate of cylinder liner wear due to poor lubrication, and may cause scavenge fires due to fouling of scavenge spaces. There is also a risk of seized piston due to local overheating. There will be low compression and consequently poor combustion. A compression diagram will show this.  May be caused by excessive cylinder liner wear; lack of cylinder lubrication; worn/broken/stuck/poorly maintained piston rings.
  • 36.
    Fault Finding –Leaky Piston Rings  Worn piston ring groove landings also allow rings to cant and jam; carbon jamming rings in grooves. Gets aggravated if engine is overloaded.  Remedy is to gauge cylinder liner and renew if necessary; overhaul piston; clean ring grooves and gauge them; machine or fit new groove inserts as necessary, and renew piston rings with correct clearances. Maintain cylinder lubrication and avoid overload.
  • 38.
    Questions  What areindicator diagrams? How do they help us?  Define the following terms: MIP, MEP, IHP, BHP  Define the following terms: Rated Power, Gross Power, MCR and effective power.  Sketch and describe a draw and power card.  Draw and explain by indicator diagram – Leaky Piston Rings.  Draw and explain by indicator diagram – Choked Fuel Valve.  Draw and explain by indicator diagram – Early Firing.  Draw and explain by indicator diagram – After Burning.