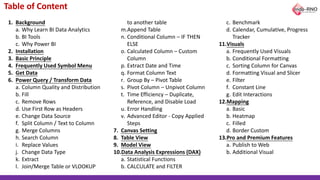
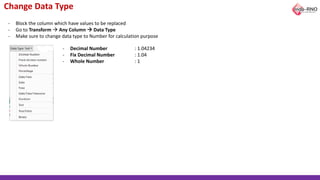
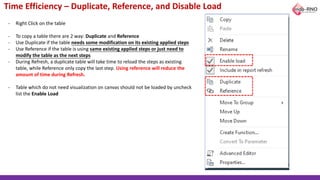
This document is a comprehensive tutorial on using Power BI for business intelligence, covering installation, data transformation, analysis techniques, and visual creation. It includes detailed instructions on frequently used features, data management, and advanced editor functions. The tutorial emphasizes the importance of BI tools in various industries and provides links for further resources and materials.


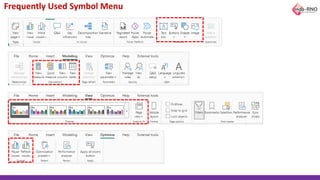

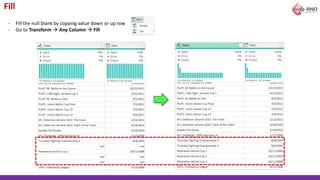
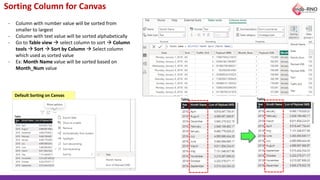
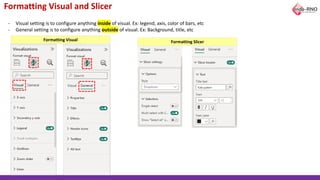
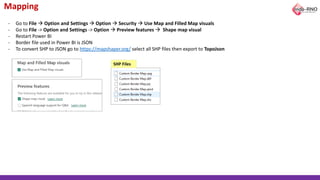
![Extract Date and Time
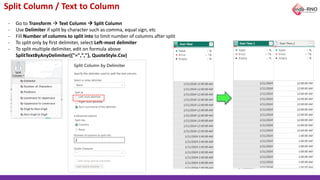
- Select column with Date or Time data type
- Go to Add Column → From Date & Time
- Select Week of Year to extract week
- Modify this script to start week on Friday → Table.AddColumn(#"Added Custom", "Week of Year", each
Date.WeekOfYear([Date], Day.Friday), Int64.Type)](https://image.slidesharecdn.com/powerbitutorialbyindo-rnov1-250119143925-c253f247/85/Power-BI-Tutorial-for-analysis-optimasi-network-32-320.jpg)
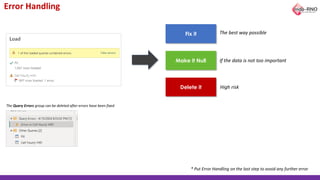

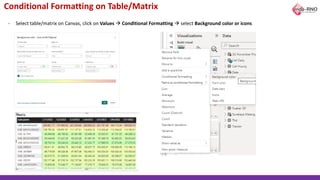
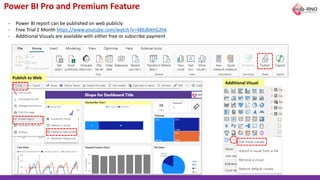
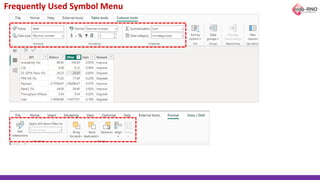
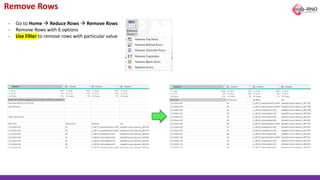
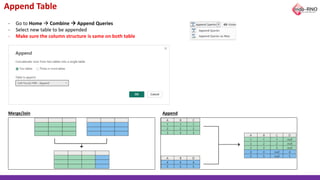
![Model View – Relational Table
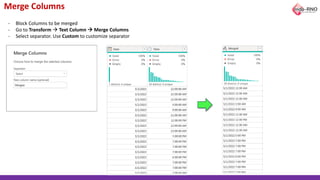
- Drag a column of source table to a column of target table to join/merge table
- Ensure there is no duplicate value on a column of target value
- The column name of source or target table do not need to have same name, just need to make sure the value is similar
- Use RELATED to lookup column of target table. Ex: Month Name = RELATED('Month Sort'[Month Name])](https://image.slidesharecdn.com/powerbitutorialbyindo-rnov1-250119143925-c253f247/85/Power-BI-Tutorial-for-analysis-optimasi-network-43-320.jpg)

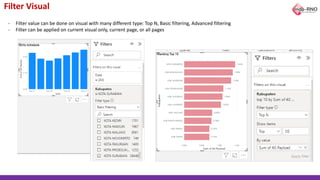
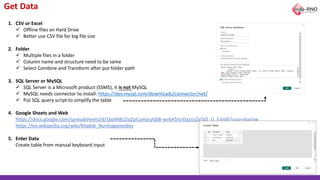
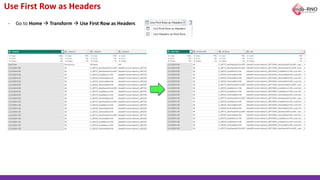
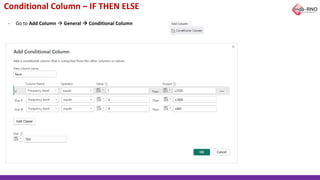
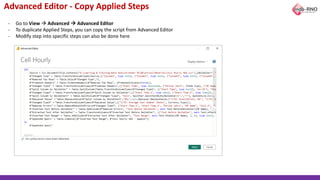
![DAX – CALCULATE and FILTER
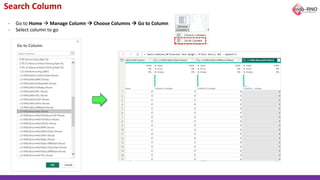
Normally CALCULATE and FILTER are used on
Canvas as Measure
CALCULATE
FILTER
Return
Value
Return
Table
= CALCULATE(SUM('Cell Hourly'[(LTE) Average User Number
(None)]),'Cell Hourly'[NE Name] = "ABC003_ParkiranBlokA-KIN")
= CALCULATE(Expression, Criteria)
Basic Formula
Sample: Return Number of an Expression/Calculation
Sample: Return Number or Text with specific criteria from other columns value
= CALCULATE(FIRSTNONBLANK('Cell Hourly'[(LTE) UL Resource
Block Utilizing Rate (%)],1),'Cell
Hourly'[Cell.6]="E_ABC002ML1_NewPasarDeliTua-DMT_ML02" &&
'Cell Hourly'[Date Time]=DATE(2024, 1, 11) + TIME(3, 0, 0))
= FILTER('Cell Daily',
('Cell Daily'[Kabupaten] = "KOTA SURABAYA" ||
'Cell Daily'[Kabupaten] ="KOTA MALANG")
&& 'Cell Daily'[Downlink bandwidth]="CELL_BW_N100")
Sample: Return a virtual table with several criteria
= FILTER(Table, FilterExpression
Basic Formula](https://image.slidesharecdn.com/powerbitutorialbyindo-rnov1-250119143925-c253f247/85/Power-BI-Tutorial-for-analysis-optimasi-network-45-320.jpg)
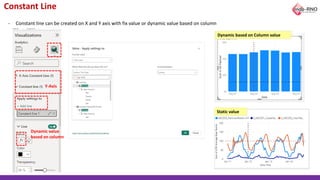
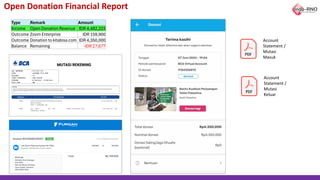
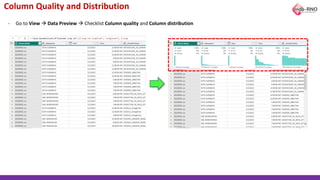
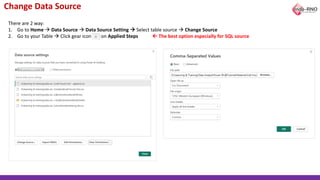
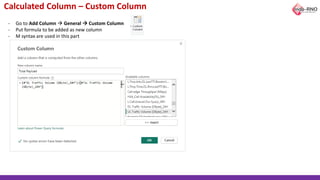
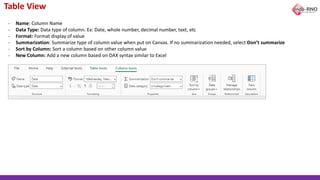
![DAX – Benchmark
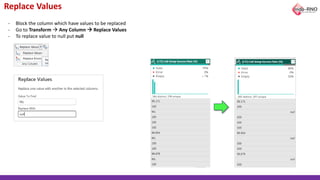
Winner =
VAR SummaryTable =
UNION (
ROW ( "Column name", "A", "Column Value", 'OOKLA - Download'[A]),
ROW ( "Column name", "B", "Column Value", 'OOKLA - Download'[B]),
ROW ( "Column name", "C", "Column Value", 'OOKLA - Download'[C]),
ROW ( "Column name", "D", "Column Value", 'OOKLA - Download'[D]),
ROW ( "Column name", "E", "Column Value", 'OOKLA - Download'[E])
)
VAR Result =
CONCATENATEX ( TOPN ( 1, SummaryTable, [Column Value] ), [Column name], ", " )
RETURN
Result
Formula
Add Column with return value of column name with the highest value among other tables](https://image.slidesharecdn.com/powerbitutorialbyindo-rnov1-250119143925-c253f247/85/Power-BI-Tutorial-for-analysis-optimasi-network-46-320.jpg)
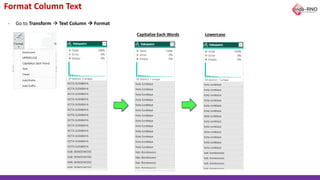
![DAX – Calendar, Cumulative, Progress Tracker
Calendar = CALENDAR(DATE(2022,5,1), DATE(2022,5,31))
Calendar as Table
Cumulative =
CALCULATE (
SUM ( 'Month Sort'[Random] ),
ALL ( 'Month Sort' ),
'Month Sort'[Month Num] <= EARLIER ( 'Month Sort'[Month Num] ))
Cumulative as Column
Progress =
CALCULATE(COUNTROWS(Tracker),Tracker[Submission Status]="Submitted")
/
COUNTROWS(Tracker)
Progress as Measure](https://image.slidesharecdn.com/powerbitutorialbyindo-rnov1-250119143925-c253f247/85/Power-BI-Tutorial-for-analysis-optimasi-network-47-320.jpg)