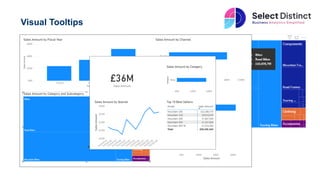
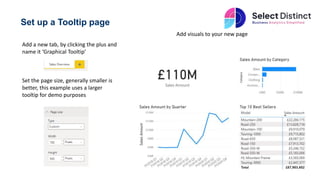
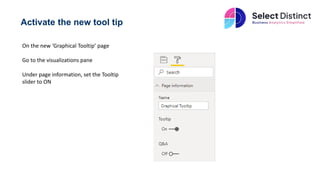
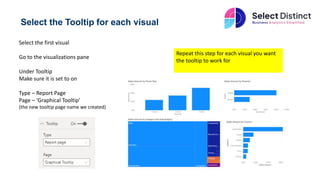
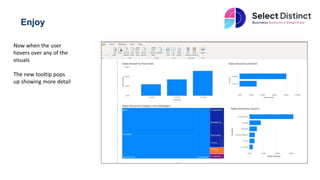
Power BI Tips
and Timesavers
Visual Tooltips
In Power BI
Visual Tooltips
Power BI by default gives you basic
tooltips, which present you with the
values included in your visual
But with a bit of set up you can
improve them dramatically and really
bring the reports to life
Set up a Tooltip page
Add a new tab, by clicking the plus and
name it ‘Graphical Tooltip’
Set the page size, generally smaller is
better, this example uses a larger
tooltip for demo purposes
Add visuals to your new page
Activate the new tool tip
On the new ‘Graphical Tooltip’ page
Go to the visualizations pane
Under page information, set the Tooltip
slider to ON
Select the Tooltip for each visual
Select the first visual
Go to the visualizations pane
Under Tooltip
Make sure it is set to on
Type – Report Page
Page – ‘Graphical Tooltip’
(the new tooltip page name we created)
Repeat this step for each visual you want
the tooltip to work for
Enjoy
Now when the user
hovers over any of the
visuals
The new tooltip pops
up showing more detail
Visual tooltips in Power BI bring a rich user experience, giving your users
the ability to explore what is behind the data
It brings a real WOW factor and is a very efficient way to present further
details
Hope you find this useful
For more Tips, Tricks and
Timesavers, visit our website
Business Analytics Blog – Select Distinct
Credit: simon.harrison@selectdistinct.co.uk

Power BI Tips Visual Tooltips.pptx

  • 1.
    Power BI Tips andTimesavers Visual Tooltips In Power BI
  • 2.
    Visual Tooltips Power BIby default gives you basic tooltips, which present you with the values included in your visual But with a bit of set up you can improve them dramatically and really bring the reports to life
  • 3.
    Set up aTooltip page Add a new tab, by clicking the plus and name it ‘Graphical Tooltip’ Set the page size, generally smaller is better, this example uses a larger tooltip for demo purposes Add visuals to your new page
  • 4.
    Activate the newtool tip On the new ‘Graphical Tooltip’ page Go to the visualizations pane Under page information, set the Tooltip slider to ON
  • 5.
    Select the Tooltipfor each visual Select the first visual Go to the visualizations pane Under Tooltip Make sure it is set to on Type – Report Page Page – ‘Graphical Tooltip’ (the new tooltip page name we created) Repeat this step for each visual you want the tooltip to work for
  • 6.
    Enjoy Now when theuser hovers over any of the visuals The new tooltip pops up showing more detail
  • 7.
    Visual tooltips inPower BI bring a rich user experience, giving your users the ability to explore what is behind the data It brings a real WOW factor and is a very efficient way to present further details Hope you find this useful
  • 8.
    For more Tips,Tricks and Timesavers, visit our website Business Analytics Blog – Select Distinct Credit: simon.harrison@selectdistinct.co.uk