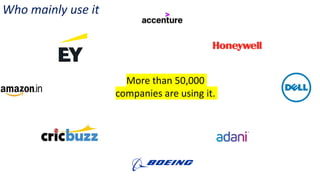
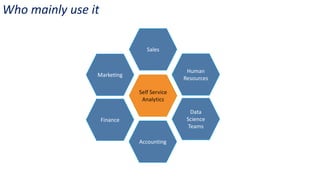
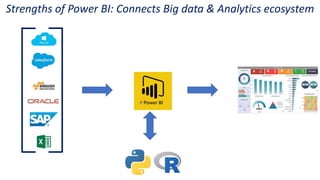
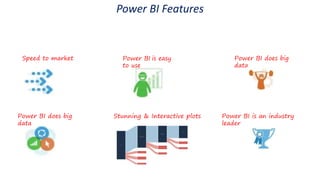
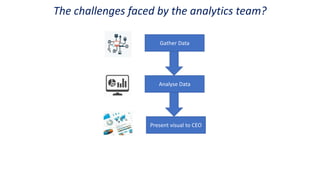
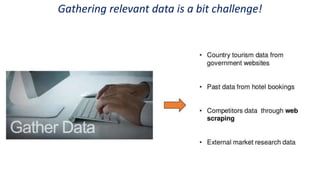
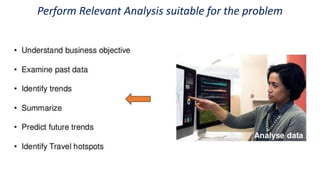
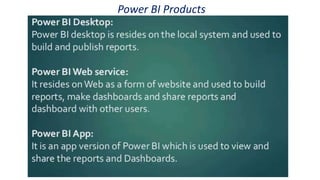
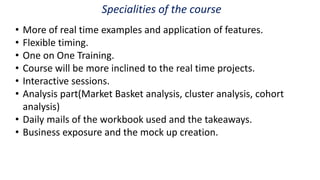
Introduction to Power BI
Quick Facts on Power BI
Who mainly use it
More than 50,000
companies are using it.
Who mainly use it
Self Service
Analytics
Sales
Human
Resources
Marketing
Finance
Accounting
Data
Science
Teams
Job Perspectives
What is Power BI ?
We have to answer two important questions:
What is data visualisation ? Why is data visualisation important ?
What is Data Visualisation ?
Data visualisation is the process of describing information through visual
rendering.
Crunching data matters for rapid analytics!
Data visualisation is the process of describing information through visual
rendering.
Strengths of Power BI: Connects Big data & Analytics ecosystem
Power BI Features
Speed to market Power BI is easy
to use
Power BI does big
data
Power BI does big
data
Stunning & Interactive plots Power BI is an industry
leader
Use Case - 1
How does analytics team address this task
The challenges faced by the analytics team?
Gather Data
Analyse Data
Present visual to CEO
Gathering relevant data is a bit challenge!
Perform Relevant Analysis suitable for the problem
Power BI Products
Course Structure
• Excel file
First 10 minutes Next 45 minutes Last 5 minutes
Recap of previous session Will be learning new
concepts
Recap of what is learned
on particular day and
doubts.
Specialities of the course
• More of real time examples and application of features.
• Flexible timing.
• One on One Training.
• Course will be more inclined to the real time projects.
• Interactive sessions.
• Analysis part(Market Basket analysis, cluster analysis, cohort
analysis)
• Daily mails of the workbook used and the takeaways.
• Business exposure and the mock up creation.
Power BI Demo.pptx
Power BI Demo.pptx
Power BI Demo.pptx

Power BI Demo.pptx

  • 1.
  • 2.
  • 3.
    Who mainly useit More than 50,000 companies are using it.
  • 4.
    Who mainly useit Self Service Analytics Sales Human Resources Marketing Finance Accounting Data Science Teams
  • 5.
  • 6.
    What is PowerBI ? We have to answer two important questions: What is data visualisation ? Why is data visualisation important ?
  • 7.
    What is DataVisualisation ? Data visualisation is the process of describing information through visual rendering.
  • 8.
    Crunching data mattersfor rapid analytics! Data visualisation is the process of describing information through visual rendering.
  • 9.
    Strengths of PowerBI: Connects Big data & Analytics ecosystem
  • 10.
    Power BI Features Speedto market Power BI is easy to use Power BI does big data Power BI does big data Stunning & Interactive plots Power BI is an industry leader
  • 11.
  • 15.
    How does analyticsteam address this task
  • 16.
    The challenges facedby the analytics team? Gather Data Analyse Data Present visual to CEO
  • 17.
    Gathering relevant datais a bit challenge!
  • 18.
    Perform Relevant Analysissuitable for the problem
  • 19.
  • 22.
    Course Structure • Excelfile First 10 minutes Next 45 minutes Last 5 minutes Recap of previous session Will be learning new concepts Recap of what is learned on particular day and doubts.
  • 23.
    Specialities of thecourse • More of real time examples and application of features. • Flexible timing. • One on One Training. • Course will be more inclined to the real time projects. • Interactive sessions. • Analysis part(Market Basket analysis, cluster analysis, cohort analysis) • Daily mails of the workbook used and the takeaways. • Business exposure and the mock up creation.