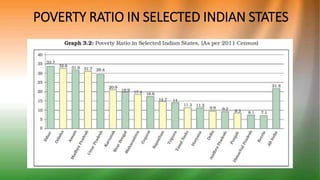
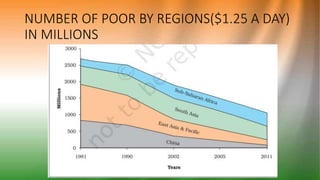
POVERTY AS A CHALLENGE
Made by – Sarthak Agarwal
Class – IX A
Roll no. – 07
INTRODUCTION
we come across many people who we think are poor. They could be
landless labourers in villages or people living in overcrowded jhuggis in
cities. They could be daily wage workers at construction sites or child
workers in Dhabas. They could also be beggars with children in tatters.
We see poverty all around us. In fact, every fourth person in India is
poor. This means, roughly 270 million (or 27 crore) people in India live
in poverty 2011-12. This also means that India has the largest single
concentration of the poor in the world. This illustrates the seriousness
of the challenge.
POVERTY AS SEEN BY SOCIAL SCIENTIST
Since poverty has many facets, social scientists look at it through a
variety of indicators. Usually the indicators used relate to the levels of
income and consumption. But now poverty is looked through other
social indicators like illiteracy level, lack of general resistance due to
malnutrition, lack of access to healthcare, lack of job opportunities,
lack of access to safe drinking water, sanitation etc.
POVERTY LINE
A common method used to measure poverty is based on the income or
consumption levels. A person is considered poor if his or her income or
consumption level falls below a given “minimum level” necessary to
fulfil basic needs. What is necessary to satisfy basic needs is different at
different times and in different countries. Therefore, poverty line may
vary with time and place. Each country uses an imaginary line that is
considered appropriate for its existing level of development and its
accepted minimum social norms. For example, a person not having a
car in the United States may be considered poor. In India, owning of a
car is still considered a luxury.
POVERTY ESTIMATES
there is substantial decline in poverty ratios in India from about 45 per
cent in 1993-94 to 37.2 per cent in 2004-05. The proportion of people
below poverty line further came down to about 21.9 per cent in 2011-
12. If the trend continues, people below poverty line may come down
to less than 20 per cent in the next few years. Although the percentage
of people living under poverty declined in the earlier two decades
(1973–1993), the number of poor declined from 407.1 million in 2004-
05 to 269.3 million in 2011-12 with an average annual decline of 2.2
percentage points during 2004-05 to 2011-12.
ESTIMATES OF POVERTY IN INDIA (TENDULKAR
METHODALOGY)
VULNERABILITY
Vulnerability to poverty is a measure, which describes the greater
probability of certain communities (say, members of a backward caste)
or individuals (such as a widow or a physically handicapped person) of
becoming, or remaining.
INTER-STATE DISPARITIES
Poverty in India also has another aspect or dimension. The proportion
of poor people is not the same in every state. Although state level
poverty has witnessed a secular decline from the levels of early
seventies, the success rate of reducing poverty varies from state to
state. Recent estimates show while the all India HCR was 21.9 per cent
in 2011-12 states like Madhya Pradesh, Assam, Uttar Pradesh, Bihar
and Orissa had above all India poverty level. As the Graph 3.2 shows,
Bihar and Orissa continue to be the two poorest states with poverty
ratios of 33.7 and 37.6 per cent respectively. Along with rural poverty,
urban poverty is also high in Orissa, Madhya Pradesh, Bihar and Uttar
Pradesh.
GLOBAL POVERTY SCENERIO
The proportion of people in developing countries living in extreme
economic poverty— defined by the World Bank as living on less than
$1.25 per day—has fallen from 43 per cent in 1990 to 22 per cent in
2008. Although there has been a substantial reduction in global
poverty.
GLOBAL POVERTY
POVERTY RATIO IN SELECTED INDIAN STATES
SHARE OF PEOPLE LIVING ON $1.25 A DAY
NUMBER OF POOR BY REGIONS($1.25 A DAY)
IN MILLIONS
CAUSES OF POVERTY
• British rule
• Rural economy
• Heavy pressure of population
• India’s economic policy
• Social factors
ANTI POVERTY MEASURES
Removal of poverty has been one of the major objectives of Indian
developmental strategy. The current anti-poverty strategy of the
government is based broadly on two planks (1) promotion of economic
growth (2) targeted anti-poverty programmes. Such Anti poverty
measures are -:
 Prime Minister Rozgar Yozana (PMRY)
 Rural Employment Generation Programme (REGP)
 Swarnajayanti Gram Swarozgar Yozana (SGSY)
 Antyodaya Anna Yozana (AAY)
THE CHALLENGES AHEAD
Wide disparities in poverty are visible between rural and urban areas
and among different states. Certain social and economic groups are
more vulnerable to poverty. Poverty reduction is expected to make
better progress in the next ten to fifteen years. This would be possible
mainly due to higher economic growth, increasing stress on universal
free elementary education, declining population growth, increasing
empowerment of the women and the economically weaker sections of
society.
SUMMARY
Normally, this is measured through the concept of “poverty line”.
Through this concept we analysed main global and national trends in
poverty. But in recent years, analysis of poverty is becoming rich
through a variety of new concepts like social exclusion. Similarly, the
challenge is becoming bigger as scholars are broadening the concept
into human poverty.

Poverty as a challenge

  • 1.
    POVERTY AS ACHALLENGE Made by – Sarthak Agarwal Class – IX A Roll no. – 07
  • 2.
    INTRODUCTION we come acrossmany people who we think are poor. They could be landless labourers in villages or people living in overcrowded jhuggis in cities. They could be daily wage workers at construction sites or child workers in Dhabas. They could also be beggars with children in tatters. We see poverty all around us. In fact, every fourth person in India is poor. This means, roughly 270 million (or 27 crore) people in India live in poverty 2011-12. This also means that India has the largest single concentration of the poor in the world. This illustrates the seriousness of the challenge.
  • 3.
    POVERTY AS SEENBY SOCIAL SCIENTIST Since poverty has many facets, social scientists look at it through a variety of indicators. Usually the indicators used relate to the levels of income and consumption. But now poverty is looked through other social indicators like illiteracy level, lack of general resistance due to malnutrition, lack of access to healthcare, lack of job opportunities, lack of access to safe drinking water, sanitation etc.
  • 4.
    POVERTY LINE A commonmethod used to measure poverty is based on the income or consumption levels. A person is considered poor if his or her income or consumption level falls below a given “minimum level” necessary to fulfil basic needs. What is necessary to satisfy basic needs is different at different times and in different countries. Therefore, poverty line may vary with time and place. Each country uses an imaginary line that is considered appropriate for its existing level of development and its accepted minimum social norms. For example, a person not having a car in the United States may be considered poor. In India, owning of a car is still considered a luxury.
  • 5.
    POVERTY ESTIMATES there issubstantial decline in poverty ratios in India from about 45 per cent in 1993-94 to 37.2 per cent in 2004-05. The proportion of people below poverty line further came down to about 21.9 per cent in 2011- 12. If the trend continues, people below poverty line may come down to less than 20 per cent in the next few years. Although the percentage of people living under poverty declined in the earlier two decades (1973–1993), the number of poor declined from 407.1 million in 2004- 05 to 269.3 million in 2011-12 with an average annual decline of 2.2 percentage points during 2004-05 to 2011-12.
  • 6.
    ESTIMATES OF POVERTYIN INDIA (TENDULKAR METHODALOGY)
  • 7.
    VULNERABILITY Vulnerability to povertyis a measure, which describes the greater probability of certain communities (say, members of a backward caste) or individuals (such as a widow or a physically handicapped person) of becoming, or remaining.
  • 8.
    INTER-STATE DISPARITIES Poverty inIndia also has another aspect or dimension. The proportion of poor people is not the same in every state. Although state level poverty has witnessed a secular decline from the levels of early seventies, the success rate of reducing poverty varies from state to state. Recent estimates show while the all India HCR was 21.9 per cent in 2011-12 states like Madhya Pradesh, Assam, Uttar Pradesh, Bihar and Orissa had above all India poverty level. As the Graph 3.2 shows, Bihar and Orissa continue to be the two poorest states with poverty ratios of 33.7 and 37.6 per cent respectively. Along with rural poverty, urban poverty is also high in Orissa, Madhya Pradesh, Bihar and Uttar Pradesh.
  • 9.
    GLOBAL POVERTY SCENERIO Theproportion of people in developing countries living in extreme economic poverty— defined by the World Bank as living on less than $1.25 per day—has fallen from 43 per cent in 1990 to 22 per cent in 2008. Although there has been a substantial reduction in global poverty.
  • 10.
  • 11.
    POVERTY RATIO INSELECTED INDIAN STATES
  • 12.
    SHARE OF PEOPLELIVING ON $1.25 A DAY
  • 13.
    NUMBER OF POORBY REGIONS($1.25 A DAY) IN MILLIONS
  • 14.
    CAUSES OF POVERTY •British rule • Rural economy • Heavy pressure of population • India’s economic policy • Social factors
  • 15.
    ANTI POVERTY MEASURES Removalof poverty has been one of the major objectives of Indian developmental strategy. The current anti-poverty strategy of the government is based broadly on two planks (1) promotion of economic growth (2) targeted anti-poverty programmes. Such Anti poverty measures are -:  Prime Minister Rozgar Yozana (PMRY)  Rural Employment Generation Programme (REGP)  Swarnajayanti Gram Swarozgar Yozana (SGSY)  Antyodaya Anna Yozana (AAY)
  • 16.
    THE CHALLENGES AHEAD Widedisparities in poverty are visible between rural and urban areas and among different states. Certain social and economic groups are more vulnerable to poverty. Poverty reduction is expected to make better progress in the next ten to fifteen years. This would be possible mainly due to higher economic growth, increasing stress on universal free elementary education, declining population growth, increasing empowerment of the women and the economically weaker sections of society.
  • 17.
    SUMMARY Normally, this ismeasured through the concept of “poverty line”. Through this concept we analysed main global and national trends in poverty. But in recent years, analysis of poverty is becoming rich through a variety of new concepts like social exclusion. Similarly, the challenge is becoming bigger as scholars are broadening the concept into human poverty.