Download to read offline
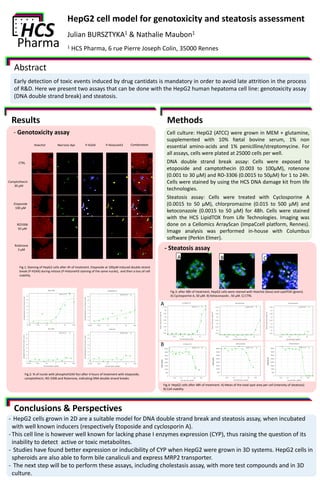
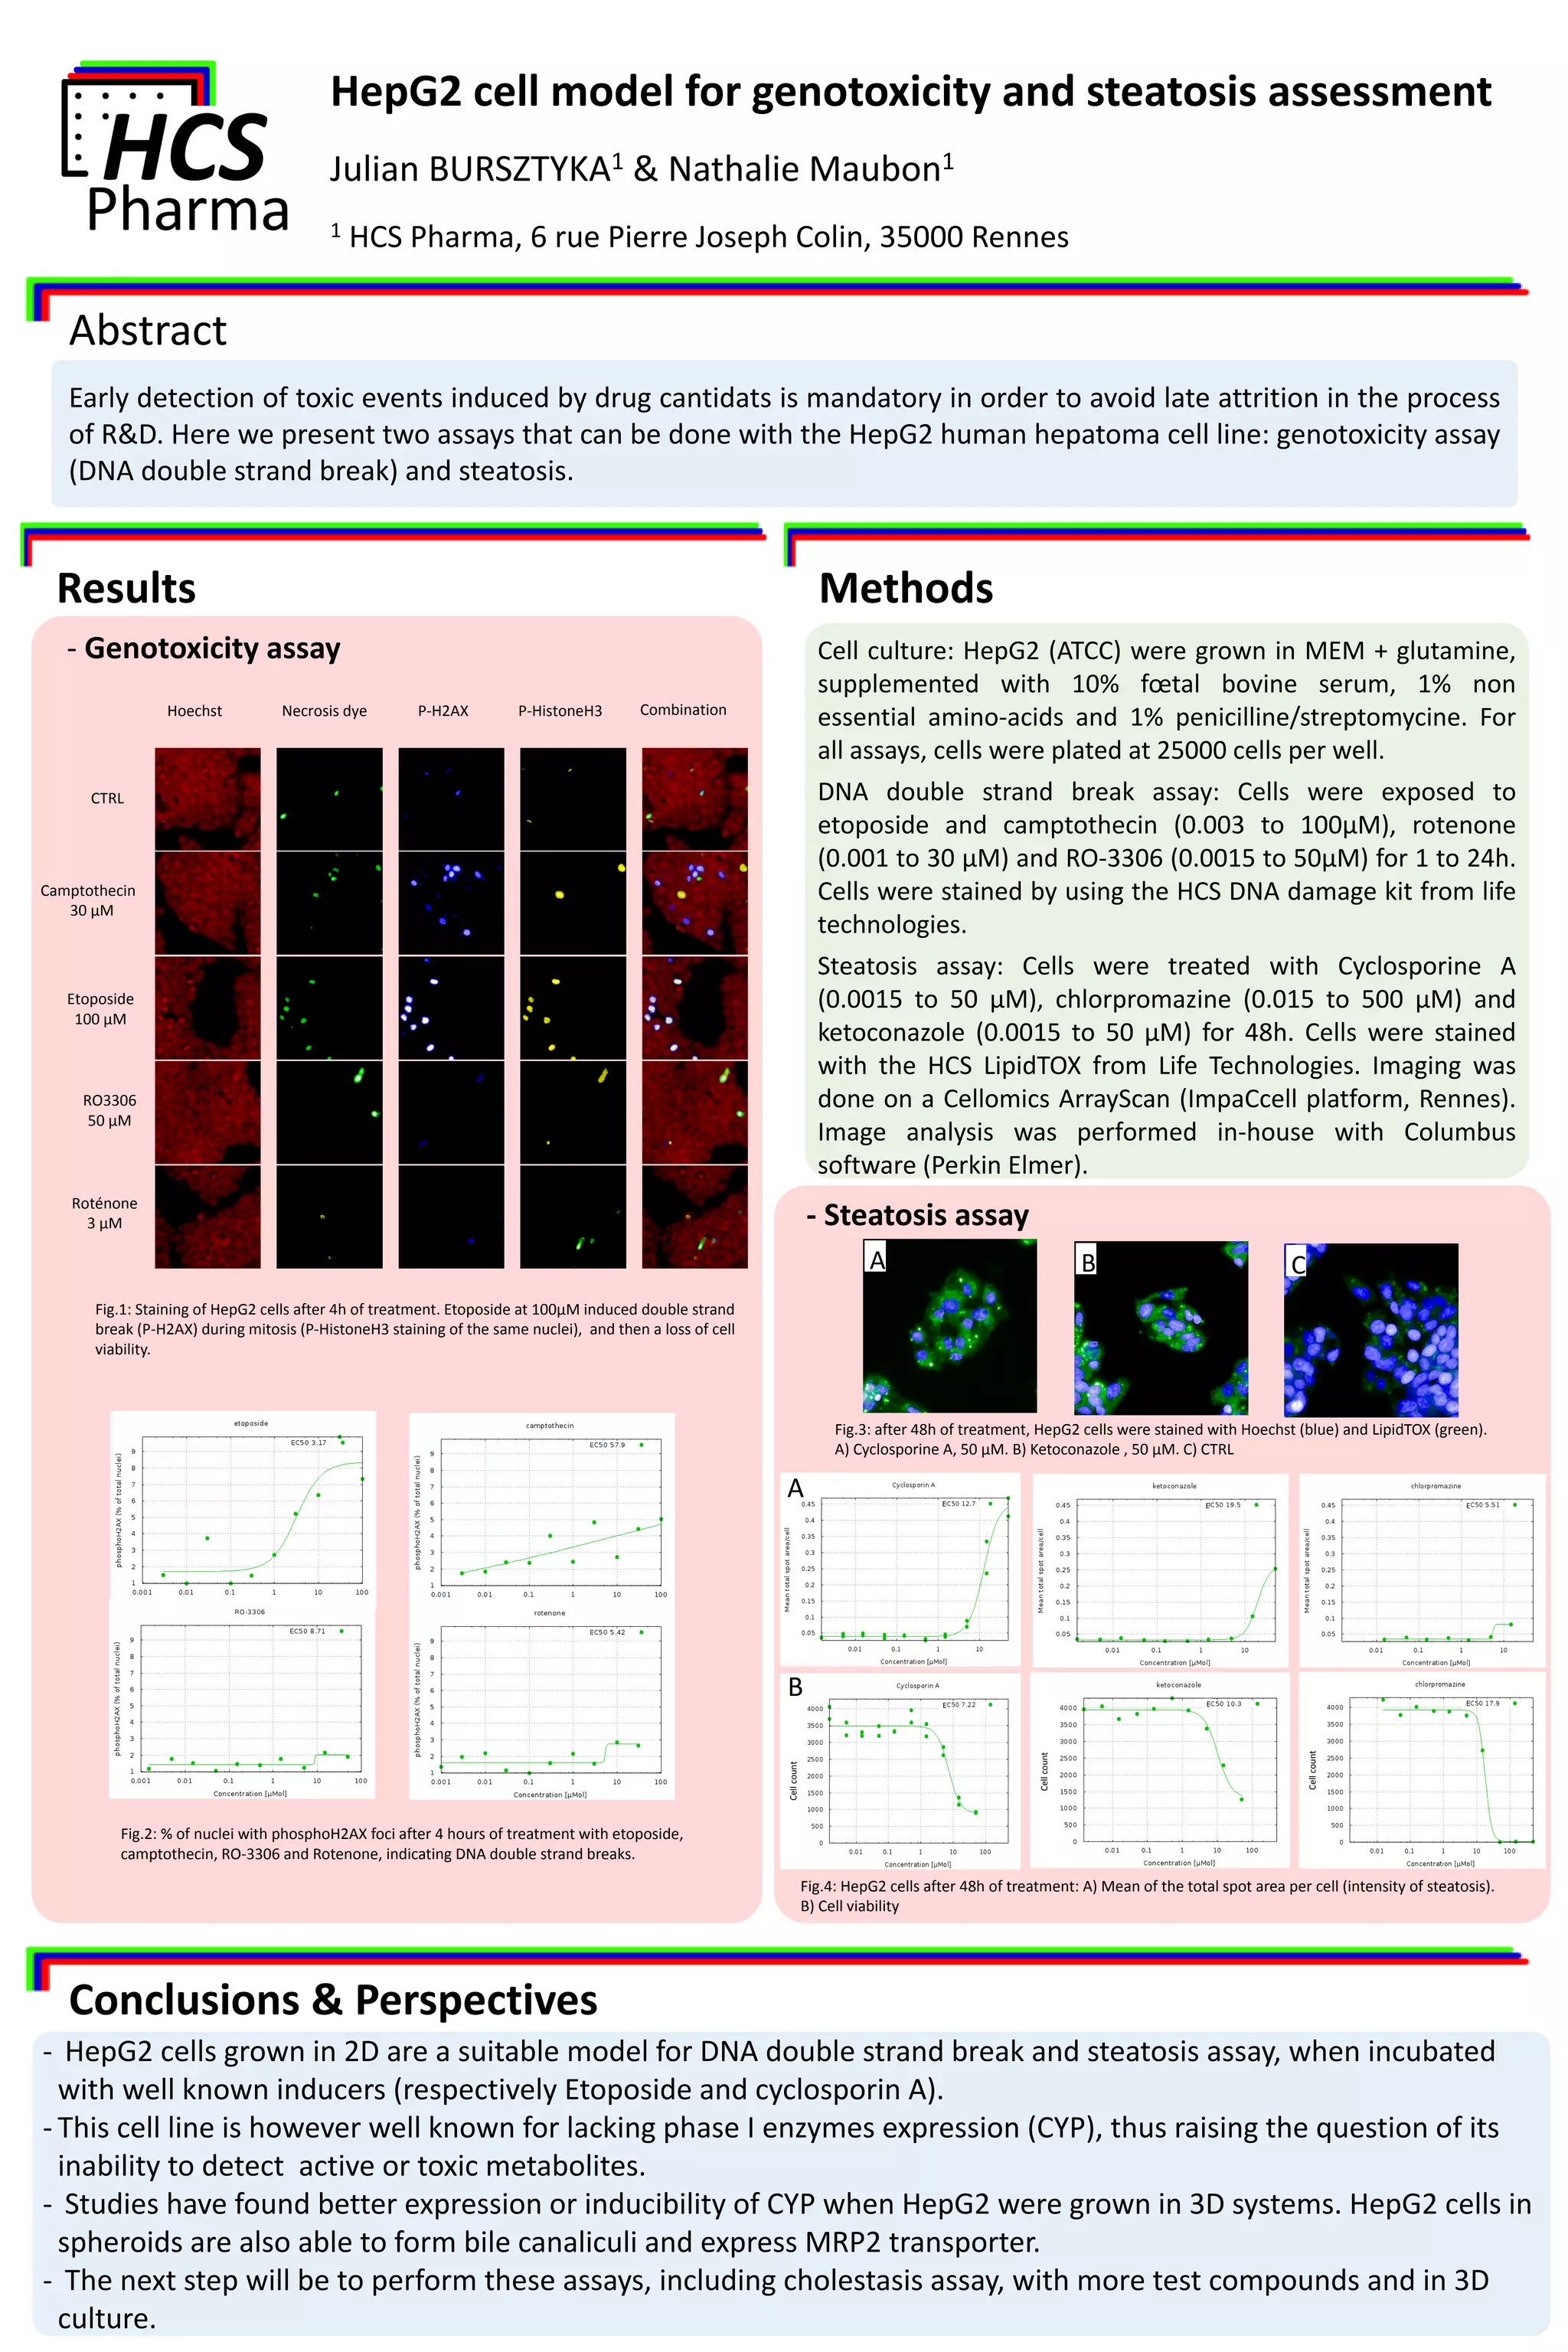

The document presents assays using the HepG2 human hepatoma cell line for assessing genotoxicity through DNA double strand breaks and steatosis induced by known agents. It highlights the suitability of HepG2 in 2D culture but notes its limitations in phase I enzyme expression, suggesting potential improvements with 3D culture systems. Future work aims to expand these assays, including cholestasis, with additional test compounds in a 3D context.


