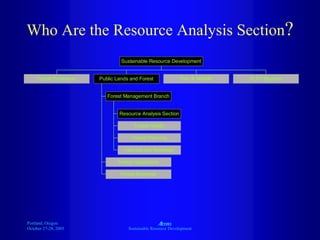
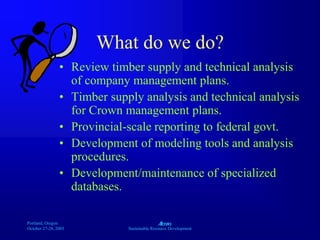
Tammy Kobliuk of Alberta Sustainable Resource Development presented on lessons learned from handling large amounts of geospatial data for resource analysis and management. Key points include:
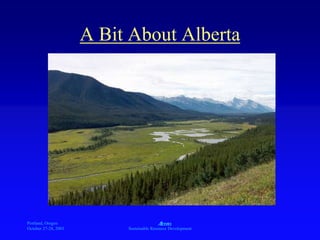
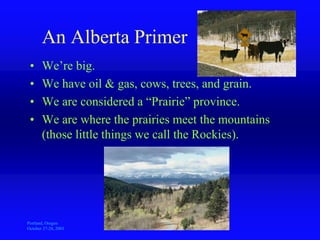
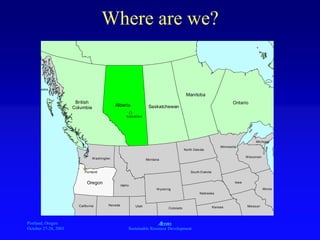
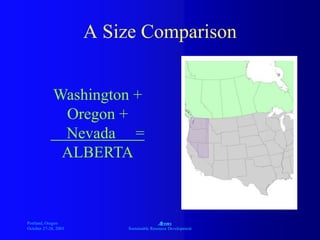
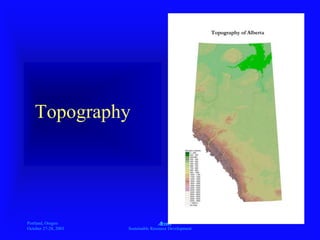
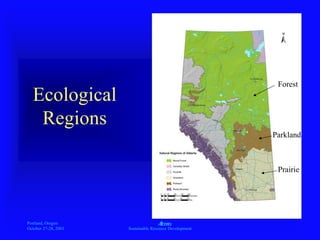
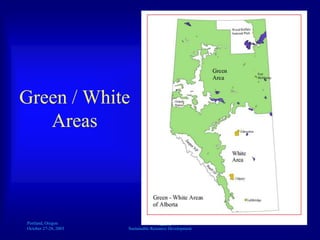
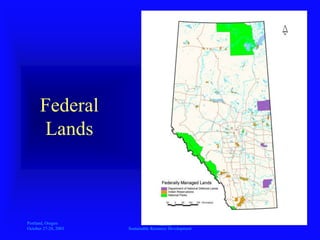
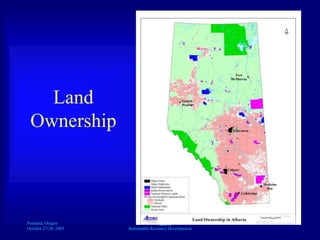
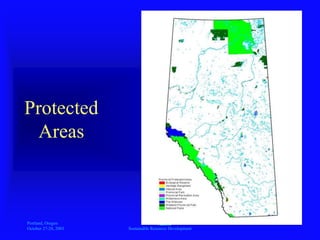
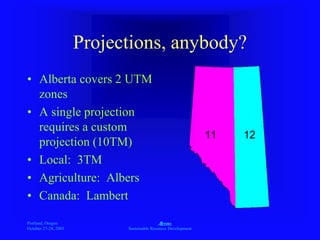
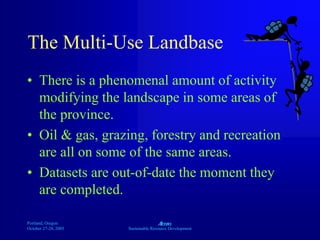
- Alberta is a large province with diverse landscapes and resource uses, presenting challenges for analysis.
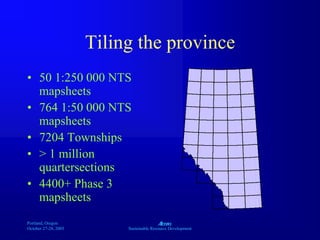
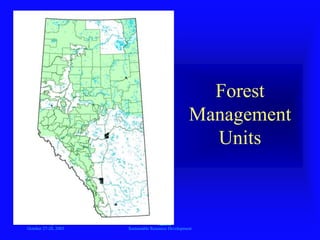
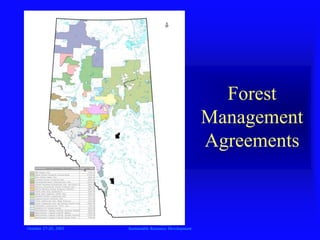
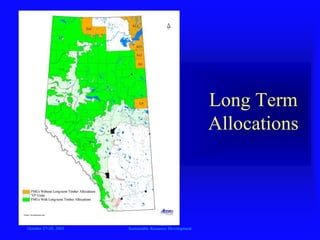
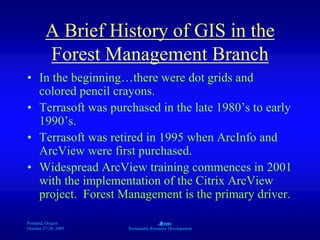
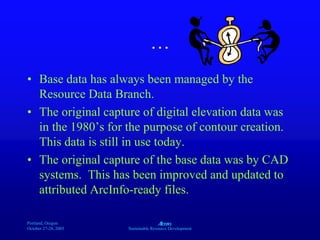
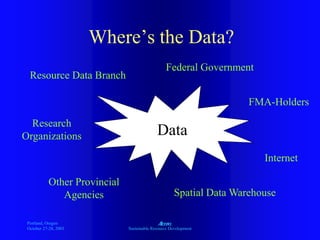
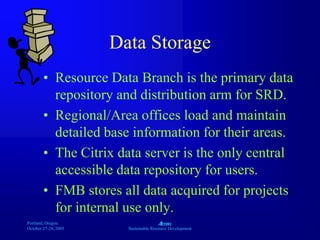
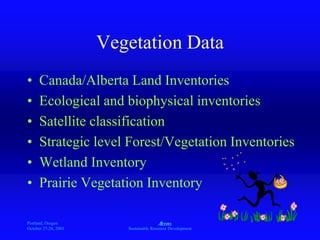
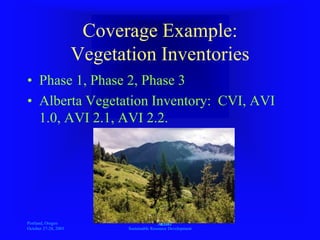
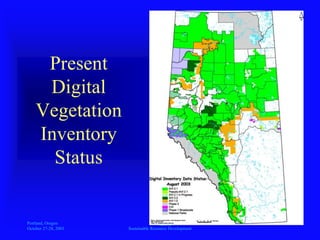
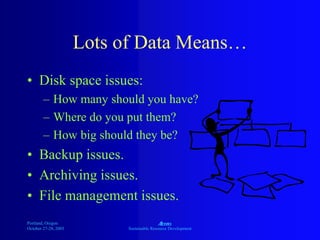
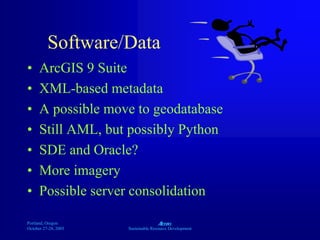
- SRD has accumulated vast amounts of geospatial data over decades from various sources for its resource management responsibilities.
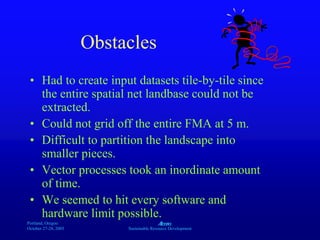
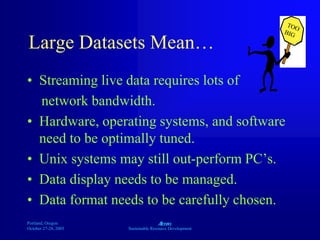
- Analyzing and managing such large, diverse datasets across a huge area involves overcoming technical challenges around data storage, access, integration from various sources, and performing analyses.
Douglas Gallant has over 30 years of experience in management consulting, marketing, finance, and retail. He holds an MBA from Dalhousie University and a Bachelor of Commerce from the University of Calgary. His career includes positions in energy production analysis, grocery retail management, and financial analysis. Currently he works as an independent management consultant providing strategic solutions to businesses.
El documento discute la diferencia entre derechos humanos y derechos fundamentales, y argumenta que el acceso a Internet debería considerarse un derecho humano. También explica qué es la brecha digital y sugiere que el acceso a Internet debería regularse a través de la autorregulación en lugar de la regulación estatal.
MISA PRAIRIES 2013 - Flexibility in Delivering GIS ServicesTammy Kobliuk
This document discusses providing flexible GIS services and data through a case study of St. Albert, Alberta. It outlines how GIS solutions have evolved from desktop software to include cloud solutions, widgets, mobile platforms, and custom maps/analysis. The key principles that guide St. Albert include being business driven, accessible, integrated, and empowering end users. St. Albert provides GIS through a variety of approaches including COTS server software, cloud applications, widgets, open data, and custom tools to best meet varied user needs. Challenges include changing technology and keeping solutions up to date.
This document describes the forest cover classification procedure used in Alberta. It outlines the input data requirements, output data fields, forest cover classes, and general classification methodology. The classification methodology involves species roll-ups of the overstory and understory, classification of stands disregarding structure, horizontal stands based on the understory, and multistory stands with dense overstory and understory vegetation. It aims to classify forest cover into 65 classes including various pure, mixed, wetland, non-forested and anthropogenic land cover types.
The document describes a composite visibility analysis procedure to evaluate the visual aesthetics of an area from multiple viewpoints. It involves generating viewpoint layers along travel corridors and other areas, running a visibility analysis from each viewpoint using a DEM as input, and combining the outputs to create an overall composite visibility map of the project area. Key inputs are a DEM, travel corridors and other features to use as viewpoints. The procedure is implemented in GIS software and involves generating viewpoints, running visibility analyses in batches, and combining the outputs.
This document summarizes a meeting to discuss analyzing interior forest patches in Alberta. Tammy Kobliuk presented on developing procedures to identify interior forest patches on forest management areas. Key points included defining interior forest criteria of stand attributes and distances from edges. The analysis may require a raster or vector approach depending on the size and complexity of the area. Accounting for features like seismic lines was also discussed as potentially impacting results. Technical challenges in analyzing very large study areas with the available software and hardware were also a main topic.
Introducing - Fourth Force - Next level for Verification'sDipesh Arora
India's only background screening and verification company with:
- 29 State offices in India
- 150+ retd. CBI, RAW and Intelligence officials dedicated for screening & verification's
- Zero outsourcing
- Customised TAT with high Service Level’s
- End to End web based process with live update for Client's
Douglas Gallant has over 30 years of experience in management consulting, marketing, sales, and retail. He has worked in various industries including oil and gas, computer technology, software, and grocery retail. Gallant holds an MBA degree and has extensive training in computer systems, accounting software, and business programs. He seeks a progressive position that utilizes his strategic and operational management skills.
Este documento explica cómo realizar una amortización para un préstamo de $1,200 a 12 meses con una tasa de interés anual del 17.5%. Incluye una tabla con los pagos mensuales de interés, capital, y saldo restante. Explica los pasos para calcular los valores de cada cuota, incluyendo la tasa de interés mensual, el pago mensual total, y las fórmulas para calcular el interés, capital y saldo para cada mes.
Douglas Gallant has over 30 years of experience in management consulting, marketing, finance, and retail. He holds an MBA from Dalhousie University and a Bachelor of Commerce from the University of Calgary. His career includes positions in energy production analysis, grocery retail management, and financial analysis. Currently he works as an independent management consultant providing solutions for business operations and processes.
ESRI ERUC 2014 - Easy Automation for Process EfficienciesTammy Kobliuk
This document discusses easy process automation ideas to improve work efficiencies at the City of St. Albert. It provides an overview of the organization and current GIS environment. The benefits of automation including efficiency, accuracy, repeatability and transferring tasks are outlined. Several automation tools available in ESRI's suite are presented, including ModelBuilder, Data Driven Pages, and FME. Specific automation examples implemented at the city are described, such as server data updates, census preparation, and photo radar forms generation. Future plans include adding more error checking and using Python scripting.
Douglas Gallant has over 30 years of experience in management consulting, marketing, sales, and retail. He has held positions in computer product research, management consulting, alarm system sales, and retail management. Gallant has an MBA from Dalhousie University and a Bachelor of Commerce degree from the University of Calgary. He is seeking a progressive, performance-oriented position that utilizes his strategic skills and experience in diverse industries.
Building Integrated Photovoltaics BIPV
Sistemas Fotovoltaicos Integrados a Edificios SFIE Reemplazan materiales convencionales de Construcción por Sistemas Solares integrados a la arquitectura
Dokumen tersebut membahas tentang metode interpolasi, yaitu teknik untuk memperkirakan nilai tengah antara titik data yang diketahui. Metode yang dijelaskan antara lain interpolasi beda terbagi Newton, Lagrange, dan Spline."
FME 2014 - Automating Creation of 911 Compliant DataTammy Kobliuk
This document discusses automating the creation of 911 compliant street data from multiple municipalities. It describes combining road network data from St. Albert, Sturgeon County, and the City of Edmonton and transforming the non-standard data into a consistent format that meets 911 dispatch requirements. The process involves filtering, renaming, reclassifying streets, and extracting address information to generate a regional road network dataset that can be used by emergency services.
GEOALBERTA 2015 - StAlbert - Do You Measure UpTammy Kobliuk
This document discusses the importance of analytics for GIS departments and how to implement them. It explains that analytics can demonstrate value, accountability, and performance. Departments should tie analytics to organizational goals and use specific, relevant targets and indicators to measure progress. A variety of tools and platforms can provide data for analytics, and different visual formats can help communicate results to diverse audiences. The key is to select the right metrics and be intentional about how analytics inform decisions and resource allocation.
Rusia entregó 30 toneladas de ayuda humanitaria a Ecuador, incluyendo alimentos, tiendas de campaña, generadores y artículos de higiene, para ayudar a aliviar las consecuencias del devastador terremoto de abril de 2016 que dejó cientos de muertos y miles de heridos en el país. El presidente ruso transmitió sus condolencias al presidente ecuatoriano poco después del terremoto y Rusia respondió a la solicitud de asistencia de las autoridades ecuatorianas para establecer campamentos y atender a las personas que
This document outlines procedures for analyzing interior forest areas. It defines interior forest criteria as forest patches more than 60m from non-forest edges and 30m from other edge types. The procedures describe both vector- and raster-based methods for identifying interior forest patches based on these criteria. Key steps include buffering different edge types, intersecting the results to remove edge effects, and applying a minimum patch size threshold. Issues around choosing an appropriate cell size for raster analysis are also discussed.
Este documento presenta la propuesta de una Planta de Tratamiento de Aguas Residuales (PTAR) llamada Eco Lógica, la cual utiliza un esquema de flujo vertical por laberinto. Se describen las diferentes etapas del proceso y se muestran ejemplos de PTAR instaladas anteriormente en Colombia por esta compañía, incluyendo detalles sobre las ubicaciones y clientes. El documento concluye agradeciendo la atención del lector.
This document provides information about Shiksha Adhikar Org, a social welfare organization working on government projects related to education support for poor and unemployed individuals. It details the organization's involvement with projects run by the Central Government like PMKVY and NDLM. The document also outlines the process for setting up a training center under PMKVY, including requirements, validation, training, exams, certification, and funds disbursement. Key steps include choosing a sector/course, setting up infrastructure, getting approval, conducting training, exams, and job placements to receive funds.
PICTOMETRY 2014 - Integrating Pictometry Into Your Municipal OperationsTammy Kobliuk
This document discusses St. Albert's use of Pictometry aerial imagery in municipal operations. It provides an overview of St. Albert's imaging strategy and toolkit, which includes digital orthophotos collected every two years through a regional partnership as well as oblique Pictometry imagery and LiDAR data. Pictometry imagery is collected for the entire city every two years and made available to over 165 staff accounts across 18 departments through an online viewer. Several case studies demonstrate how Pictometry has improved operations for assessment, emergency response, development inquiries and more. Usage and positive user feedback statistics indicate the value and return on investment of Pictometry. Future plans include continued bi-annual collection and adding building footprints and 3D
Jim Gray presented on his work with large databases and grid computing. He discussed two major projects - TerraServer and SkyServer/World Wide Telescope. TerraServer is a photo database of the United States containing over 15 TB of imagery data accessed through an SQL database. SkyServer is a database of astronomical data containing images and attributes of celestial objects from surveys like SDSS. Gray discussed lessons learned from building and managing these large databases, and future plans to build databases from inexpensive disk bricks. He advocated for grid computing through web services as a way to federate and access distributed data sources on the internet.
Making Earth observation data available by using Amazon S3 is accelerating scientific discovery and enabling the creation of new products. Attend and learn how the scale and performance of Amazon S3 lets earth scientists, researchers, startups, and GIS professionals gather and analyse planetary-scale data without worrying about limitations of bandwidth, storage, memory, or processing power. Co-presented with support of the Australian Geoscience Data Cube collaboration, DigitalGlobe’s Geospatial Big Data Platform and the developer of the popular ObservedEarth mobile app.
Speakers:
Craig Lawton, Public Sector Solutions Architect, Amazon Web Services
Lachlan Hurst, Observed Earth
Matt Paget, Senior Experimental Scientist, CSIRO
Dan Getman, Digital Globe
The document summarizes discussions from Day 2 of the 2011 TERN Symposium. It describes presentations on TERN facility portals and 2010 Round 2 funding projects. It also summarizes discussions on TERN's role in environmental data collection, storage and distribution. The vision for TERN portals is to establish long-term ecosystem science as a priority, encourage long-term data management practices, and develop a network of long-term researchers. Strategies include promoting open access to data and developing robust cyberinfrastructure. The proposed portal architecture includes facility-specific and TERN-wide portals using common standards. Status updates indicate prototypes from four facilities with the TERN portal prototype available in late 2011.
PostGIS is a spatial extension for PostgreSQL that aims to make it compliant with the OpenGIS Simple Features for SQL standard. It adds spatial data types and functions to PostgreSQL, allowing spatial objects to be stored and manipulated like other database objects. PostGIS indexes spatial data using GiST to enable fast spatial queries in SQL. The open source PostGIS software helps enable more open and affordable spatial databases and GIS applications.
This document discusses how GIS organizations can maximize the benefits of LiDAR data. It describes what LiDAR is, different LiDAR systems, and challenges of working with large LiDAR datasets. Traditionally, LiDAR data was managed on a project-by-project basis, but an enterprise GIS workflow allows data to be accessible for multiple applications and users. Example applications shown include forestry, natural resource management, energy, and emergency management. The presentation concludes that cloud computing, web services, and open data sharing are enabling easier and more collaborative use of LiDAR data within GIS.
2015 FOSS4G Track: Analyzing Aspen's Community Forest with Lidar, Object-Base...GIS in the Rockies
The city of Aspen has a diverse and extensive community forest comprised of natural forested areas, street and park trees, yard trees, and riparian corridors. Trees are a key asset to experiencing downtown Aspen. In this study, we utilized several open source GIS software to analyze the tree canopy extent as well as new tree planting areas. Several land cover metrics were calculated using geoprocessing routines across a variety of spatial planning scales including city limits, parcels, and zoning categories. The data informs planning and development, stormwater modeling, education/outreach, and natural areas monitoring. Methods, tools, and results will be presented.
This document provides an overview of ArcGIS and its components. It discusses how data are stored in ArcGIS using different data models over time, including coverages, shapefiles, and geodatabases. It describes the main ArcGIS applications - ArcMap for viewing and editing data, ArcCatalog for data management, and ArcToolbox for geoprocessing tools. It also outlines some key ArcGIS extensions for spatial, geostatistical, and 3D analysis.
The document discusses challenges and strategies for digital preservation. It outlines a life cycle approach to digital archiving including metadata, storage, access, and preservation strategies like migration. Examples of digital preservation projects at Rutgers University are provided, such as databases of historical information and digital collections. Ensuring long-term access to digital content requires standards, documentation, addressing technology obsolescence, and establishing trusted digital repositories.
This document provides an introduction to geographic information systems (GIS). It defines GIS as a computer system for capturing, storing, analyzing and displaying spatial data. The summary describes the key components of a GIS, including software, hardware, data, people and geographic information. It also outlines some basic functions of GIS like data capture, storage, querying, analysis and display. Finally, it discusses vector and raster data formats and provides examples of how GIS can be used.
Accelerating Delivery of Data Products - The EBSCO WayMongoDB
EBSCO Information Services (EBSCO) is the leading provider of electronic journals, magazines, eBooks, audioBooks, and online research content for libraries, including hundreds of research databases, historical archives, point-of-care medical reference, and corporate learning tools serving millions of end users at tens of thousands of institutions worldwide. The EBSCO platform is a widely used platform serving the needs of researchers at all levels in academic institutions, schools, public libraries, hospitals, medical institutions, corporations and government institutions. Data is our business, and delivering new products quickly is our competitive advantage. We build hundreds of data products and accelerating the analysis, transformation of new datasets translates to revenue and competitiveness. And since our data is so varied, using MognoDB to store data flexibly and JSON Studio to analyze this data allows us to deliver products to market faster. In this session we will describe this process that helped us expedite delivery of new datasets, and give real examples of how data is used, analyzed and processed.
Talk given by prof. T.K. Prasad at the workshop on Semantics in Geospatial Architectures: Applications and Implementation. The workshop was held from October 28-29, 2013 at Pyle Center (702 Langdon Street, Madison, WI), University of Wisconsin-Madison.
A presentation conducted by Dr Rohan Wickramasuriya, SMART Infrastructure Facility, University of Wollongong. Presented on Tuesday the 1st of October 2013.
Business Intelligence (BI) has popularly been adopted as a process that enables easy access, analysis and visualization of information through specialized set of tools for informed decision making. Two most noticeable characteristics of traditional BI is that it (a) is largely used in single-organization environments and (b) uses predominantly aspatial data. We believe that BI has applications beyond single-organization environments, but it very much requires integration of geospatial capabilities given the increasing availability of large volumes of spatial data and a growing interest to see things spatial. The SMART Infrastructure Dashboard (SID), our innovative solution that fuses BI and Geographic Information Systems (GIS), fills this significant gap. In this study, we demonstrate how SID can be used to perform spatio-temporal analysis and
visualization of diverse sets of data to uncover complex interrelationships among utility usage, demographics and weather patterns at local and regional scale.
Data curator: who is s / he? Findings of the IFLA Library Theory and Research...Anna Maria Tammaro
The document summarizes findings from a research project on data curation roles and responsibilities. It outlines the project's phases which included a literature review, content analysis of job postings, and interviews. The content analysis of over 400 job postings found that roles involved in data curation have diverse titles and responsibilities often include instruction, reference, outreach, access, and preservation services. Data curators work to ensure long-term access and understanding of research data across its lifecycle.
This document discusses tools for working with data from the Multi-angle Imaging SpectroRadiometer (MISR) instrument. It describes the MISR data products, which are large HDF files containing multiple image blocks. Tools covered include HDFScan for viewing metadata, MISRView for analyzing imagery within IDL, ERDAS Imagine for GIS analysis with raster and vector data overlay, and L1B2_to_geotiff for converting to geotiff format to use in other software. The tools address different user needs from simple data browsing to advanced analysis and allow scientists to access and work with MISR's large, complex Earth science data products.
A comparison of three applications running at Family Search that use various Datastax technology. We look at characteristics of the applications, the design of the application, and how these are facilitated by DSE services.
Materials Data Facility: Streamlined and automated data sharing, discovery, ...Ian Foster
Reviews recent results from the Materials Data Facility. Thanks in particular to Ben Blaiszik, Jonathon Goff, and Logan Ward, and the Globus data search team. Some features shown here are still in beta. We are grateful for NIST for their support.
This document discusses big data and Hadoop. It begins by defining big data and explaining the volume, variety, and velocity of data being generated. It then provides an overview of Hadoop, including its origins, architecture, core components of HDFS and MapReduce, and Hadoop ecosystems like Hive. HDFS provides a distributed file system for large data storage, while MapReduce allows processing of large datasets in parallel across clusters. Hive allows querying and analysis of large datasets stored in Hadoop. Overall, the document serves as an introduction to big data concepts and the Hadoop framework for distributed storage and processing of large and diverse datasets.
This document summarizes Kx Systems, a company that provides a high-performance time-series database called kdb+. Kdb+ can process and analyze large volumes of real-time and historical time-series data extremely fast with low latency. It is widely used in financial services and is now being applied to other industries like manufacturing, utilities, and life sciences. Kx Systems offers software, consulting services, and can help clients integrate kdb+ with their existing technologies and scale their deployments.
This document outlines a strategic plan for implementing a corporate geographic information system (GIS) at the City of St. Albert over 2007-2009. The plan establishes a mission and guiding principles for the corporate GIS. It defines a vision of having a robust, secure, and high-quality GIS by 2009 that empowers users. Key outcome goals are alignment with business needs, data quality, ease of access, integration with business systems, education/awareness, and sustainability. Operational strategies and an implementation schedule are provided to achieve this vision and goals over the 3-year period.
This document discusses best practices for measuring landscape metrics using GIS data. It covers topics such as choosing an appropriate raster cell size, defining patch types, defining the study area, and using software like Patch Analyst. The key points are that the data preparation process is time-consuming, the scale and accuracy of the data impacts the metrics, and interpreting the results requires an understanding of the relevant ecology.
This document provides information about common tree species found in the Barrier Lake Area of Kananaskis Country, Alberta. It identifies both broadleaf and conifer tree types and provides details about key identifying features such as appearance, leaves or needles, bark, cones, and examples of each species in stands. Species described include lodgepole pine, white spruce, Douglas fir, subalpine fir, Engelmann spruce, alpine larch, trembling aspen, and balsam poplar.
This document provides information about the AVI (Alberta Vegetation Inventory) including the types of information it contains such as tree species, stand heights, crown closure, moisture regime, and origin. It describes the different tree species, stand structures, crown closure densities, moisture regimes, and stand modifiers that may be present. It also discusses naturally non-forested and anthropogenic non-vegetated land types as well as considerations for interpreting the data.
MAGG 2012 - Municipal Census Best PracticesTammy Kobliuk
The document outlines best practices for planning, executing, evaluating, and analyzing a municipal census. It discusses establishing a master address list, designing enumeration boundaries and databases, executing the census using paper forms or online/mobile tools, quality checking results, and analyzing results to understand demographics, trends, and service needs at both basic and advanced levels. The goal is to maximize the value of census data through thorough planning and analysis.
This document provides an overview of GIS priority setting, including why it is important to set priorities, key considerations, different prioritization methods, criteria for prioritization, and a case study of how the City of St. Albert implemented GIS priority setting. Some key points:
- Setting priorities is important to manage limited resources and budgets effectively and avoid "fire-fighting".
- Key considerations include governance structure, customization, criteria, process, and flexibility.
- Common prioritization methods include Covey's quadrants, matrices, ABC, and paired comparisons.
- Criteria may include importance, impact, urgency, dependencies, and more.
- St. Albert used a hybrid approach of triage
This document summarizes the implementation of a GIS portal project for a municipality. Key points include:
- The original plan was to complete the project within 13 months, but various delays and issues extended the timeline significantly. This included changes in project leadership, an extensive site rebuild, difficulties scheduling training sessions, and periods where no progress was made.
- The requirements analysis process did not involve client interviews and made assumptions about needs. The scope was later found to be too generic.
- Contracting a vendor led to many errors that took 4 months to resolve, with difficulties differentiating issues between software and custom code.
- An in-house rebuild of the site from scratch improved understanding, documentation, and
GEOALBERTA 2013 - I Spy With My Little Eye - St AlbertTammy Kobliuk
The document discusses St. Albert's aerial imaging strategy and use of Pictometry. It provides background on St. Albert and the evolution of its imagery collection over time. Pictometry imagery has become an important tool for many city staff since its introduction in 2012-2014, providing 3D views unavailable from other sources. Key users include Assessment, Recreation, Public Works, Engineering, and Fire Services. Example uses highlighted are property assessment, examining encroachments, bus stop reviews, park infrastructure planning, and fire pre-planning. The city sees continued value in Pictometry as a vital part of its imaging strategy.
A Successful Pictometry Implementation Story - 2016OctTammy Kobliuk
The document summarizes St. Albert's implementation and use of Pictometry aerial imagery. It describes the city's flight history since 2012 and funding model. Technical specifications for the 2016 flight included 7.5cm resolution and no AccuPlus correction. Over 180 named user accounts have access to the cloud-based imagery in the corporate GIS system. Key users include Engineering, Public Works, and Recreation & Parks. Usage has grown steadily, with over 4,500 image views in the last 30 days. The imagery supports various municipal functions like utility billing, development permitting, and fire prevention. Future plans include integrating the imagery with 911 and capturing building footprints.
A Successful Pictometry Implementation Story - 2016Oct
portland2003_animated
1. Portland, Oregon
October 27-28, 2003
A
Sustainable Resource Development
Lessons Learned
From Handling More Data
Than
Grains of Sand on the Earth
Presenter: Tammy Kobliuk
Resource Analysis Section
Forest Management Branch
Public Lands and Forest Division
Alberta SRD
2. Portland, Oregon
October 27-28, 2003
A
Sustainable Resource Development
Brief Overview
• A little bit about Alberta
• A brief history of GIS in SRD
• Our technical setup
• Data, data, data…
• Analysis challenges
• Technical challenges
• Lessons learned
• What the future holds
4. Portland, Oregon
October 27-28, 2003
A
Sustainable Resource Development
An Alberta Primer
• We’re big.
• We have oil & gas, cows, trees, and grain.
• We are considered a “Prairie” province.
• We are where the prairies meet the mountains
(those little things we call the Rockies).
5. Portland, Oregon
October 27-28, 2003
A
Sustainable Resource Development
Where are we?
ÊÚ
ÊÚ
British
Columbia
Alberta Saskatchewan
Manitoba
Ontario
Washington
Oregon Idaho
Montana
Wyoming
North Dakota
South Dakota
Nebraska
Minnesota
Iowa
Wisconsin
Michigan
California Nevada Utah
Colorado Kansas Missouri
Illinois
Alaska
Edmonton
Portland
6. Portland, Oregon
October 27-28, 2003
A
Sustainable Resource Development
How big are we?
• 66,258,096 Hectares
• 662,581 Square Km
• 255,824 Square Miles
• 163,726,700 Acres
• 2 UTM zones
7. Portland, Oregon
October 27-28, 2003
A
Sustainable Resource Development
A Size Comparison
Washington +
Oregon +
Nevada =
ALBERTA
8. Portland, Oregon
October 27-28, 2003
A
Sustainable Resource Development
Tiling the province
• 50 1:250 000 NTS
mapsheets
• 764 1:50 000 NTS
mapsheets
• 7204 Townships
• > 1 million
quartersections
• 4400+ Phase 3
mapsheets
18. Portland, Oregon
October 27-28, 2003
A
Sustainable Resource Development
Who Are the Resource Analysis Section?
Forest Protection
Resource Analysis Section
Forest Health
Forest Planning
Harvest and Renewal
Forest Management Branch
Forest Operations
Forest Business
Public Lands and Forest Fish & Wildlife PLFD Regions
Sustainable Resource Development
19. Portland, Oregon
October 27-28, 2003
A
Sustainable Resource Development
What do we do?
• Review timber supply and technical analysis
of company management plans.
• Timber supply analysis and technical analysis
for Crown management plans.
• Provincial-scale reporting to federal govt.
• Development of modeling tools and analysis
procedures.
• Development/maintenance of specialized
databases.
20. Portland, Oregon
October 27-28, 2003
A
Sustainable Resource Development
What else do we do?
• Technical support for departmental
initiatives.
• On-demand analysis for the
Minister’s office.
• Answer Freedom-of-Information
(FOIP) requests.
• Any other priorities-of-the-day.
21. Portland, Oregon
October 27-28, 2003
A
Sustainable Resource Development
A Brief History of GIS in the
Forest Management Branch
• In the beginning…there were dot grids and
colored pencil crayons.
• Terrasoft was purchased in the late 1980’s to early
1990’s.
• Terrasoft was retired in 1995 when ArcInfo and
ArcView were first purchased.
• Widespread ArcView training commences in 2001
with the implementation of the Citrix ArcView
project. Forest Management is the primary driver.
22. Portland, Oregon
October 27-28, 2003
A
Sustainable Resource Development
…
• Base data has always been managed by the
Resource Data Branch.
• The original capture of digital elevation data was
in the 1980’s for the purpose of contour creation.
This data is still in use today.
• The original capture of the base data was by CAD
systems. This has been improved and updated to
attributed ArcInfo-ready files.
23. Portland, Oregon
October 27-28, 2003
A
Sustainable Resource Development
…
• Resource Data Branch was de-centralized in the
mid-to-late 1990’s as “GIS” staff were sent out to
colonize the regions. These staff were primarily
CAD users and had little GIS training.
• Forest Management GIS staff are located only in
Edmonton.
• Edmonton no longer has control over regional GIS
staff.
• Control over computer equipment purchases has
been returned to Edmonton.
25. Portland, Oregon
October 27-28, 2003
A
Sustainable Resource Development
General Setup
PCSunBlade workstation
Data drive
Data drive
Data drive
Data drive
PC
PC
PC
PC
Citrix Application Server
Data Server
Citrix
Server
Farm
Server Room
FMB
26. Portland, Oregon
October 27-28, 2003
A
Sustainable Resource Development
Basic Hardware
• Sunblade 1000 dual CPU workstation with
500 GB storage space.
• Compaq workstations: dual CPU, dual
harddrive, CD writer, DVD, 21” monitors
• HP2500 Plotter (soon to be replaced)
27. Portland, Oregon
October 27-28, 2003
A
Sustainable Resource Development
GIS Software
• ArcInfo 7.2.1 and 8.2 Workstation (Solaris)
– 2 Node locks
– 2 Floating
• ArcView 3.2 (Windows 2000)
• ArcView 8.2
• ArcIMS and ArcExplorer
• SDE (Resource Data Branch only)
28. Portland, Oregon
October 27-28, 2003
A
Sustainable Resource Development
Remote Sensing Software
• ERMapper 6.3
– Image processing
– Image compression (.ECW)
• Erdas Imagine Professional 8.5
– Primarily legacy modelling
29. Portland, Oregon
October 27-28, 2003
A
Sustainable Resource Development
Enabling Software
• Hummingbird Exceed for XTerming
into unix workstation.
• Samba for serving out unix data drives.
• Citrix Metaframe for serving out thin
client ArcView and regional data.
• Oracle for enterprise database
applications. *Note: Not currently
available to ArcInfo users.
30. Portland, Oregon
October 27-28, 2003
A
Sustainable Resource Development
Little Added Extras
• Adobe Acrobat 5
• CorelDraw 9 and Corel
PhotoPaint 9
• Microsoft Office 2000
• FoxPro
31. Portland, Oregon
October 27-28, 2003
A
Sustainable Resource Development
Software Maintenance
• When you’re big, costs are high.
• $225,000 to ESRI annually for SRD.
• ArcView 3.2 to ArcView 8.x
conversion comes with a steep annual
pricetag.
• ~$68,000 annual FMB costs.
• $ 3 million just to migrate operating
systems.
33. Portland, Oregon
October 27-28, 2003
A
Sustainable Resource Development
Sure there’s data, but…
• Who has it?
• Can you get it?
• What scale is it?
• Where do you store it?
• What does it cover?
• How good is it?
• How old is it?
34. Portland, Oregon
October 27-28, 2003
A
Sustainable Resource Development
Where’s the Data?
Data
Resource Data Branch
Spatial Data Warehouse
FMA-Holders
Federal Government
Research
Organizations
Internet
Other Provincial
Agencies
35. Portland, Oregon
October 27-28, 2003
A
Sustainable Resource Development
Data Acquisition in Canada
• Very little available for free.
• Cost recovery model for
governments.
• Most data is licensed.
• Can be very difficult to find out
who has it.
• When you can find it, costs are
often prohibitive.
36. Portland, Oregon
October 27-28, 2003
A
Sustainable Resource Development
Base Data in Alberta
• ESRI Digital Chart of the World
• Provincial 1:1 million
• Federal 1:250,000 and 1:50,000
• Provincial 1:20,000 (and
1:50,000)
• Local (municipalities, cities and
utilities)
37. Portland, Oregon
October 27-28, 2003
A
Sustainable Resource Development
Data Storage
• Resource Data Branch is the primary data
repository and distribution arm for SRD.
• Regional/Area offices load and maintain
detailed base information for their areas.
• The Citrix data server is the only central
accessible data repository for users.
• FMB stores all data acquired for projects
for internal use only.
38. Portland, Oregon
October 27-28, 2003
A
Sustainable Resource Development
Vegetation Data
• Canada/Alberta Land Inventories
• Ecological and biophysical inventories
• Satellite classification
• Strategic level Forest/Vegetation Inventories
• Wetland Inventory
• Prairie Vegetation Inventory
39. Portland, Oregon
October 27-28, 2003
A
Sustainable Resource Development
More on Strategic Level Inventories
• Phase 1
• Phase 2
• Phase 3
• AVI 1.0
• AVI 2.1 * The current standard
• AVI 2.2
40. Portland, Oregon
October 27-28, 2003
A
Sustainable Resource Development
Data Coverage
It’s hard to know what coverage we have for
what data. There are few accessible maps
detailing the age and coverage of base,
vegetation, and other data.
41. Portland, Oregon
October 27-28, 2003
A
Sustainable Resource Development
Coverage Example:
Vegetation Inventories
• Phase 1, Phase 2, Phase 3
• Alberta Vegetation Inventory: CVI, AVI
1.0, AVI 2.1, AVI 2.2.
43. Portland, Oregon
October 27-28, 2003
A
Sustainable Resource Development
Data Quality?
Reports on data quality and
acquisition specifications
are not readily available to
internal staff, let alone the
general public.
45. Portland, Oregon
October 27-28, 2003
A
Sustainable Resource Development
Projections, anybody?
• Alberta covers 2 UTM
zones
• A single projection
requires a custom
projection (10TM)
• Local: 3TM
• Agriculture: Albers
• Canada: Lambert
11 12
46. Portland, Oregon
October 27-28, 2003
A
Sustainable Resource Development
Size of study areas…
• Extremely large areas of contiguous
industrial forest land.
• Massive size of individual tenures and
management units.
• Undergoing amalgamation of units.
• Multi-jurisdiction study areas.
47. Portland, Oregon
October 27-28, 2003
A
Sustainable Resource Development
The Multi-Use Landbase
• There is a phenomenal amount of activity
modifying the landscape in some areas of
the province.
• Oil & gas, grazing, forestry and recreation
are all on some of the same areas.
• Datasets are out-of-date the moment they
are completed.
48. Portland, Oregon
October 27-28, 2003
A
Sustainable Resource Development
Seamless Data?
• Only recently has it been possible to order
seamless base data in coverage format.
• 110+ vegetation inventory datasets to cover
forested areas.
– Overlaps
– Different dates
– Differing quality
– Differing database formats
49. Portland, Oregon
October 27-28, 2003
A
Sustainable Resource Development
Provincial Analysis
• No seamless spatial vegetation dataset.
• 3.85 million inventory polygons over 110+
datasets.
• How to create a provincial dataset that can
incorporate data of differing dates and
specifications?
• Do you need stand-level data?
• Can you use proxies?
50. Portland, Oregon
October 27-28, 2003
A
Sustainable Resource Development
Change Over Time
• Keeping data for a project “up-to-date”
is impossible.
• Choose an effective date for analysis.
Document this.
• Make and document assumptions
surrounding dated data.
• Choose a projection and datum and
stick with it. Document this.
51. Portland, Oregon
October 27-28, 2003
A
Sustainable Resource Development
Confidentiality
• Company DFMP submissions are
confidential.
• Who should have access to what?
• What type of access should they have?
• How do you implement those access
restrictions?
52. Portland, Oregon
October 27-28, 2003
A
Sustainable Resource Development
Getting Information From Your Data
• Does your data require massaging to extract
useful information?
• Can the data be enhanced by attribute
rollup?
• Can the data be enhanced by predictive
modelling?
53. Portland, Oregon
October 27-28, 2003
A
Sustainable Resource Development
Case Study:
Interior Forest Analysis
• Study Area: single FMA 3.5 million Ha
• Source data: ArcInfo Library (~2.25
million polygons in 406 tiles)
• Attributes in separate .dbf file.
• Problem undefined.
• Solution undefined.
54. Portland, Oregon
October 27-28, 2003
A
Sustainable Resource Development
Timeline
• 2 weeks to nail down the exact problem and
formulate the solution(s). Solution(s) were
programmed for automation.
• 2 weeks to complete data prep and spatial
analysis.
• 1 day to compile final datasets.
• 5 minutes to run Patch Analyst for final
landscape metrics.
55. Portland, Oregon
October 27-28, 2003
A
Sustainable Resource Development
Obstacles
• Had to create input datasets tile-by-tile since
the entire spatial net landbase could not be
extracted.
• Could not grid off the entire FMA at 5 m.
• Difficult to partition the landscape into
smaller pieces.
• Vector processes took an inordinate amount
of time.
• We seemed to hit every software and
hardware limit possible.
56. Portland, Oregon
October 27-28, 2003
A
Sustainable Resource Development
Raster vs Vector
• Raster data sets were very large.
• Raster processes were comparable to vector
processes on simpler landscapes.
• Raster processes were faster than vector
processes on complex landscapes.
• Raster outputs were easier to check than
vector.
57. Portland, Oregon
October 27-28, 2003
A
Sustainable Resource Development
From Plan A to Plan D
• Plan A: Grid off the entire FMA and run
analysis.
• Plan B: Run entire FMA as vector
• Plan C: Partition the FMA and run pieces
as raster.
• Plan D: Run remaining partition as vector.
59. Portland, Oregon
October 27-28, 2003
A
Sustainable Resource Development
Lots of Data Means…
• Disk space issues:
– How many should you have?
– Where do you put them?
– How big should they be?
• Backup issues.
• Archiving issues.
• File management issues.
60. Portland, Oregon
October 27-28, 2003
A
Sustainable Resource Development
Large Datasets Mean…
• Streaming live data requires lots of
network bandwidth.
• Hardware, operating systems, and software
need to be optimally tuned.
• Unix systems may still out-perform PC’s.
• Data display needs to be managed.
• Data format needs to be carefully chosen.
61. Portland, Oregon
October 27-28, 2003
A
Sustainable Resource Development
Size is Relative
• What’s large for you?
• What’s large for the
software developer?
• Are software limits
documented? Can you
find limits prior to running
a process?
62. Portland, Oregon
October 27-28, 2003
A
Sustainable Resource Development
So Your Command Ran…
So What?
• ArcInfo commands may run to completion
on large datasets, but:
– Did it really complete?
– Did it run correctly?
– How do you check it?
– Did it clean up after itself?
63. Portland, Oregon
October 27-28, 2003
A
Sustainable Resource Development
Plotting Large Files
• Print directly from ArcView or ArcGIS.
OR
• Export to .eps and use Image Alchemy
to convert to on-the-fly RTL.
• Export to .eps and use Adobe Acrobat
Distiller to create .PDF files.
64. Portland, Oregon
October 27-28, 2003
A
Sustainable Resource Development
Data Transfer
How to transfer very large files?
• Attempt to avoid ftp timeout.
• Compress and burn to CD.
• Get into burning DVD’s.
• Dig out the old tape drive.
65. Portland, Oregon
October 27-28, 2003
A
Sustainable Resource Development
Moving to Geodatabase
• The 2GB Personal Geodatabase limit is too
small for many datasets.
• We don’t currently have Oracle access.
• We don’t have an Oracle DBA.
• We don’t have an SDE license. Needed?
• It’s not feasible to port all of our data.
• Is Oracle Personal an option?
66. Portland, Oregon
October 27-28, 2003
A
Sustainable Resource Development
SDE?
• SDE requires a lot of up-front Oracle
database tuning.
• Requires a knowledgeable administrator.
• $$$ Purchase cost and $$ annual
maintenance.
• Fine for map display and
browsing/querying.
• Not good for spatial analysis.
68. Portland, Oregon
October 27-28, 2003
A
Sustainable Resource Development
The Basics
• Keep it simple!
• Newer doesn’t necessarily
mean better.
• Older doesn’t always mean
bad. (ie. AML)
• Don’t put all your eggs in one
basket (ie. Web deployment).
69. Portland, Oregon
October 27-28, 2003
A
Sustainable Resource Development
Knowledge and Creativity
• Know your data and what it can and should
be used for.
• Don’t reinvent the wheel. Look at what
others have done.
• There’s always more than one way to skin a
cat. Always have a plan B and C for when
plan A fails.
70. Portland, Oregon
October 27-28, 2003
A
Sustainable Resource Development
Technology
• Know your software. Use it.
• Use the best tool for the job. No one toolset will
do everything you need.
• Be cautious. Let other people find the bugs.
• Poorly planned software upgrades can become
“downgrades”.
• Monitor software and hardware developments.
• Do performance tuning on hardware/software.
71. Portland, Oregon
October 27-28, 2003
A
Sustainable Resource Development
Practice Good File Management
• Get rid of unnecessary and duplicate files.
• Archive to CD, DVD, and/or tape.
• Take responsibility for managing files
and data.
• Attempt to keep documentation.
• Standardize wherever possible.
72. Portland, Oregon
October 27-28, 2003
A
Sustainable Resource Development
Cost Management
• Consolidate software client numbers to take
advantage of secondary license pricing.
• Use your organization size or partnership
arrangement(s) to negotiate a deal.
• Consider floating licenses or software
servers to cut down on total license
numbers.
• Keep an up-to-date inventory of licenses.
73. Portland, Oregon
October 27-28, 2003
A
Sustainable Resource Development
Project Risk Management
• Don’t put all your eggs in the ArcView project
or ArcGIS map document baskets.
• Sever the reliance on data availability and
location.
• Save out legend and layer files.
• Save important maps as image files and/or .pdf
files. Burn them to CD. Have hard copies.
• Document, document, document…
74. Portland, Oregon
October 27-28, 2003
A
Sustainable Resource Development
Check Your Outputs
• Spatially view your data.
• Query out results.
• Do spot checks.
• Do topology checks.
75. Portland, Oregon
October 27-28, 2003
A
Sustainable Resource Development
To Contract or Not To
Contract?
• DO Use consultants wisely.
• DO contract out simple one-time projects
that regular staff don’t have time for.
• DO ensure transfer of skills to internal
staff.
• DON’T use them as a replacement for
internal staff.
• DON’T get too closely tied to any one
company
76. Portland, Oregon
October 27-28, 2003
A
Sustainable Resource Development
Failing the Bus Test?
• Inventory your data.
• Inventory your folders.
• Standardize your directory structure.
• Keep up on metadata for data.
• Keep up on metadata for projects.
77. Portland, Oregon
October 27-28, 2003
A
Sustainable Resource Development
Data Access Management
• Limit data exposure.
• Use different Samba shares to share out
specific directories.
• Use different Samba shares to enforce
access control.
• Use different Unix account groups to allow
for setting Unix permissions.
78. Portland, Oregon
October 27-28, 2003
A
Sustainable Resource Development
Change Management
• Don’t hardcode things that will change over
time. (ie. Administrative boundaries)
• Make use of relational databases to enable
partial updates.
• Plan for scalability.
79. Portland, Oregon
October 27-28, 2003
A
Sustainable Resource Development
Data Models
• Develop them from the start.
• Document them and make them available.
• Don’t let non-data people control Data
Model creation.
• Ensure proper representation of end-users in
the Data Model creation process.
• Ensure that the data model meets needs.
80. Portland, Oregon
October 27-28, 2003
A
Sustainable Resource Development
Learn
• Admit what you don’t know. Then try
to learn.
• The pace of change in both software
and hardware is extraordinary. Keep
tabs on it.
• You can’t be an expert on everything.
Know a little about a lot and a lot
about a little. Specialize.
81. Portland, Oregon
October 27-28, 2003
A
Sustainable Resource Development
Communicate
• Sell the technology from both ends.
(ie. To management while also
recruiting end-users).
• Communicate your
accomplishments.
• Share what you learn through
technology transfer. Generosity
pays dividends.
• Network with your peers.
83. Portland, Oregon
October 27-28, 2003
A
Sustainable Resource Development
• ArcGIS 9 Suite
• XML-based metadata
• A possible move to geodatabase
• Still AML, but possibly Python
• SDE and Oracle?
• More imagery
• Possible server consolidation
Software/Data
84. Portland, Oregon
October 27-28, 2003
A
Sustainable Resource Development
Expectations
• More demand for services.
• More complex analyses requested.
• More internal expectation of basic
ArcView skills.
• Internal training switch from
ArcView 3.2 to ArcView 8.x.
• More staff?