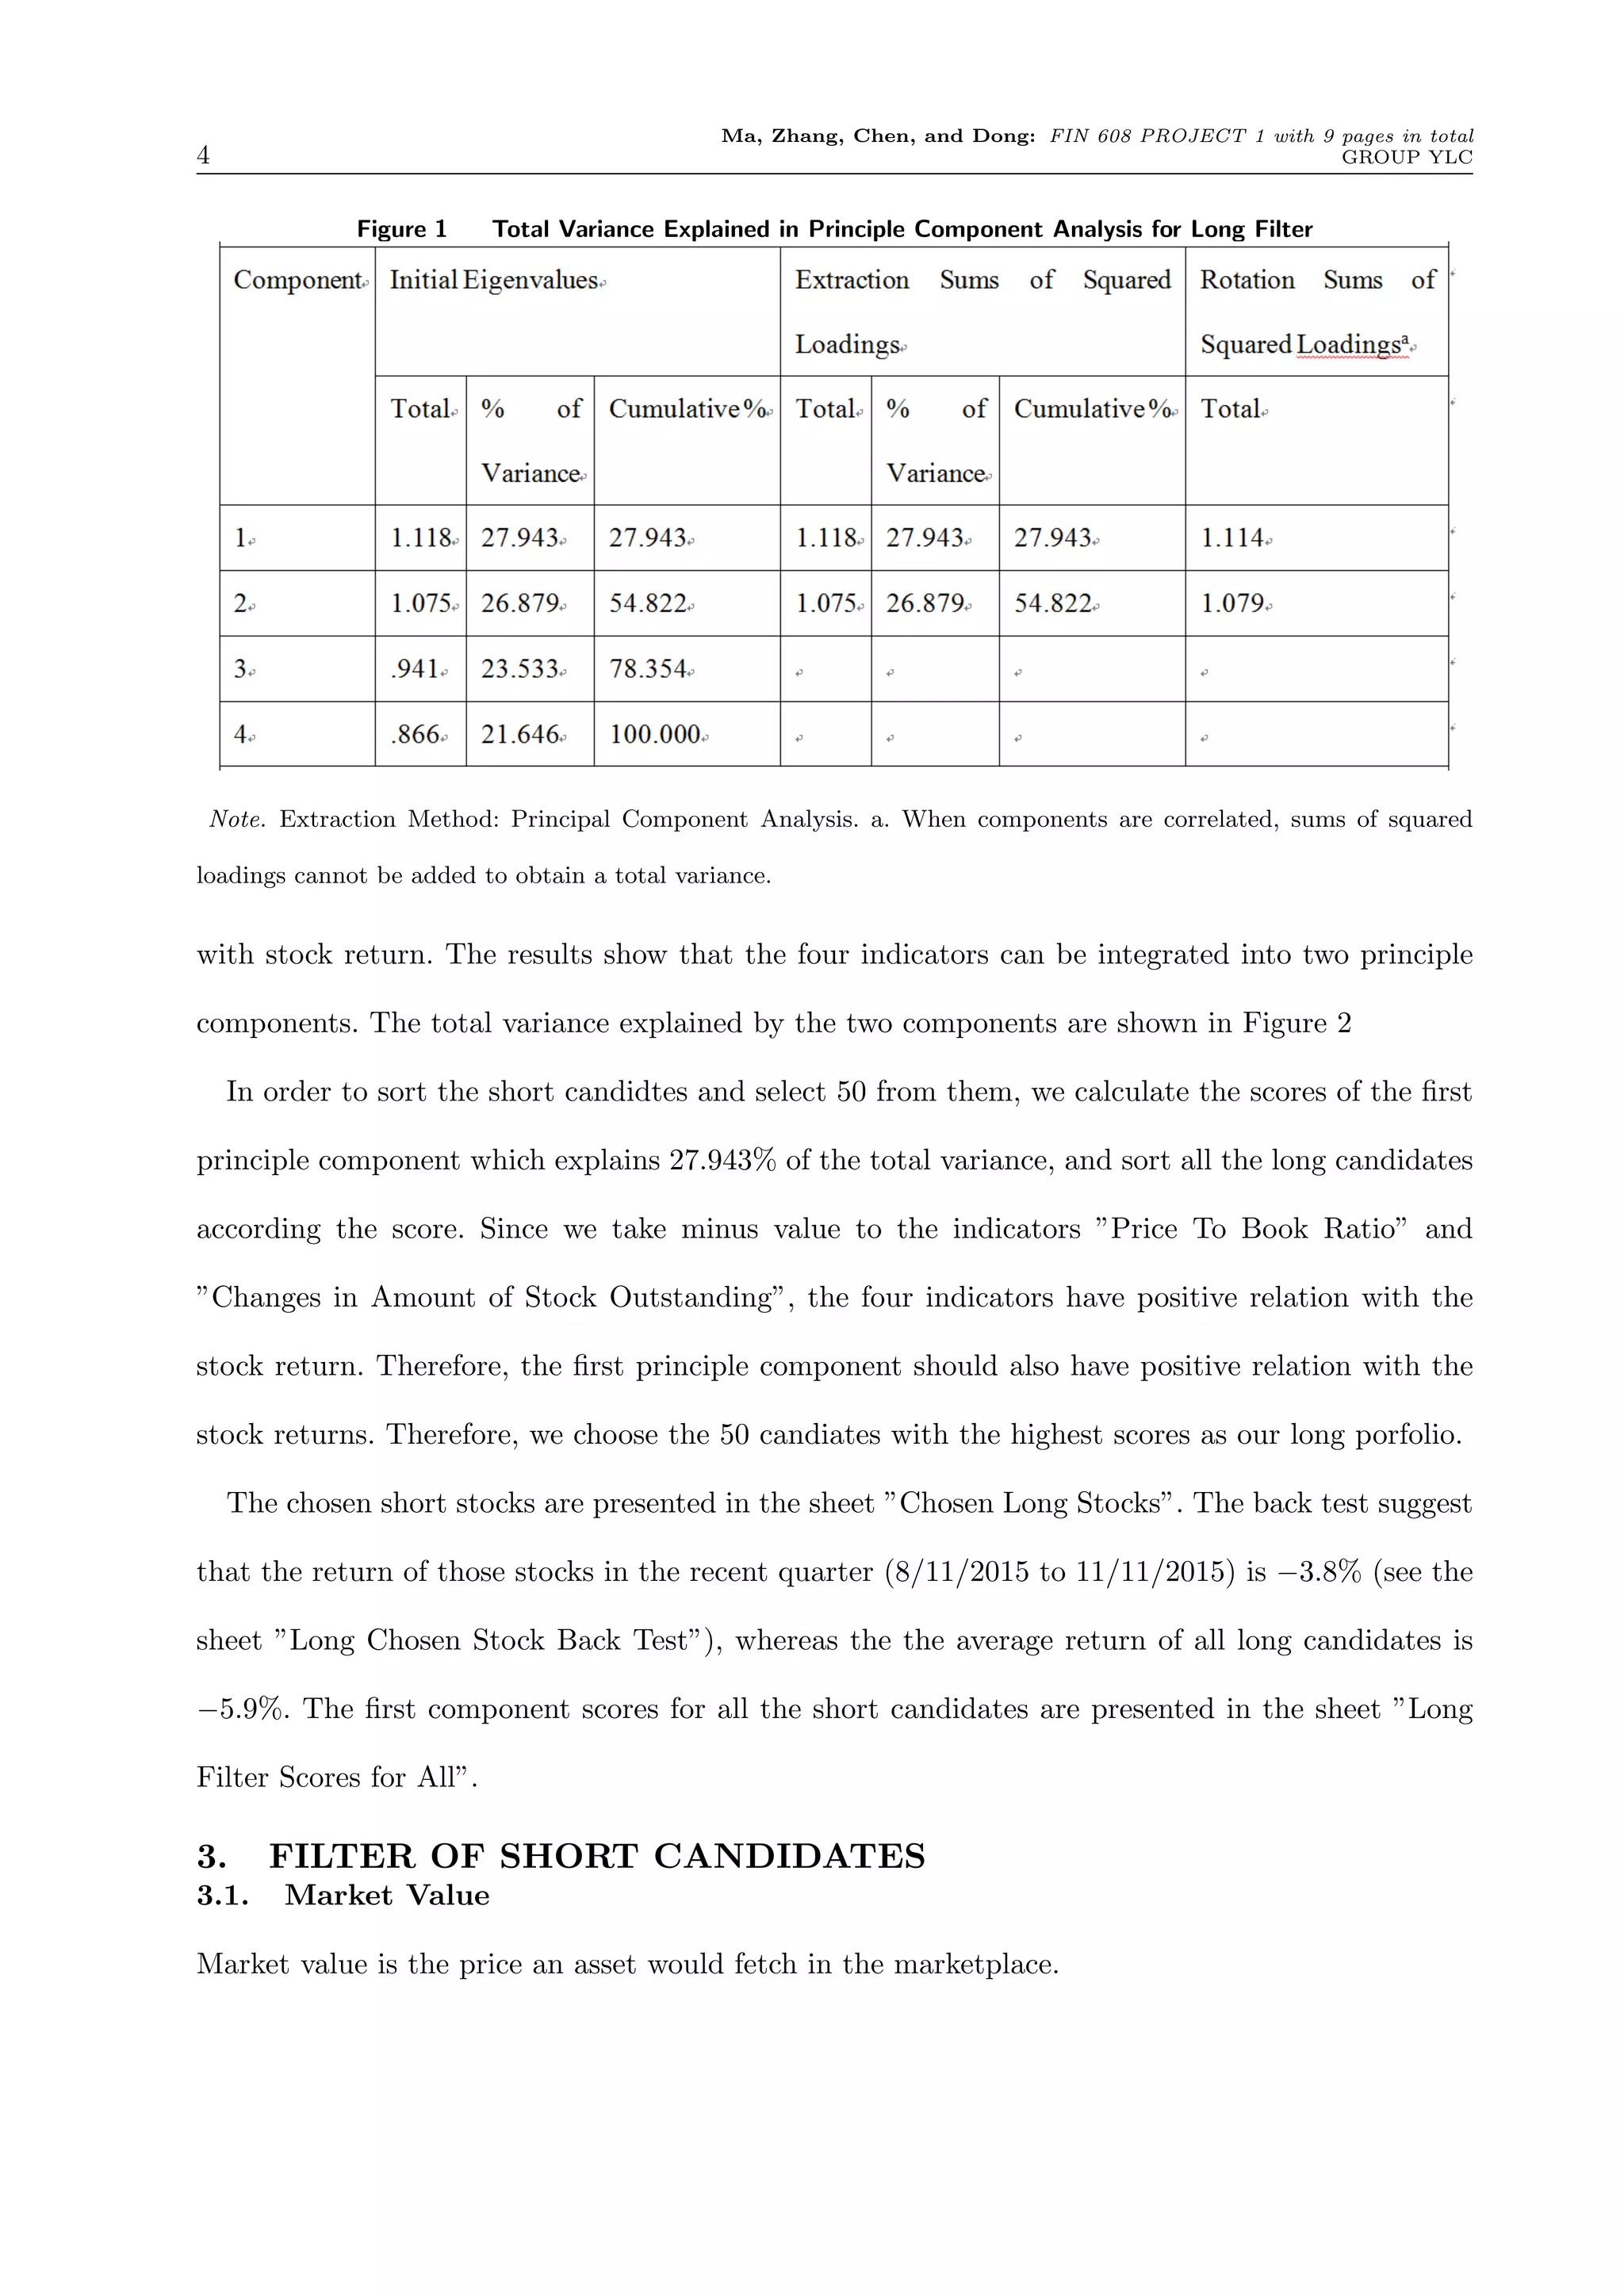
This document presents an analysis of factors to use in filtering stocks for long and short positions in a portfolio. For long positions, the factors of alpha, dividend yield, price-to-book ratio, and changes in stock outstanding are analyzed. For short positions, the factors of market value, price-to-book ratio, capital investment, and liquidity are considered. Principal component analysis is used to analyze the factors and scores are calculated to select 50 stocks for long and short positions that are backtested for returns. The results show the filtered portfolio outperformed the total market.
This document provides a report on a portfolio optimization project. It summarizes the construction, weekly performance, and rebalancing of a portfolio formed using Markowitz's modern portfolio theory. Over the course of a month, the portfolio was initially constructed using 20 stocks and was rebalanced weekly based on updated stock prices. The portfolio achieved a return of 4.58%, outperforming the S&P 500 benchmark. A risk analysis of the portfolio returns was also conducted using measures like the Sharpe ratio, Treynor ratio, and Sortino ratio.
For the first quarter of 2011, the markets brought some fancy footwork. In late January, the Middle East erupted in protest and violence, oil was surely going back to $200 a barrel, and consumer spending would subsequently slow.
1) The study examines the economic importance of accounting information by analyzing how accounting data from financial statements can improve portfolio optimization for US equities.
2) Using a parametric portfolio policy method, the researchers modeled portfolio weights as a linear function of three accounting characteristics - accruals, change in earnings, and asset growth - and compared it to weights based on size, book-to-market, and momentum.
3) They found that the accounting-based portfolio generated an out-of-sample annual information ratio of 1.9 compared to 1.5 for the price-based portfolio, indicating accounting information provides valuable signals for optimizing equity investments.
The document summarizes the mid-year 2011 Standard & Poor's Indices Versus Active Funds (SPIVA) Scorecard, which compares the performance of actively managed mutual funds to relevant benchmarks. Some key findings over the past 3 and 5 years include:
- Over 63% of large-cap, 75% of mid-cap, and 63% of small-cap US stock funds underperformed their benchmarks.
- Over 57% of global stock funds, 65% of international stock funds, and 81% of emerging markets stock funds underperformed.
- Over 50% of active bond funds failed to outperform benchmarks, except for emerging market debt funds.
- Asset-weighted returns also showed
The Risk and Return of the Buy Write Strategy On The Russell 2000 IndexRYAN RENICKER
Actionable trade ideas for stock market investors and traders seeking alpha by overlaying their portfolios with options, other derivatives, ETFs, and disciplined and applied Game Theory for hedge fund managers and other active fund managers worldwide. Ryan Renicker, CFA
The document discusses various concepts related to derivatives pricing including:
- Compounding rates used for interest rates underlying fixed income securities can be annual, semiannual, daily, etc. Continuously compounded rates help derive closed form solutions.
- Short selling involves borrowing and selling securities not owned with the obligation to buy them back later to return to the lender.
- The forward price relationship for assets paying coupons or dividends includes the income yield in the formula.
- Stock index futures can be viewed as an investment asset paying a dividend yield, and the relationship between futures and spot prices includes the dividend yield.
Standard & poor's 16768282 fund-factors-2009 jan1bfmresearch
This document summarizes a study by Standard & Poor's on factors that predict investment fund performance. The study analyzed both qualitative factors like fund size, expenses, and age as well as quantitative metrics like Jensen's alpha and information ratio. The key findings were:
- For developed markets, larger funds with lower expenses tended to outperform. But for emerging markets, smaller funds did better due to differences in liquidity.
- Jensen's alpha and information ratio best predicted future performance of developed market equity funds over shorter time periods.
- Past performance was informative over 2 years but less so over 1 year due to noise. Fund selection should focus on factors predicting shorter term outperformance.
This document analyzes different categories of active mutual fund management based on measures of Active Share and tracking error. It finds that the most active stock pickers have outperformed their benchmarks after fees, while closet indexers and funds focusing on factor bets have underperformed after fees. Performance patterns were similar during the 2008-2009 financial crisis. Closet indexing has become more popular recently. Fund performance can be predicted by cross-sectional stock return dispersion, favoring active stock pickers when dispersion is higher.
Lodging REIT Analysis - Keynote Presentation for Research Committee by Brad K...Brad Kuskin
Although numerous studies examine REIT performance over extended periods of time, many online and data-driven investment tools do not adequately provide existing and prospective investors with the tools necessary to extract business management risk out of lodging REIT returns. Given investors' current reliance on technology and graphic-oriented return analysis, it is critical that lodging REIT shareholders understand that not all equity REITs are equal. Typically, investors govern by a combination of return on capital and diversification. However, lodging REITs are inherently misleading due to their "equity REIT" classification.
As lodging REITs expand to encompass a vast portion of the hospitality industry, particularly marquis lodging assets in primary metropolitan markets, an accurate comprehension of inherent risks is critical for any investor considering deploying capital into a lodging REIT.
This document summarizes a study examining 125 equity mutual funds that closed to new investment between 1993 and 2004. The study tests three hypotheses about why funds close: 1) The "good steward" hypothesis argues funds close to restrict inflows and maintain performance, and will perform well after reopening. 2) The "cheap talk" hypothesis posits closing has no real cost if fees increase and existing investors contribute, compensating managers. 3) The "family spillover" hypothesis claims closing diverts attention to other funds in the same family. The study finds little support for good steward performance, but evidence managers raise fees consistent with cheap talk, and little family benefit except briefly around closure.
This document summarizes a study that estimated the beta of Costco Wholesale Corporation stock using the Capital Asset Pricing Model. The authors collected quarterly stock price data for Costco and the S&P 500 index over a 10-year period. They performed a linear regression of Costco's returns against the market risk premium (S&P 500 returns - risk-free rate). The regression estimated Costco's beta at 0.642, meaning its returns tend to be about 64.2% as volatile as the overall market. However, the regression had a low R-squared value, indicating the model was not a great fit for the data. Therefore, while beta provides some insight into risk, other factors like
The document discusses various derivatives strategies. It defines a derivative as a security whose price is derived from underlying assets such as stocks, bonds, commodities, currencies, interest rates, and market indexes. The main types of derivatives discussed are forwards, futures, options, and swaps. Forwards and futures are contracts to buy or sell an asset at a future date. Options provide the right but not obligation to buy or sell an asset. Swaps involve exchanging cash flows over time, such as interest rate or currency swaps. The document also analyzes the P/E ratio, P/B ratio, and dividend yield of Nifty 50 companies over different time periods to predict market trends.
Dividend policy and share price volatility in kenyaAlexander Decker
This document summarizes a research study that examined the relationship between dividend policy and share price volatility on the Nairobi Stock Exchange from 1999-2008. The study used regression analysis to test the relationship between share price volatility (dependent variable) and two measures of dividend policy: dividend payout ratio and dividend yield (independent variables). The results showed that dividend payout ratio was negatively correlated with share price volatility, meaning higher payout ratios were associated with lower volatility. Dividend yield was positively correlated with volatility, suggesting higher yielding stocks experienced greater price fluctuations. Both relationships were statistically significant. Therefore, the study found that dividend policy influences share price volatility on the Nairobi Stock Exchange.
This document analyzes various hedging strategies using futures contracts. It discusses using Eurodollar futures to hedge $70 million invested in equities, calculating that 6,667 contracts would be needed. It also examines a long/short portfolio hedging a $50 million investment in PRWCX using S&P 500 futures, determining a historical beta of 0.628. Leveraging this strategy at 150% with $100 million borrowed at 1% could yield a 4.54% return. However, future beta and market movements may differ from historical patterns. Additionally, the document proposes a spread trade betting on a rise in long-term vs. short-term interest rates using Eurodollar futures.
This document summarizes a study that examines whether mutual fund managers can pick stocks by analyzing the performance of stocks that funds buy and sell around subsequent quarterly earnings announcements. The study finds:
1) On average, stocks that mutual funds buy outperform stocks they sell by about 10 basis points in the 3 days around the next earnings announcement.
2) This performance persists after benchmarking against stocks with similar characteristics, and funds that perform best tend to have a growth style.
3) Mutual fund trades forecast future earnings surprises, indicating managers can predict fundamentals.
4) Abnormal returns around earnings announcements account for 18-51% of total abnormal returns to stocks funds trade.
This document outlines a PhD research proposal examining the characteristics of Sovereign Wealth Fund investments within the framework of the Capital Asset Pricing Model. The proposal includes a literature review on previous research on SWFs, research objectives to examine relationships between risk and return of SWF investments using CAPM, a methodology section outlining data collection and analysis, a timeline with tasks and durations, anticipated outcomes including testing assumptions of CAPM, and potential difficulties of the research.
Global Value Equity Portfolio (March 2011)Trading Floor
This month we have adjusted our Global Value Equity Portfolio to include the reinvestment of gross dividends and introduced dynamic weights for the constituents. This reduces transaction costs, enhances excess return and makes the portfolio easier to replicate for investors.
This document summarizes a project that used text analysis of SEC filings to predict the relative risk of investing in publicly traded companies. The researchers analyzed sections 7 and 7A of companies' 10-K reports, which describe financial status and risks. They used logistic regression and neural networks to build models predicting investment risk based on textual patterns. Testing on new companies achieved around 90-95% accuracy. The researchers concluded text analysis of 10-K reports provides useful insights into future company performance and stock trends.
This document summarizes research on index effects that occur around index rebalancing dates. It discusses the growth of passive investing, hypotheses for why abnormal returns may occur on additions and deletions from indexes, and evaluates whether an index effect exists in the S&P/TSX Composite index in Canada. The methodology examines stock returns around rebalancing dates to identify any cumulative abnormal returns.
The document discusses using the information ratio to measure the performance of mutual funds relative to a benchmark. It defines the information ratio as the excess return of a portfolio over the benchmark return, divided by the tracking error. A higher information ratio means a fund's performance is more consistent relative to the benchmark. The document also notes limitations of the information ratio include needing substantial data and being sensitive to the chosen benchmark.
These documents summarize several academic studies on hedge fund performance and investor returns:
1) One study finds that annualized returns for hedge fund investors are 3-7% lower than buy-and-hold returns for the same funds, due to poor timing of capital flows. Risk-adjusted returns are close to zero.
2) Another examines how fund life cycles are affected by flows, size, competition and performance. It finds increasing competition in a category decreases fund survival probabilities.
3) A third study finds macroeconomic risk explains a significant portion of hedge fund return dispersion, but not for mutual funds. Higher macroeconomic risk is positively related to future hedge fund returns.
This document provides a summary of a student's summer training report on measuring the performance of mutual funds using statistical parameters. The report analyzes the performance of top mutual funds like HDFC, ICICI, UTI, Reliance, and Birla Sun Life over the past 3 years using tools like beta, standard deviation, R-squared, and coefficient of variation. Based on the analysis, Birla Sun Life Frontline Fund and Reliance Equity Fund showed the best performance. The report recommends Reliance and ICICI funds as the top performers and most recommended based on the primary and secondary data analysis. It suggests that UTI needs to strengthen its fund allocation and management to better compete against high performing funds like R
This is the fifth presentation for the University of New England Graduate School of Business course GSB711 Managerial Finance, offered by Dr Subba Reddy Yarram. This presentation examines risk, return and the Capital Asset Pricing Model (CAPM).
This document summarizes a research paper that examines how the time remaining until expiration affects the basis in stock market index futures contracts. The paper presents a model that relaxes the assumptions of constant interest rates and known dividend yields over the life of the contracts. Empirical analysis of the S&P 500 index and Major Market Index bases finds that time to maturity influences the conditional variance of the basis, consistent with prior research. Transaction costs and incomplete hedging may also help explain the impact of maturity.
The document summarizes three hypotheses about what investors consider when purchasing shares of common stock: dividends, earnings, or both dividends and earnings. It tests these hypotheses by analyzing stock price, dividend, and earnings data from four industries in 1951 and 1954. When testing a model that included both dividends and earnings as factors, the results were inconsistent and conceptually weak. A model based on the hypothesis that investors consider dividends performed better, with the dividend coefficient representing the required rate of profit and the retained earnings coefficient representing the value placed on growth. However, some of the retained earnings coefficients were unexpectedly low or negative. In conclusion, the dividend hypothesis better explained stock price variations but the results still indicated room for improvement in understanding the
Liquidity reactions towards dividend announcements and information efficiency...Evans Tee
This document summarizes a study that examines stock returns and information efficiency on the Ghana Stock Exchange in response to dividend announcements. It uses an event study methodology to analyze abnormal stock returns surrounding dividend announcements for 11 major companies listed on the exchange from 2014-2018. The study finds little informational content in the dividend announcements, as Ghanaian investors did not generally view announcements as favorable news. Stock returns did not conclusively react positively to subsequent dividend announcements. The document provides background on theories of dividends and liquidity, prior research on market responses to dividends, and the methodology used in the study.
Ignacio Velez-Pareja : From the Slide Rule to the Black BerryFuturum2
1. The document discusses using financial modeling as a tool for business valuation and value management, rather than just for transactions like selling or buying a company.
2. It proposes developing a comprehensive financial model with traditional statements plus a cash budget to estimate how decisions impact future cash flows and value. This allows management to proactively shape the future rather than just reacting to the past.
3. The model incorporates factors like inflation, growth, and policies to evaluate risks and test scenarios. It is based on double-entry accounting to help ensure accuracy and identify errors.
The document describes an investor creating an optimal stock portfolio using linear programming. The financial advisor collected stock data and formulated an optimization problem to minimize portfolio risk while achieving a 2% return. The optimal portfolio allocated 53% to Humana, 39% to Apple, and 8% to JP Morgan, with a variance of 0.003285607. Additional experiments imposed maximum weight limits and maximized return subject to a variance constraint.
The document analyzes the beta and risk characteristics of a portfolio of stocks compared to the S&P 500 market index from 1989 to present. It loads historical price data for the stocks and market, calculates logarithmic monthly returns, and estimates basic statistics. The analysis finds the stocks and market had average monthly returns between 0.16-1.36% with varying levels of volatility as measured by minimum, maximum and interquartile ranges of returns.
The document discusses the Capital Asset Pricing Model (CAPM) and its use in calculating the required rate of return for Greggs plc. It provides background on the development of the CAPM by Markowitz and Sharpe. The author then calculates the beta and required rate of return for Greggs using 5 years of stock price data and the CAPM formula. While the CAPM is widely used, the document also discusses criticisms of the model, such as its unrealistic assumptions and inability to explain all returns. Overall, the CAPM remains a commonly used model despite its limitations.
1) The document describes finding the minimum variance portfolio from 16 stocks selected across 4 industries. It calculates the annualized mean, variance, and covariance of the stock returns to obtain the covariance matrix.
2) Using the Markowitz model and Lagrange multipliers, it determines the minimum variance portfolio weights for two expected return levels. This produces two portfolios which are used to plot the efficient frontier curve.
3) The minimum variance point on the efficient frontier identifies the optimal portfolio, which is calculated to have an expected return of 0.05033 and variance of 0.008008 based on the two-fund theorem weights.
The document describes three problems related to constructing optimal self-financing portfolios consisting of stocks and options. Problem 1 involves a portfolio with one stock and one option, Problem 2 involves one stock and two options, and Problem 3 prices an up-and-out option using a finite difference method. For each problem, the document outlines the portfolio composition, parameters, and numerical approach taken to determine optimal quantities of options to minimize portfolio variance.
The document summarizes a stock portfolio optimization report that uses Gaussian quadrature to analyze stock market data and optimize a portfolio to minimize risk and maximize returns. It describes collecting stock market data, applying a Gaussian quadrature formula to analyze the data and calculate the probability of gains and expected returns. The results show probabilities of gains around 50% and expected returns between 0.081 to 0.132, indicating the difficulty of predicting stock market behaviors but some ability to modestly optimize returns and reduce risk.
This document is an investment analysis and portfolio management assignment submitted to Mr. Abrar Hussain by a group of five students. It analyzes daily stock price data from 2010-2014 of 30 Pakistani companies to construct minimum variance, maximum variance, and risky-riskless combination portfolios. It calculates returns, variances, standard deviations, betas, and various risk-adjusted performance metrics for the portfolios. The optimal minimum variance portfolio allocates weights to 20 stocks and has a return of 0.11%, variance of 0.48, and standard deviation of 0.69. An 85-15% risky-riskless portfolio combination achieves the highest return of 1.78% with variance of 0.0063 and standard
Resolving Multi Objective Stock Portfolio Optimization Problem Using Genetic ...Hok Lie
This document summarizes a research paper that proposes using a genetic algorithm to solve a multi-objective stock portfolio optimization problem. It aims to generate a portfolio with the highest expected return and lowest risk. The document first discusses modern portfolio theory and defines the optimization problem. It then describes using a genetic algorithm with real number encoding to evolve portfolio weight solutions. The algorithm is verified using historical stock data, where expected returns and risk are estimated and a fitness function is developed to maximize return and minimize risk. The results show the genetic algorithm converges to better solutions than random search.
Improving Returns from the Markowitz Model using GA- AnEmpirical Validation o...idescitation
Portfolio optimization is the task of allocating the investors capital among
different assets in such a way that the returns are maximized while at the same time, the
risk is minimized. The traditional model followed for portfolio optimization is the
Markowitz model [1], [2],[3]. Markowitz model, considering the ideal case of linear
constraints, can be solved using quadratic programming, however, in real-life scenario, the
presence of nonlinear constraints such as limits on the number of assets in the portfolio, the
constraints on budgetary allocation to each asset class, transaction costs and limits to the
maximum weightage that can be assigned to each asset in the portfolio etc., this problem
becomes increasingly computationally difficult to solve, ie NP-hard. Hence, soft computing
based approaches seem best suited for solving such a problem. An attempt has been made in
this study to use soft computing technique (specifically, Genetic Algorithms), to overcome
this issue. In this study, Genetic Algorithm (GA) has been used to optimize the parameters
of the Markowitz model such that overall portfolio returns are maximized with the standard
deviation of the returns being minimized at the same time. The proposed system is validated
by testing its ability to generate optimal stock portfolios with high returns and low standard
deviations with the assets drawn from the stocks traded on the Bombay Stock Exchange
(BSE). Results show that the proposed system is able to generate much better portfolios
when compared to the traditional Markowitz model.
This paper proposes using a "shrinkage" estimator as an alternative to the traditional sample covariance matrix for portfolio optimization. The shrinkage estimator combines the sample covariance matrix with a structured "shrinkage target" using a shrinkage constant to minimize distance from the true covariance matrix. The paper finds this shrinkage estimator significantly increases the realized information ratio of active portfolio managers compared to the sample covariance matrix. An empirical study on historical stock return data confirms the shrinkage method leads to higher ex post information ratios in portfolio optimization. However, the shrinkage target assumes identical pairwise correlations that may not fully reflect market characteristics.
This document is the final project for an Economics 424 course on Computational Finance and Financial Econometrics. It analyzes monthly closing price data and returns for 6 mutual funds from 2009-2014. Key findings include:
1) Stock index funds for the S&P 500, Europe, and emerging markets had higher volatility than bond funds. The S&P 500 fund achieved the highest return over 5 years.
2) Value-at-risk was highest for the emerging markets fund and lowest for the short-term bond fund.
3) Rolling estimates of mean and standard deviation showed country index funds had more stable parameters while bond funds' parameters moved together more.
This document provides an analysis of a portfolio for Mr. Thompsen consisting of five New Zealand stocks within his risk tolerance. It includes:
1) Analysis of the risk and return characteristics of each stock and justification for their selection. Contact Energy and Auckland International Airport are favored for their growth potential.
2) Calculation of a minimum variance portfolio with an expected return of 12.66% and standard deviation of 7.81%.
3) Determination of an optimal variance portfolio with the highest expected return of 19.61% that meets Mr. Thompsen's 15% risk tolerance.
4) Recommendation of allocating Mr. Thompsen's $10 million portfolio according to the
Is capm a good predictor of stock return in the nigerian banking stocksAlexander Decker
This document summarizes a research study that tested the predictive power of the Capital Asset Pricing Model (CAPM) for stock returns in the Nigerian banking sector from 2000-2011. The study found that CAPM correctly estimated stock returns for only one bank (5.5%) in 2007 and 2011, while it undervalued stocks 66.7-72.2% of the time and overvalued them 22.2-27.8% of the time in other years. Therefore, the study concluded that CAPM is not a good predictor of stock returns in the Nigerian banking sector.
The document is a scanned receipt from a grocery store purchase on June 15th, 2022 totaling $58.37. It lists items bought including ground beef, chicken breasts, tortillas, cheese, and produce such as tomatoes, lettuce, and onions. The receipt shows the item prices, taxes, and total amount due.
This document discusses portfolio optimization using the tracking model method. It defines various types of investment risk that investors and financial institutions face, such as interest rate risk, business risk, credit risk, inflation risk, and reinvestment risk. It then examines various risk measures used in portfolio optimization models, including variance, mean absolute deviation, value at risk (VaR), and conditional value at risk (CVaR). The results section finds that using the tracking model and provided data, the portfolio is only feasible for a risk lover investor, as it invests entirely in the single best performing asset.
This document describes a portfolio optimization project. It analyzes historical stock return data for Apple and Netflix to construct an efficient frontier. A risk-free rate is calculated from treasury bill returns. An optimal risky portfolio is determined by maximizing the Sharpe ratio. Based on a risk aversion index of 1, the appropriate weights in the optimal portfolio and risk-free asset are calculated to maximize utility. Graphs of the efficient frontier, capital allocation line, and indifference curve illustrate the optimal portfolio selection.
This document discusses estimating covariance matrices for portfolio selection. It introduces a shrinkage estimator that is an optimally weighted average of the sample covariance matrix and single-index covariance matrix. The empirical part compares these estimators to determine which produces the most efficient portfolio with smallest return variability. The sample covariance matrix has problems when the number of assets is large, as it has high variance and its inverse is a poor estimator. Shrinkage aims to improve upon the sample covariance matrix by combining it with a factor model-based estimator.
This document is a research project submitted by Nduati Michelle Wanjiku in partial fulfillment of the requirements for a Bachelor's degree in financial economics from Strathmore University in Nairobi, Kenya. The research project compares the relative performance of single-index models and multifactor models in determining the optimal portfolio allocation through the efficient frontier. It establishes that the single index model outperforms the multifactor model as it yields higher Sharpe ratios. This is attributed to the single index model containing characteristics of macroeconomic variables. The research uses historical factor betas between 2001 and 2012 to minimize risk and maximize returns in constructing the efficient frontier.
This document is a portfolio optimization project report submitted by Tingwen Zhou and Xuan Ning to Professor Marcel Y. Blais on December 15, 2016. It analyzes the performance of a portfolio reconstructed on November 7, 2016 using a 3-year period of asset data. The portfolio underperformed, losing a total of $86,025. Various metrics are calculated to evaluate the portfolio such as Sharpe ratio, Treynor ratio, and maximum drawdown. The efficient frontier is analyzed over time as weights were rebalanced weekly.
The document summarizes the capital asset pricing model (CAPM) and reviews early empirical tests of the model. It begins by outlining the logic and key assumptions of the CAPM, including that the market portfolio must be mean-variance efficient. However, empirical tests found problems with the CAPM's predictions about the relationship between expected returns and market betas. Specifically, cross-sectional regressions did not find intercepts equal to the risk-free rate or slopes equal to the expected market premium. To address measurement error, later tests examined portfolios rather than individual assets. In general, the early empirical evidence revealed shortcomings in the CAPM's ability to explain returns.
This document discusses factors that influence stock prices of industrial companies listed on the Indonesia Stock Exchange. It presents a literature review on debt ratio, price-earnings ratio, earnings per share, company size, and company value as independent variables that may predict stock price as the dependent variable. The document then describes the research methodology, which uses a quantitative multiple linear regression analysis of secondary data from 114 industrial companies to determine the relationship between the independent and dependent variables. The results of the analysis show that all four independent variables (debt ratio, price-earnings ratio, earnings per share, size) have a significant influence on stock price both simultaneously and partially, with earnings per share having the strongest influence. Conclusions are that companies should manage these
There are three main forms of market efficiency:
1) Weak form - Prices reflect all past price information. Technical analysis is not useful.
2) Semi-strong form - Prices reflect all public information. Fundamental analysis is not useful.
3) Strong form - Prices reflect all public and private information. No analysis is useful.
The Arbitrage Pricing Theory (APT) is a multi-factor model that does not rely on a market portfolio like the Capital Asset Pricing Model (CAPM). The APT allows for multiple factors that influence returns while the CAPM only considers systematic risk relative to the market.
Technical indicators like moving averages and oscillators
The document summarizes a study that examined whether stock prices fully value firms' investments in research and development (R&D). The study found that: 1) Firms with high R&D spending relative to their market value, which tend to have poor past returns, earned large excess returns in subsequent years, indicating prices do not fully incorporate the value of R&D investments. 2) There was a positive association between R&D intensity and stock return volatility. 3) Results for advertising expenditures were similar to those for R&D. In conclusion, stock prices may not fully value intangible assets like R&D investments, especially for firms with poor past performance.
Prepared by Students of University of Rajshahi
Shahin Islam
Aslam Hossain
Shahidul Islam
Amy Khatun
Sohanuzzaman Sohan
MD. Rehan
Bikash Kumar
Rahid Hasan
Ali Haider
Uttam Kumar
MD. Abdullah AL Mamun
Mamunur Rahman
presented by Mango squad
For downloading this contact- bikashkumar.bk100@gmail.com
Faj jan feb_2003_surprise_higher_dividends_higher_earnings_growthSarayut Wanasin
The document investigates whether a company or market's dividend payout ratio can predict future earnings growth. It finds that historically, the highest expected future earnings growth occurs when current payout ratios are high, and the slowest growth occurs when payout ratios are low. This relationship holds even after accounting for other factors like mean reversion in earnings. The findings contradict the view that reinvesting more earnings will fuel faster growth, and instead support the idea that managers sometimes signal expectations or engage in inefficient behavior through dividends. The low payout ratios seen recently may not be a sign of strong future earnings growth as some predict, according to the historical relationship identified in the document.
An Introduction to the Black Litterman ModelSimon Long
The document provides an introduction and explanation of the Black-Litterman model for portfolio optimization. It discusses some limitations of the modern portfolio theory approach, including reliance on historical data to estimate future returns. The Black-Litterman model incorporates investors' views to customize portfolios to their needs and beliefs. It involves determining the market's expected returns and covariances, then adjusting for investor opinions to calculate optimal asset weights that minimize portfolio variance.
The document discusses various methods for valuing companies and estimating required returns. It covers sum-of-the-parts valuation, conglomerate discounts, characteristics of good valuation models, different return concepts such as holding period return and required returns, methods to estimate required returns including CAPM and multifactor models, and discount rates. It also discusses Porter's five forces framework and factors that influence industry competition and profitability.
Parametric provides strategies for exploiting increased market volatility, including rebalancing portfolios and using options strategies. Rebalancing reduces concentration risks and volatility over time by selling assets that have increased in value and buying those that have decreased, capturing returns from volatility. Options strategies can also provide downside protection for portfolios while retaining upside potential. Parametric implemented an options overlay for a client in 2008 that protected against a 5-20% market decline while retaining upside to 30%, balancing protection and participation in gains.
This document summarizes a 1964 study by Irwin Friend and Marshall Puckett examining the relationship between stock prices, dividends, and retained earnings. The study finds that in growth industries, retained earnings have a relatively greater impact on stock prices than in non-growth industries. It also finds that the customary view that dividends have a stronger effect than retained earnings is invalid, as the results varied across industries and years. The study concludes there is little basis for believing dividends universally have a stronger impact than retained earnings, and that the appropriate payout ratio depends on firm-specific factors like profitability and risk.
Determinants of the implied equity risk premium in BrazilFGV Brazil
This document summarizes a research paper that proposes and tests determinants of the implied equity risk premium (ERP) in Brazil. The paper calculates the ERP using current stock prices rather than historical returns. It finds several market fundamentals are significantly related to changes in the ERP, including changes in interest rates, debt risk spreads, US market liquidity, and the S&P 500 index level. The paper also compares using implied ERP versus historical averages and finds implied ERP varies with market events while historical averages do not.
PE ratio is a metric that compares a company's stock price to its earnings per share. It indicates how much an investor pays for each dollar of earnings. A PE ratio is calculated by dividing the current stock price by the earnings per share. PE ratios help investors compare similar companies and determine if a stock is undervalued, appropriately priced, or overvalued. Factors like growth rates, profit margins, returns, macroeconomic conditions, and intangible assets can impact a company's PE ratio. Comparing a company's PE ratio to its industry peers provides useful insight into how the market values that company.
Does the capital assets pricing model (capm) predicts stock market returns in...Alexander Decker
This document examines whether the Capital Asset Pricing Model (CAPM) can predict stock returns in Ghana using data from selected stocks on the Ghana Stock Exchange from 2006-2010. The results found no statistically significant relationship between actual and predicted returns, indicating CAPM with constant beta cannot explain differences in returns. It was also found that some stocks were on average undervalued while one was overvalued over the period studied. The conclusion is that the standard CAPM model cannot statistically explain the observed differences in actual and estimated returns of the selected Ghanaian stocks.
Indian Stock Market Using Machine Learning(Volume1, oct 2017)sk joshi
This document summarizes a research paper that uses machine learning and financial ratios to classify stocks traded on the Indian stock market as either "outperformers" or "underperformers" based on their rate of return. The study uses quarterly data from 50 large market capitalization companies over one year. A support vector machine model achieved 80% accuracy in predicting stock performance on a sector-by-sector basis. While promising, the author acknowledges limitations and outlines areas for further improvement, such as incorporating more external factors like macroeconomic data.
This document provides an overview of capital market research, which examines the impact of financial accounting and disclosure decisions on share prices and returns. Capital market research analyzes statistical relationships between financial information and share price movements to assess how investors react in aggregate to new information. It relies on the assumption that markets are semi-strong form efficient and quickly reflect all public information in security prices. The research is useful for understanding how alternative accounting methods and disclosures influence investment decisions.
The five steps in financial planning, forecasting internalexternal .pdfamrahlifestyle
The five steps in financial planning, forecasting internal/external finds is critical. With today\'s
economic and interest rate market conditions, along with the volitility of the captial markets,
what factors would you emphasize when you are preparing your forecasts?
Solution
Connect with Vanguard > vanguard.com Executive summary. Some say the long-run outlook for
U.S. stocks is poor (even “dead”) given the backdrop of muted economic growth, already-high
profit margins, elevated government debt levels, and low interest rates. Others take a rosier view,
citing attractive valuations and a wide spread between stock earnings yields and Treasury bond
yields as reason to anticipate U.S. stock returns of 8%–10% annually, close to the historical
average, over the next decade. Given such disparate views, which factors should investors
consider when formulating expectations for stock returns? And today, what do those factors
suggest is a reasonable range to expect for stock returns going forward? We expand on previous
Vanguard research in using U.S. stock returns since 1926 to assess the predictive power of more
than a dozen metrics that investors would know ahead of time. We find that many commonly
cited signals have had very weak and erratic correlations with actual subsequent returns, even at
long investment horizons. These poor Vanguard research October 2012 Forecasting stock
returns: What signals matter, and what do they say now? Authors Joseph Davis, Ph.D. Roger
Aliaga-Díaz, Ph.D. Charles J. Thomas, CFA 2 predictors include trailing values for dividend
yields and economic growth, the difference between the stock market’s earnings yield and
Treasury bond yields (the so-called Fed Model), profit margins, and past stock returns. We
confirm that valuation metrics such as price/earnings ratios, or P/Es, have had an inverse or
mean-reverting relationship with future stock market returns, although it has only been
meaningful at long horizons and, even then, P/E ratios have “explained” only about 40% of the
time variation in net-of-inflation returns. Our results are similar whether or not trailing earnings
are smoothed or cyclically adjusted (as is done in Robert Shiller’s popular P/E10 ratio). The
current level of a blend of valuation metrics contributes to Vanguard’s generally positive outlook
for the stock market over the next ten years (2012–2022). But the fact that even P/Es—the
strongest of the indicators we examined—leave a large portion of returns unexplained
underscores our belief that expected stock returns are best stated in a probabilistic framework,
not as a “point forecast,” and should not be forecast over short horizons. The variation of
expected returns Forming reasonable long-run return expectations for stocks and other asset
classes can be important in devising a strategic asset allocation. But what precisely are
“reasonable” expectations in the current environment, and how should they be formed? For
instance, should investors expect t.
The document summarizes a study that uses the Capital Asset Pricing Model (CAPM) to analyze the risk and returns of 5 stocks from 2013-2015. It calculates daily returns, beta, alpha, and the correlation of individual stock returns with market returns. The results show most stocks had a slight negative excess return and negative Sharpe ratio, indicating average risk-adjusted performance. Betas were all statistically significant, with GE closest to the market. R-squared values ranged from 20-48%, explaining some but not all variation in returns. The analysis supports that CAPM provides useful but imperfect insights into the relationship between a stock's risk and return.
1. The document analyzes whether systematic rules-based strategies based on traditional and alternative risk factors can successfully replicate the performance of various hedge fund strategies.
2. Regression analysis shows the factors explain a substantial portion of hedge fund returns, though the explanatory power is higher in-sample than out-of-sample. More dynamic strategies are harder to replicate than directional ones.
3. Out-of-sample, a rolling-window approach to estimating time-varying factor exposures works as well or better than a Kalman filter model for most strategies. Replication quality varies by strategy, with more directional strategies like short selling replicating better than dynamic ones.
The document discusses challenges in estimating cost of capital in the current economic environment. It addresses issues with estimating the risk-free rate due to declines in Treasury bond yields, and issues with estimating the equity risk premium based on historical data, which may be too low. It also notes that betas calculated using recent historical data may be lower than expected future betas due to volatility in financial and highly leveraged stocks. The presentation recommends using a higher risk-free rate than current Treasury yields, a higher equity risk premium of 6% rather than estimates based on historical data, and adjusting betas based on the underlying risk of each company rather than purely historical estimates.
Factor models are used to analyze the risk of portfolios. The Fama-French three factor model uses three factors - excess market returns, firm size, and book-to-market value - to explain 95% of a portfolio's returns. It is an advancement on the Capital Asset Pricing Model. The Fama-French model incorporates factors that provide higher long-term returns and allows users to earn higher returns by tilting their portfolio toward small cap value stocks.
Columbia Business School - RBP MethodologyMarc Kirst
This paper describes a methodology called Required Business Performance (RBP) which uses current stock prices to imply expectations of future sales growth. Section 1 outlines the paper. Section 2 summarizes common approaches to estimating intrinsic firm value from dividends, free cash flows, book values or earnings. Section 3 explains how stock prices reflect both public and private information, and how expectations of key value drivers like future sales can be implied from current market prices.
1. FIN 608 CAPITAL MARKETS AND INVESTMENT STRATEGY GROUP YLC
FIN 608 PROJECT 1
Yue Ma, Ran Zhang, Qiao Chen
M.A. students in Applied Economics, heymy@umich.edu, zhran@umich.edu, chenqiao@umich.edu
Xiaoyu Dong
M.S. student in Industrial and Operations Engineering, xydong@umich.edu
In this project, our goal is to pick up 50 stocks for short and long respectively from 248 stocks for both
sections, which are sorted by annual growth theory. In this paper, we pick up four long filter candidates:
alpha, dividend yield, price to book vale and changes in amount of stock out standing, four short filter
candidates: market value, price to book ratio, capital investment and liquidity. We conduct factor analysis
and backup test for both part and come to components which can help investors to decide stocks building a
portfolio, in order to increase expected return. Our conclusion is consistent with previous research and also
the historical data test.
1. FILTER OF LONG CANDIDATES
The purpose of picking custom filters is to somehow enhance the market signal, which will lead
to a better stock return. In the long-position list, we would like to pick some factors which would
lead to an increasing stock return.
1.1. Alpha
Alpha is used to determine by how much the realized return of the portfolio varies from the required
return, as determined by CAPM. the formula for alpha is presented as follows:
↵ = Rp (Rf + (Rm Rf ))
We measure alpha by ”Alpha Relative to Local Index” in ”FactSet Global - FG MKT VALUE”
in FactSet database.
In Christopherson, Ferson, and Turner (1999), they figured that companies with higher alpha
outperform those with lower alpha. A bigger alpha might lead to bigger future stock return. There-
fore, we factor alpha in our following analysis.
1
2. Ma, Zhang, Chen, and Dong: FIN 608 PROJECT 1 with 9 pages in total
2 GROUP YLC
Proposition 1. Alpha is positively related to the future stock return.
1.2. Dividend Yeild
Dividend Yield is a financial ratio that indicates how much a company pays out in dividends each
year relative to its share price. Dividend yield is represented as a percentage and can be calculated
by the following formula.
We measure dividend by ”Dividend Yeild - Current” in ”Price - 1984 - Global - Daily -
P ALPHA PR” in FactSet database.
In Ang and Bekaert (2007), they examine the predictive power of the dividend yields for fore-
casting excess returns. And they found that dividend yields predict excess returns only at short
horizons together with the short rate and do not have any long-horizon predictive power. At short
horizons, the short rate strongly negatively predicts returns. Since our investment period is only
one year, therefore, we could factor dividend yields in.
Proposition 2. Dividend Yield is positively related to the future stock return.
1.3. Price To Book Ratio
Price To Book Ratio compares a stock’s per-share price (market value) to its book value (share-
holders’ equity).
We measure price to book ratio by ”Price to Book Value” in ”FactSet Fundamentals Consolidated
- Global - FF PBK” in FactSet database.
PB ratio is an appropriate index for measurement of book to market ratio.
So we decide to include PB Ratio on our filters. Then we expect to have a higher return on the
group of Small PB Ratio compared to High PB Ratio. Lower PB ratio reflects the firms undertake
a plunge from price. So the price is underestimated compared to High PB Ratio. Then we could
expect a return from recession. Below are brief industry cases why low PB could be more attractive.
Formula for PB PB = PE ⇤ ROE
Low PB: High ROE and Low PE happens on bank industry often. When experiencing a bear
market, public are not only afraid of increasing number of bad debt and also the rigid regulation
3. Ma, Zhang, Chen, and Dong: FIN 608 PROJECT 1 with 9 pages in total
GROUP YLC 3
requirement. However, when the market turns out to recover from recession, high ROE would lead
to a rebound.
Low ROE and Low PE happens on the firms on steel, public service, highway industry where
the e ciency of capital is low and marginal profit is compressed by competition and regulation.
Whereas, the firm would be relatively stable due to sustaining cash flow to defend market recession.
Low ROE and High PE happens when market looks good on firms future and expect it would
reverse probably upon current price.
Proposition 3. Price to book ratio is negatively related to future stock return.
1.4. Changes in Amount of Stock Outstanding
We measure Changes in Amount of Stock Outstanding by ”P COM SHS OUT(11/13/2015) -
P COM SHS OUT(11/13/2014)” in FactSet database.
Change in amount of stock outstanding relates to two major actions that a firm conduct, the
equity issuance and repurchase. Equity issuance is a way to finance a company or its new project
by sales of ownership interest. Equity repurchase, otherwise, is a way to reduce the outstanding
stocks, which usually is viewed as another kind of dividend. Both of them can have an e↵ect on
the earnings per share.
New equity issuance usually comes with a fall on stock price because investors all focus on the
net earnings and more stock outstanding means that earnings of the company would spread among
a greater number of stocks. However, stock repurchase is viewed by analyst as that the managers
think the companys stock is undervalued among the market, and thus investors in the market
might think highly of the stock they own now which lead to a price increase on the current stock
market.
Proposition 4. Amount of stock outstanding has negative relationship with future stock return.
2. PRINCIPLE ANALYSIS OF LONG FILTER, CHOSEN STOCKS,
AND BACK TEST
We run the principle analysis for the long filter. We take minus value to the indicators ”Price To
Book Ratio” and ”Changes in Amount of Stock Outstanding” because thay have negative relation
4. Ma, Zhang, Chen, and Dong: FIN 608 PROJECT 1 with 9 pages in total
4 GROUP YLC
Figure 1 Total Variance Explained in Principle Component Analysis for Long Filter
Note. Extraction Method: Principal Component Analysis. a. When components are correlated, sums of squared
loadings cannot be added to obtain a total variance.
with stock return. The results show that the four indicators can be integrated into two principle
components. The total variance explained by the two components are shown in Figure 2
In order to sort the short candidtes and select 50 from them, we calculate the scores of the first
principle component which explains 27.943% of the total variance, and sort all the long candidates
according the score. Since we take minus value to the indicators ”Price To Book Ratio” and
”Changes in Amount of Stock Outstanding”, the four indicators have positive relation with the
stock return. Therefore, the first principle component should also have positive relation with the
stock returns. Therefore, we choose the 50 candiates with the highest scores as our long porfolio.
The chosen short stocks are presented in the sheet ”Chosen Long Stocks”. The back test suggest
that the return of those stocks in the recent quarter (8/11/2015 to 11/11/2015) is 3.8% (see the
sheet ”Long Chosen Stock Back Test”), whereas the the average return of all long candidates is
5.9%. The first component scores for all the short candidates are presented in the sheet ”Long
Filter Scores for All”.
3. FILTER OF SHORT CANDIDATES
3.1. Market Value
Market value is the price an asset would fetch in the marketplace.
5. Ma, Zhang, Chen, and Dong: FIN 608 PROJECT 1 with 9 pages in total
GROUP YLC 5
We measure market value by ”Market Value (Current Only)” in ”FactSet Global -
FG MKT VALUE” in FactSet database.
A companys market value is a good indication of investors perceptions of its business prospects.
Market value can fluctuate a great deal over periods of time, and is substantially influenced by
the business cycle. Market value is also dependent on numerous other factors, such as the sector
in which the company operates, its profitability, debt load and the broad market environment.
Market value for a firm may diverge significantly from book value or shareholders equity.
So we decide to include Market Value on our filters. Then we expect to have a higher return on
the group of Small Market Value compared to Big Market Value.
There is kind of risk premium between two groups. The Big Market Value firms are less vulnerable
under turmoil of financial market and are easier to get support from government in terms of loan
and recapitalization. On the other side, Small Market Value firms have more risk open to the
markets, the volatility term as from CAPM model is higher, so we expect higher return.
Proposition 5. Market value is negatively related to future stock return.
3.2. Price To Book Ratio
Price To Book Ratio compares a stock’s per-share price (market value) to its book value (share-
holders’ equity).
We measure price to book ratio by ”Price to Book Value” in ”FactSet Fundamentals Consolidated
- Global - FF PBK” in FactSet database.
As we stated before in the long filter, we make the following prediction.
Proposition 6. Price to book ratio is negatively related to future stock return.
3.3. Capital Investment
Capital investment generally refers to the money invested by the firm to further business objectives.
We measure capital investment by ”Invested Capital - Total” in ”FactSet Fundamentals Consol-
idated - Global - FF INVEST CAP” in FactSet database.
6. Ma, Zhang, Chen, and Dong: FIN 608 PROJECT 1 with 9 pages in total
6 GROUP YLC
We predict that capital investment is negatively related to future stock return for the following
several reasons.
Firstly, capital investment and future stock return have contrary convariation with interest rate
(Lamont 2000). On one hand according to basic economic theory, when the interest rate decreases,
the capital cost will decrease, and therefore the investment will increase because more projects will
pass the net present value threshold. On the other hand, when the interest decreases, the discount
rate falls, the discounted sum of future cash flows rises, and therefore, the stock price will rise.
Secondly, stock price deviations from fundamental value may have a direct e↵ect on the invest-
ment policy of a firm. According to Polk and Sapienza (2009), the investment decision K by
the manager satisfies the equation V 0
(K) = c
where c is a constant and is positively related to
measures the extent to which the firm is misprice, and the optimal investment decision satisfies
V 0
(K⇤
) = c. On one hand, when the firm is overpriced, the manager will invest more than the
optimal investment value. If managers expect the current overvaluation to last, then managers
will take advantage of the mispricing and increase investment. On the other hand, if the firm is
underpriced, then the manager will invest less than the optimal investment value.
Proposition 7. Capital investment is negatively related to future stock return.
3.4. Liquidity
Liquidity is the extent to which the stock is easy to transact.
We measure liquidity by ”Look at average volume, and taks the maximum. use to help analyze
liquidity” in ”LIQUIDITY” in FactSet database.
We predict that liquidity is negatively related to future stock return for the following several
reasons.
Firstly, liquidity is related to risk (Baele, Bekaert, and Inghelbrecht 2010). If a stock is not very
liquid, then when an investor buys that stock, he will not be very easy to sell that stock. When the
investor finally finds an opportunity to sell that stock, the stock price may already fell. Therefore,
in order to conpensate for the the risk, the future expected return should be high for stocks with
7. Ma, Zhang, Chen, and Dong: FIN 608 PROJECT 1 with 9 pages in total
GROUP YLC 7
Figure 2 Total Variance Explained in Principle Component Analysis for Short Filter
Note. Extraction Method: Principal Component Analysis. a. When components are correlated, sums of squared
loadings cannot be added to obtain a total variance.
low liquidity. In CAPM world, liquidity should be neagatively related to beta. Therefore, on one
hand, stocks with low liquidity should have high beta and therefore should have high expected
future return. On the other hand, stocks with high liquidity should have low beta and therefore
should have low expected future return.
Secondly, liquidity is related to transaction cost citepam. When an investor holds a stock with
low liquidity will incur higher transaction cost than an investor holding a stock with high liquidity
to sell the stock, and therfore this invest should require higher return than an investor holding a
stock with high liquidity.
Proposition 8. Liquidity is negatively related to future stock return.
4. PRINCIPLE ANALYSIS OF SHORT FILTER, CHOSEN
STOCKS, AND BACK TEST
We run the principle analysis for the short filter. The results show that the four indicators can be
integrated into two principle components. The total variance explained by the two components are
shown in Figure 2
In order to sort the short candidtes and select 50 from them, we calculate the scores of the first
principle component which explains 62.810% of the total variance, and sort all the short candidates
8. Ma, Zhang, Chen, and Dong: FIN 608 PROJECT 1 with 9 pages in total
8 GROUP YLC
according the score. Since our analysis suggest that the four indicators have negative relation with
the stock return, the first principle component should also have negative relation with the stock
returns. Therefore, we choose the 50 candiates with the highest scores as our short porfolio.
The chosen short stocks are presented in the sheet ”Chosen Short Stocks”. The back test suggest
that the return of those stocks in the recent quarter (8/11/2015 to 11/11/2015) is 17.3%, suggest-
ing that if we short this portfolio, our return should be 17.3% (see the sheet ”Short Chosen Stock
Back Test”), where as the everage return of all short candiates through this period is 13.1%. The
first component scores for all the short candidates are presented in the sheet ”Short Filter Scores
for All”.
5. BACK TEST FOR WHOLE PORTFOLIO
The return rate of our 130/30 portfolio with initial endowment of $500K should be
1.3 ⇤ ( 3.8%) 0.3 ⇤ ( 17.3%) = 0.0025
The money return of our 130/30 portfolio with initial endowment of $500K should be
0.0025 ⇤ 500000 = 1250
The return rate of the 130/30 portfolio without filtering with initial endowment of $500K should
be
1.3 ⇤ ( 5.9%) 0.3 ⇤ ( 13.1%) = 0.0374 < 0.0025
Therefore, our filtering strategy is more successful than the total asset growth anomaly in the
recent quarter.
References
Amihud Y, Mendelson H (1986) Liquidity and stock returns.. Financial Analysts Journal, 42(3) 43–48.
Ang A, Bekaert G.(2007) Stock return predictability: Is it there?Review of Financial studies, 20(3) 651–707.
Baele L, Bekaert G, Inghelbrecht K (2010) The Determinants of Stock and Bond Return Comovements. The
Review of Financial Studies, 23(6) 2374–2428.
Polk C, Sapienza P (2009) The stock market and corporate investment: A test of catering theory. Review of
Financial Studies 22(1) 187–217.
9. Ma, Zhang, Chen, and Dong: FIN 608 PROJECT 1 with 9 pages in total
GROUP YLC 9
Christopherson J A, Ferson W E, Turner A L. (1999) . The Journal of Portfolio Management 26(1) 59–72.
Fama E F, French K R. (1993) Common risk factors in the returns on stocks and bonds Journal of Finance,
33(3) 3–56.
Joseph Davis, Roger Aliaga-Diaz, Charles J. Thomas(2012) Forcasting stock returns:what signals matter,
and what do they say now? Vanguard Website, https://personal.vanguard.com/pdf/s338.pdf
Lamont OA (2000) Investment plans and stock returns. The Journal of Finance 55(6) 2719–2745.
Tumarkin R, Whitelaw R F.(2001) News or noise? Internet postings and stock prices Financial Analysts
Journal, 57(3) 41–51.