1. The document analyzes whether systematic rules-based strategies based on traditional and alternative risk factors can successfully replicate the performance of various hedge fund strategies.
2. Regression analysis shows the factors explain a substantial portion of hedge fund returns, though the explanatory power is higher in-sample than out-of-sample. More dynamic strategies are harder to replicate than directional ones.
3. Out-of-sample, a rolling-window approach to estimating time-varying factor exposures works as well or better than a Kalman filter model for most strategies. Replication quality varies by strategy, with more directional strategies like short selling replicating better than dynamic ones.
![INVESTMENT&PENSIONS EUROPE SPRING 2016
dedicated equity benchmark with respect to
the S&P 500 index, leads to an improvement in
performance reaching 180 basis points annu-
alised over the 1975–2014 sample period. This
improvement can be decomposed into a con-
tribution purely emanating from the increase
in equity allocation assuming no impact on
performance (57 basis points) and a contribu-
tion purely emanating from the improved
performance of the equity benchmark assuming
no increase in allocation (123 basis points).
In terms of historical trajectories, we plot the
evolution of the funding ratio over the sample
period in figure 3, assuming an initial funding
ratio normalised at 100%.
In the left plot of figure 3, where the equity
allocation is set to 40%, we note that the LDI
strategy based on the improved liability-friendly
portfolio strongly outperforms the LDI strategy
based on the S&P 500 over the sample period.
In the right plot of figure 3, we observe that the
outperformance is even more spectacular when
the allocation to the improved equity bench-
mark is adjusted to generate the same volatility
of the funding ratio as when investing 40% in the
S&P 500 index.
Conclusions
We argue that LDI solutions can be enhanced
by the design of performance-seeking equity
benchmarks with improved liability-hedging
properties. We show that liability-driven
investors’ welfare is not only increasing in
terms of the Sharpe ratio of the performance-
seeking portfolio and in the correlation of the
liability-hedging portfolio with the liabilities, as
suggested by the fund separation theorem, but
1980 1990 2000 2010
0.5
1.0
1.5
2.0
2.5
3.0
1980 1990 2000 2010
0.5
1.0
1.5
2.0
2.5
3.0
3.5
4.0
40% S&P 500 CRSP
40% MV-C
40% S&P 500 CRSP
54% MV-C
3. Historical trajectories for the funding ratio
16| EDHECResearch Insights
it is also increasing in terms of the correlation
between the performance-seeking portfolio and
the liabilities.
The practical implication of this fund inter-
action theorem is that investors, such as pension
funds, will by and large benefit from improving
hedging characteristics of their performance-
seeking portfolio, unless this improvement is
associated with an exceedingly large opportunity
cost in terms of risk-adjusted performance.
We report evidence of the presence of a
large amount of cross-sectional dispersion in
liability-hedging characteristics of individual
stocks within the S&P 500 universe. In par-
ticular, we find that high-dividend-yield stocks
and low volatility stocks are more bond-like
than average, and therefore exhibit enhanced
liability-hedging benefits. As a result, inves-
tors with liability constraints will strongly
benefit from switching their equity portfolio
from a cap-weighted benchmark to a dedicated
liability-friendly portfolio based on the selection
of stocks which combine low volatility and high
dividend yields and a constrained minimum-
variance optimisation.
Within the S&P 500 universe, LDI strate-
gies switching to such a liability-friendly equity
benchmark starting from a 40% allocation to the
S&P 500 index would benefit from an excess
return of close to +1.8% per annum over the
1975–2014 period, without a corresponding
increase in funding ratio volatility.
T
here is a growing interest among sophis-
ticated asset managers and asset owners
in factor investing, a disciplined approach
to portfolio management that is broadly meant
to allow investors to harvest risk premia across
and within asset classes through liquid and
cost-efficient systematic strategies, without
having to invest with active managers (see Ang
[2014] for a comprehensive overview). While
it is now well accepted that the performance
of active mutual fund managers can, to a large
extent, be replicated through a static exposure
to traditional factors (see in particular the Ang,
Goetzmann and Schaefer [2009] analysis of the
Norwegian Government Pension Fund Global),
therefore implying that traditional risk premia
can be most efficiently harvested in a passive
manner, an outstanding question remains with
Alternative risk premia harvesting:
From hedge fund replication to
hedge fund substitution
Lionel Martellini, Professor of Finance, EDHEC Business School, Director, EDHEC-Risk
Institute, Senior Scientific Advisor, ERI Scientific Beta; Jean-Michel Maeso, Quantitative
Research Engineer, EDHEC-Risk Institute
respect to what is the best possible approach
for harvesting alternative risk premia such as
the currency carry factor or the commodity
momentum factor, for example.
In a recent research project supported by
Lyxor Asset Management, we attempted to
analyse (i) whether systematic rules-based
strategies based on investable versions of
traditional and alternative factors allow for
satisfactory in-sample and also out-of-sample
replication of hedge fund performance, and
more generally (ii) whether suitably-designed
risk allocation strategies may provide a cost-
efficient way for investors to obtain attractive
exposure to alternative factors, regardless of
whether or not they can be regarded as prox-
ies for any particular hedge fund strategy.
Hedge fund replication with
traditional and alternative factors
Benchmarking hedge fund performance is
particularly challenging because of the pres-
ence of numerous biases in hedge fund return
databases, the most important of which are
sample selection bias, survivorship bias and
“An outstanding question remains with
respect to what is the best possible
approach for harvesting alternative risk
premia such as the currency carry factor
or the commodity momentum factor”](https://image.slidesharecdn.com/408a86a4-fcd0-432c-b5e6-0bfdfe528c78-160215130501/85/IPE-Article-1-320.jpg)
![2016 SPRING INVESTMENT&PENSIONS EUROPE
EDHECResearch Insights |17
backfill bias. In what follows, we use EDHEC
Alternative Indices, which aggregate monthly
returns on competing hedge fund indices so
as to improve the hedge fund indices’ lack of
representativeness and to mitigate the bias
inherent to each database (see Amenc and
Martellini [2002]). We consider the following
13 categories: convertible arbitrage, CTA global,
distressed securities, emerging markets, equity
market neutral, event driven, fixed income arbi-
trage, global macro, long/short equity, merger
arbitrage, relative value, short selling and fund
of funds.
The first step consists in defining a set of
relevant risk factors and then finding suitable
proxies. An overview of the 19 traditional
and alternative risk factors considered in
our empirical analysis is given in figure 1.
We proxy traditional risk factors by total
returns of liquid and investable equity,
bond, commodity and currency indices. For
alternative risk factors, we inter alia consider
long/short proxies for the two most popu-
lar factors, namely value and momentum,
for various asset classes, using data from
Asness, Moskowitz and Pedersen (2013). A
key difference between the traditional and
alternative factors is that the latter cannot be
regarded as directly investable, which implies
that reported performance levels are likely to
be overstated. Given the presence of per-
formance biases in both hedge fund returns
and alternative factor returns, we shall not
focus on differences in average performance
between hedge fund indices and their replicat-
ing portfolios, and instead focus on the quality
of replication measured by in-sample and
out-of-sample (adjusted) R-squared.
As a first step, we perform an in-sample
linear regression for each hedge fund strategy’s
monthly returns against a set of K factors over
1. List of risk factors
Risk factors Proxies Source CA CTA DS EM EMN ED FIA GM LSE MA RV SS FoF
Traditional factors
Equity S&P 500 TR Bloomberg X X X X X X X X X X X
Bond Barclays US Treasury Bond index Datastream X X X X X X X X
Credit Barclays US Corporate Inv Grade index Datastream X X X X X X X
Currency US dollar index Bloomberg X
Commodity S&P GSCI TR Bloomberg X
Emerging market MSCI EM TR MSCI website X X X X X X
Alternative factors
Multi-class value Multi-Class Global VAL AQR website X X X X X
Multi-class momentum Multi-Class Global MOM AQR website X X X X X
Equity defensive Eq Global BAB AQR website X X X X X
Equity size Eq Global SMB AQR website X X X X X
Equity quality Eq Global QMJ AQR website X X X X X
Equity value Eq Global VAL AQR website X X X X X
Equity momentum Eq Global MOM AQR website X X X X X X
FI momentum FI Global MOM AQR website X X
FI value FI Global VAL AQR website X
FX momentum FX Global MOM AQR website X
FX value FX Global VAL AQR website
Commodity momentum COM Global MOM AQR website X
Commodity value COM Global VAL AQR website
This table summarises, in the first three columns, the whole set of traditional and alternative risk factors considered in our empirical analysis, their proxies and their sources. The other columns indicate the bespoke economic subset of factors
used for each strategy in our empirical analysis. CA = convertible arbitrage, CTA = CTA global, DS = distressed securities, EM = emerging markets, EMN = equity market neutral, ED = event driven, FIA = fixed income arbitrage, GM = global macro,
LSE = long/short equity, MA = merger arbitrage, RV = relative value, SS = short selling, FoF = fund of funds
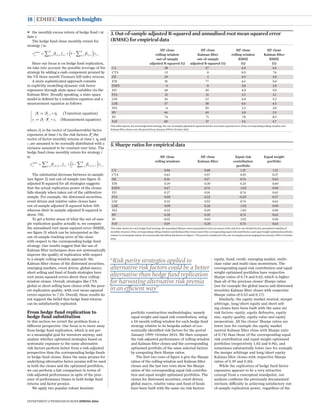
2. In-sample adjusted R-squared for empirical data
CA CTA DS EM EMN ED FIA GM LSE MA RV SS FoF
Case 1: 19 factors 56 31 71 85 32 77 50 58 81 39 70 81 77
Case 2: Traditional factors (except emerging market) 49 12 42 52 -2 55 35 25 64 22 55 60 46
Case 3: Economic factors (see figure 1) 54 28 52 80 16 63 28 50 71 31 56 73 68
This table reports, for each hedge fund strategy, the linear regression adjusted R-squared of its monthly returns against different sets of factors (three cases) over the whole sample period ranging from January 1997 to October 2015.
are harder to replicate than more static and
more directional strategies such as long/short
equity or short selling, for which we obtain an
adjusted R-squared of 81%.
This figure reports, for each hedge fund strat-
egy, the linear regression adjusted R-squared of
its monthly returns against different sets of fac-
tors (three cases) over the whole sample period
from January 1997 to October 2015.
The results we obtain also show the improve-
ment in the explanatory power when an
economically-motivated subset of factors that
includes alternative factors is considered (case
3) compared to a situation where the same
subset of traditional factors is used for all strate-
gies (case 2). For example, adjusted R-squared
increases from 25% to 50% for the global macro
strategy and from 52% to 80% for the emerging
market strategy.
In a second step, we perform an out-of-
sample hedge fund return replication exercise
using the bespoke subset of factors for each
strategy (case 3). The objective of this analysis is
to assess whether one can capture the dynamic
allocation of hedge fund strategies by explicitly
allowing the betas to vary over time in a statisti-
cal model.
The out-of-sample window considered is
January 1999–October 2015, which allows us to
build a ‘24-month rolling-window’ linear clone
for each strategy. For each hedge fund strategy
i we have:
r f et i i k tk
K
k t i t, , , ,= +=∑ β ,1
Here rt,i
is the monthly return of the hedge
fund strategy i at date t, i,k,t
the estimated OLS
exposure of the monthly return on hedge fund
strategy i to factor k on the rolling period [t–24
months; t–1], fk,t
the monthly return at date t on
factor k and ei,t
the estimated specific risk in
the whole sample period from January 1997 to
October 2015. For each hedge fund strategy i we
have:
r f et i i kk
K
k t i t, , ,= +=∑ β ,1
with rt,i
being the monthly return of the hedge
fund strategy at date t, i,k
the estimated OLS
exposure of the monthly return on hedge fund
strategy i to factor k, fk,t
the monthly return at
date t on factor k and ei,t
the estimated specific
risk in the monthly return of hedge fund index
i at date t.
We estimate the explanatory power meas-
ured in terms of the regression adjusted
R-squared on the sample period in three distinct
cases.
Case 1: Regression on an exhaustive set of fac-
tors (kitchen sink regression)– ie, the 19-factor
set listed in figure 1.
Case 2: Regression on a subset of traditional
factors only (five factors: equity, bond, credit,
commodity and currency).
Case 3: Regression on a bespoke subset of a
maximum of eight economically-motivated tra-
ditional and alternative factors for each hedge
fund strategy (see figure 1 for the selection of
factors for each hedge fund strategy).
The obtained adjusted R-squared values,
reported in figure 2, suggest that we can
explain a substantial fraction of hedge fund
strategy return variability with traditional and
alternative factors, validating that a substan-
tial part of hedge fund performance can be
explained ex-post through their systematic risk
exposures. The kitchen sink regression (case 1)
confirms that more dynamic and/or less direc-
tional strategies such as CTA global, equity
market neutral, fixed income arbitrage and
merger arbitrage strategies, with respective
adjusted R-squared of 31%, 32%, 50% and 39%,](https://image.slidesharecdn.com/408a86a4-fcd0-432c-b5e6-0bfdfe528c78-160215130501/85/IPE-Article-2-320.jpg)
![2016 SPRING INVESTMENT&PENSIONS EUROPE
EDHECResearch Insights |19
New challenges in retirement
investing
Over the last 15 years or so, the pension fund
industry has experienced a series of profound
structural changes. The shift in most account-
ing standards towards the valuation of pension
liabilities at market rates, instead of fixed
discount rates, has resulted in increased volatil-
ity for pension liability portfolios (see Fabozzi
et al [2014] for a discussion of pension liability
discounting rules). This new constraint has
been reinforced in parallel by stricter solvency
requirements that followed the 2000–03 pen-
sion fund crisis, while ever stricter solvency
requirements are also increasingly being
imposed on insurance companies in the US,
Europe and Asia. This evolution in accounting
and prudential regulations has subsequently led
a large number of corporations to close their
defined benefit pension schemes so as to reduce
the impact of pension liability risk on their
balance sheet and income statement. Overall,
a massive shift from defined benefit to defined
contribution pension schemes is taking place
across the world.1
Consequently, individuals are
becoming increasingly responsible for making
investment decisions related to their retirement
financing needs, investment decisions that they
are not equipped to deal with given the low
levels of financial literacy within the general
population and the reported inability of financial
education to significantly improve upon the
current situation.
In such a fast-changing environment and an
increasingly challenging context, the need for
the investment industry to evolve beyond stand-
ard product-based market-centred approaches
set of factors and the methodologies used. Our
results also suggest that risk parity strategies
applied to alternative risk factors could be a
better alternative than hedge fund replication
for harvesting alternative risk premia in an
efficient way. In the end, the relevant question
may not be “is it feasible to design accurate
hedge fund clones with similar returns and
lower fees?”, for which the answer appears to
be a clear negative, but instead “can suitably
designed mechanical trading strategies in a
number of investable factors provide a cost-
New frontiers in
retirement solutions
Lionel Martellini, Professor of Finance, EDHEC Business
School, Director, EDHEC-Risk Institute, Senior Scientific
Advisor, ERI Scientific Beta
and to start providing both institutions and indi-
viduals with meaningful retirement investment
solutions has become more obvious than ever.
From mass customisation to mass
production in individual money
management
Currently available investment options hardly
provide a satisfying answer to the retirement
investment challenge, and most individuals are
left with an unsatisfying choice between, on the
one hand, safe annuity or variable annuity prod-
ucts with very limited upside potential, which
will not allow them to generate the kind of
target replacement income they need in retire-
ment and, on the other hand, risky strategies
such as target date funds offering no security
with respect to minimum levels of replacement
income (see for example Bodie et al [2010] for
an analysis of the risks involved in target-date
fund investments in a retirement context).
This stands in contrast with a well-designed
retirement solutions that would allow individual
investors to secure the kind of replacement
income in retirement needed to meet their
essential consumption goals, while generating
a relatively high probability for them to achieve
their aspirational consumption goals, with pos-
sible additional goals including healthcare, old
age care and/or bequest goals.
Some dramatic changes with respect to
existing investment practices are needed to
facilitate the development of such meaningful
retirement solutions. Just as in institutional
money management, the need to design an
asset allocation solution that is a function of
the kinds of particular risks to which the inves-
tor is exposed, or needs to be exposed to meet
liabilities or fulfil goals, as opposed to purely
focusing on the risks impacting the market as
a whole, makes standard approaches (which
are based on balanced portfolios invested in a
mixture of asset class portfolios actively and
passively managed against market benchmarks)
mostly inadequate.
This recognition is leading to a new invest-
ment paradigm, which has been labelled
goal-based investing (GBI) in individual money
management (see Chhaabra [2005]), where
investors’ problems can be fully characterised in
terms of their meaningful lifetime goals, just as
liability-driven investing (LDI) has become the
relevant paradigm in institutional money man-
agement, where investors’ problems are broadly
summarised in terms of their liabilities.
In a nutshell, GBI includes two distinct
elements (see Deguest et al [2015] for a detailed
analysis). On the one hand, it involves the
disaggregation of investor preferences into a
hierarchical list of goals, with a key distinction
between essential and aspirational goals, and
the mapping of these groups according to hedg-
ing portfolios that possess corresponding risk
characteristics. On the other hand it involves
efficient dynamic allocation to these dedicated
hedging portfolios and a common performance-
seeking portfolio. In this sense, the GBI
approach is formally consistent with the fund
separation theorems that serve as founding pil-
lars for dynamic asset pricing theory, just as was
the case for the LDI approach (see also Shefrin
and Statman [2000] and Das, Markowitz, She-
frin and Statman [2010] for an analysis of the
relationship between modern portfolio theory
portfolio optimisation with mental accounts in a
static setting).
The framework should not only be thought of
as a financial engineering device for generating
meaningful investment solutions with respect
to investors’ needs. It should also, and perhaps
even more importantly, encompass a process
dedicated to facilitating a meaningful dialogue
with the investor. In this context, the reporting
dimension of the framework should focus on
updated probabilities of achieving investors’
meaningful goals and associated expected short-
falls, as opposed to solely focusing on standard
risk and return indicators, which are mostly
irrelevant in this context.
The true start of the industrial
revolution in investment
management
Mass production (in terms of products) hap-
pened a long time ago in investment manage-
ment through the introduction of mutual funds
and, more recently, exchange-traded funds.
What will trigger the true start of the industrial
revolution is instead mass customisation (as in
customised solutions), which by definition is a
manufacturing and distribution technique that
combines the flexibility and personalisation of
‘custom-made’ solutions with the low unit costs
associated with mass production. The true chal-
lenge is indeed to find a way to provide a large
number of individual investors with meaningful
dedicated investment solutions.
Within modern portfolio theory, mass
customisation is trivialised: if investors’ prob-
lems can be fully characterised by a simple
1 As an example of this evolution, the number of Fortune 500 companies
offering traditional DB plans to new hires fell from 51% in 1998 to 7% in
2013 (Retirement in Transition for the Fortune 500: 1998 to 2013, Insider
Report, September 2014, Towers Watson, available at https://www.
towerswatson.com/en/Insights/Newsletters/Americas/Insider/2014/
retirement-in-transition-for-the-fortune-500-1998-to-2013).
References
Amenc, N. and L. Martellini (2002). The Brave New World
of Hedge Fund Indices. EDHEC-Risk Institute Publication
(October).
Ang, A. (2014). Asset Management: A Systematic Approach
to Factor Investing. Oxford University Press.
Ang, A., W. Goetzmann and S. Schaefer (2009). Evaluation
of Active Management of the Norwegian GPFG. Norway:
Ministry of Finance.
Asness, C. S., T. J. Moskowitz and L. H. Pedersen (2013).
Value and Momentum Everywhere. Journal of Finance
68(3): 929–985.
efficient way for investors to harvest traditional
but also alternative beta exposures?”. With
respect to the second question, there are
reasons to believe that such low-cost alterna-
tives to hedge funds may prove a fruitful area
of investigation for asset managers and asset
owners.
The research from which this article was drawn
was produced as part of the Lyxor Asset Manage-
ment Risk Allocation Solutions research chair at
EDHEC-Risk Institute.](https://image.slidesharecdn.com/408a86a4-fcd0-432c-b5e6-0bfdfe528c78-160215130501/85/IPE-Article-4-320.jpg)


