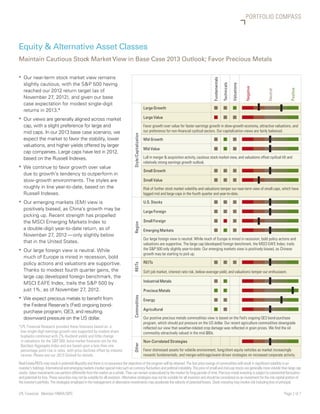
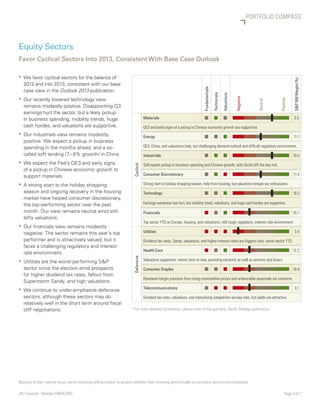
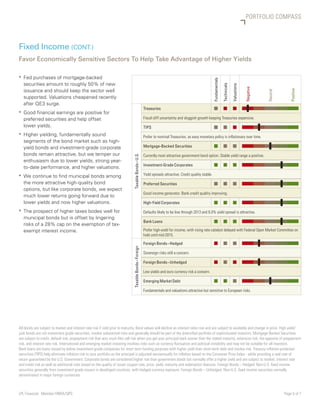
NAVIGATING THE MARKETS
No Compass Changes
Investment Takeaways
Our near-term stock market view remains slightly cautious, with the S&P 500 having reached our 2012 return target (as of November 27, 2012) and given our base case expectation for modest single-digit returns in 2013.*
We continue to favor cyclical sectors for the balance of 2012 and into 2013, consistent with our base case 2013 outlook.*
We continue to favor precious metals amid Quantitative Easing 3 (QE3), which we expect to weaken the US dollar.
Our emerging markets view is positively biased, as China’s growth is troughing.
Higher yielding segments of the bond market remain attractive, but we have tempered our enthusiasm.
Good financial earnings are positive for preferred securities and help offset lower yields.
We find municipal bonds among the more attractive high-quality bond options. The prospect of higher taxes bodes well, offset by lingering risks of a 28% cap on the exemption of tax-exempt interest income.
LPL Portfolio Compass | Navigating the Markets | 10/31/12JP Marketing | NE
Compass Changes
Downgraded technology to neutral/positive from positive.
Investment Takeaways
Our near-term stock market view remains slightly cautious, with the S&P
500 having returned 14% this year (as of October 30, 2012), above the
high end of our forecast.*
Our lowered technology view remains modestly positive. Disappointing
earnings results hurt the sector in October, although returns have matched
the S&P 500 in 2012 (as of October 30, 2012).
The document provides LPL Financial Research's views on various asset classes and sectors for investment purposes. Some of the key points from the summary are:
- The views remain cautiously neutral on stocks in the near term given the S&P 500's strong returns already this year. Precious metals are favored due to expectations that further quantitative easing will weaken the US dollar.
- Among equity sectors, cyclical sectors like materials, energy, industrials and technology are preferred. The materials view was recently upgraded on expectations that quantitative easing will boost commodity prices.
- In fixed income, intermediate bonds are favored over short term given expectations that interest rates will remain low. Economically sensitive bonds like high yield
Compass changes: Upgraded emerging markets view from Neutral to Neutral/Positive. Downgraded precious metals view from Positive to Neutral/Positive. Our near-term stock market view remains slightly cautious, with the S&P
• 500 having reached our 2012 return target (as of December 11, 2012) and given our base case expectation for modest single-digit returns in 2013.*
• We continue to favor cyclical sectors for the balance of 2012 and into 2013.
• Our upgraded emerging markets (EM) view is based on our expectation for better growth in China in 2013.
The Portfolio Compass provides a snapshot of LPL Financial Research’s views on equity & alternative asset classes, the equity sectors, and fixed income. This biweekly publication illustrates our current views and will change as needed over a three- to 12-month time horizon. | Compass Changes
Downgraded mortgage-backed securities (MBS) to Negative/Neutral
from Neutral.
Upgraded Bank Loans to Neutral/Positive from Neutral.
The Portfolio Compass provides a snapshot of LPL Financial Research’s views on equity & alternative asset classes, the equity sectors, and fixed income. This biweekly publication illustrates our current views and will change as needed over a three- to 12-month time horizon. | Compass Changes from last publication:
Upgraded energy commodity to Neutral/Positive from Neutral.
Upgraded preferred securities to Neutral/Positive from Neutral.
Upgraded mortgage-backed securities (MBS) to Neutral from Negative/Neutral.
Navigating the Markets 9/19/12 | The Portfolio Compass provides a snapshot of LPL Financial Research’s views on Equity & Alternative Asset Classes, the Equity Sectors, and Fixed Income. This biweekly publication illustrates our current views and will change as needed over a 3- to 12-month time horizon.
The document provides an overview and analysis of investment views from LPL Financial Research across various asset classes and sectors. Some key points:
- U.S. stocks remain favored over bonds, cash, and alternatives. Within equities, growth stocks are preferred over value, and economically sensitive sectors like technology and industrials are favored.
- Precious metals commodities were upgraded to positive due to prospects for more monetary stimulus from the Federal Reserve.
- In fixed income, economically sensitive sectors are favored for their higher yields compared to interest rate sensitive sectors like Treasuries. Municipal bonds remain attractively valued.
- The technology sector leads the S&P 500 year-to-date and was the top
There have been several important developments in the recent weeks. Sustained high inflation and RBI’s hawkish stance in light of it has fundamentally shifted the growth expectations downwards.
February was a significant and on the balance positive month for all Indian markets as well as the Indian economy. Here's a sneak peek at the markets and other facts required for the upcoming month.
The document provides an economic and market outlook for 2012, predicting that growth will bottom out in the first quarter of 2012 at 6% for India while inflation averages around 7%, and that monetary policy in India will start easing on the back of slowing growth and easing inflation. Globally, the outlook expects no recession in the US with growth around 2% and a tricky situation in Europe, while select emerging markets and exposure to crude oil, the US dollar, and select equities are recommended for investment.
Karvy Private Wealth’s newsletter ‘ADVICE for the WISE’ for August 2010 a ready reckoner for you to not only understand the key investment markets but also to help you make better investment choices.
It gives an overall picture of Equity, Debt, Insurance, Commodities, Forex Market, and global and domestic Economic updates.
Theory (Measuring Economic Perfromance)Alicia Fourie
This chapter discusses key economic concepts and how to measure macroeconomic outcomes. It covers goals, concepts, and definitions that are measured, as well as how and why they are measured. Specifically, it examines macroeconomic goals of economic growth, employment, price stability, external stability, and equitable income distribution. It provides definitions and methods for measuring GDP, unemployment, CPI, the balance of payments, and the Gini coefficient.
The document provides an overview and assessment of various global markets and asset classes in May 2012. It notes that the brief period of calm in European markets following ECB intervention had ended, with concerns shifting from Greece to problems in Spain. Fixed income investments are viewed negatively due to high debt levels and political uncertainty in Europe. Property prices are seen as neutral overall, with weakness in some areas offset by strength in others like Asia and London. US and Japanese equities are given negative and positive outlooks respectively, based on country-specific economic factors.
This document provides information about the IPO of Onelife Capital Advisors Ltd., including the price band, shareholding structure pre- and post-IPO, and financial details. It summarizes that Onelife is a loss-making financial services company planning an IPO to raise $7.48 million. While India's financial services sector has grown, the reviewer does not recommend subscribing to Onelife's IPO due to its losses, smaller size than peers, and expensive valuation relative to growth prospects and business risks.
The document provides an outlook on global markets and asset classes for May 2012 from The Henley Group. Key points include:
- The period of calm in European markets following ECB intervention was short-lived as concerns over Spain's debt resurfaced.
- Problems facing the global economy like high debt levels remain systemic and structural.
- Spanish debt levels and unemployment are high while property markets and banks are struggling.
- Many banks remain highly leveraged which could lead to insolvency if losses are incurred.
- Political changes in Europe may undermine austerity efforts, adding further uncertainty.
- Precious metals and miners' shares are recommended as long term holdings.
Income elasticity of demand and aspects of utilitylikepopulat
The document discusses income elasticity of demand and aspects of utility. It defines income elasticity of demand as the rate of responsiveness of demand to changes in consumer income. The formula for calculating income elasticity is presented as the percentage change in quantity demanded divided by the percentage change in income. Steps for calculating income elasticity using an example are provided, which involve determining the percentage changes in quantity demanded and income, then dividing the two. Income elasticity can be less than, equal to, or greater than one, indicating how responsive demand is to changes in income. Utility and its relationship to usefulness are also mentioned as topics discussed further in the document.
Get the most out of the NEW LinkedIn... until it changes... againJP Marketing | NE
LinkedIn has changed... in fact it has become a moving target and you need to understand how to leverage the new LinkedIn to your advantage. Learn about the new navigation bar, plus tips for creating and enhancing your profile and building your network. [Presentation given at the Enterprise Center, Salem State University, Salem MA]
Don't be dismayed by the slide count... simply download and use the search feature to target exactly what you're looking for.
NOTE: This is a high level overview.
Referrals and positive word-of-mouth are the most effective ways to build a network for prospective business opportunities, and LinkedIn is one of the most powerful tools available to you. See how LinkedIn can work for you and take home valuable tips for creating your profile and working your LinkedIn network for success. | Held at the Enterprise Center & Co-sponsored by MA Small Business Development Center.
[NOTE: This presentation leverages LinkedIn's soon to be obsolete profile view, hence some functionality will change with NEW profile view]
Social Media Marketing: For Your Business, Your Practice, YourselfJP Marketing | NE
7/22/16 - Professional Development Collaborative @CareerSource Cambridge
Savvy professionals use social media platforms to create a referral engine to network, confer with thought leaders, identify business collaborators, and mine for prospects. Referrals and positive word-of-mouth are the most effective ways to build a network for prospective business opportunities and employers. The new economy is all about networking and referrals. We are connected through an ecosystem of networks that, if used correctly, can multiply the effect of your business development or job search. A business “network” isn’t about how many people know your name; it’s about how many will send you opportunities.
With the demands of modern business, successful professionals, managers and executives must be as dynamic as the tools they use; 92% of employers are leveraging social media as part of their candidate search. And the majority of prospective clients will ‘GOOGLE’ a business or professional service provider before engaging. So whether you’re a business owner, startup, professional job seeker, or career changer, you’ll leave this workshop with tools and resources that you can implement immediately.
This workshop will cover:
• How to acquire new opportunities through online recommendations and word of mouth
• Keep in touch with people who care most about the services/products or skills you offer
• Build your industry network—online and in person
• Network with peers in your industry for repeat referrals
• Convince potential clients or employers of your expertise by sharing unique content; and
Grow Your Business on LinkedIn [Enterprise Center @SSU 6-8-16]JP Marketing | NE
Referrals and positive word-of-mouth are the most effective ways to build a network for prospective business opportunities and employers. The new economy is all about networking and referrals. We are connected through an ecosystem of networks that, if used correctly, can multiply the effect of your business development or job search. A business “network” isn’t about how many people know your name; it’s about how many will send you opportunities.
LinkedIn From The TOP - presented to ABLE AgeWorks [UPDATED]JP Marketing | NE
Did you know? It takes less than six seconds for an employer to review a job applicant’s profile and determine if a prospective candidate is worthy of future consideration.
With the demands of modern business, successful professionals, managers and executives must be as dynamic as the tools they use; 92% of employers are leveraging social media as part of their candidate search, and 87% say LinkedIn is the most important tool of choice. [UPDATED 4-14-16]
The document discusses how to build an effective LinkedIn profile. It notes that 94% of recruiters and hiring managers use LinkedIn to find candidates. With recruiters spending only 6 seconds scanning a profile, it is important to have a complete profile that stands out. The document provides tips on optimizing different parts of the profile, such as using a header image, writing a impactful keyword-rich summary, including accomplishments in the experience section, and using LinkedIn's advanced search and groups to build connections. The goal is to make job seekers findable and viewed as viable candidates by recruiters on LinkedIn.
Social Media and the Job Seeker Dos and Don'ts 11-16-15JP Marketing | NE
Overview of Social Media’s impact on job seeking
Major Dos and DON’Ts
The “Must Haves”
Best Practices
TAKE AWAYS
Practical Steps that can be implemented NOW to enhance your Online Presence
Reputation Management resources
Build & Nurture a Referral Network
Social Media Dos and Don’ts for the Job Seeker and Its Impact on Your Search ...JP Marketing | NE
** 6/9/15 Social Media Dos and Don’ts for the Job Seeker and Its Impact on Your Search. **
Social media has had a profound impact on job searching. And, it continues to evolve every day -¬‐ new players, new rules, and new opportunities. Judy Parisella will provide an insightful overview of social media’s impact on job seeking, and speak to the “must haves”, “Dos and Don’ts” and best practices in effectively using today’s social media. The intent of this session is to leave all attendees with practical steps that can be implemented immediately to move job search results forward.
(Presented at The Career Place, Woburn MA 6/9/15)
Social Media's Life and the JOB SEEKING
- Overview of Social Media’s impact on job seeking
- The “Must Haves”
- Best Practices
*** TAKE AWAYS ***
- Practical Steps that can be implemented NOW to enhance your Online Presence
- Reputation Management resources
- Build & Nurture a Referral Network
(Presentation Created for the Andover Networking Group)
Enhance your networking skills with a focus on LinkedInJP Marketing | NE
MDG Networking Event March 18, 2015
TOPIC: How to Effectively Network in
the 21st Century
Who should attend: Anyone who wants to better understand how to become a "Better Networker" when face to face with people and would like to learn how to "Effectively" use LinkedIn.
Since the wind-down of the Great Recession in early 2009, the latest economic expansion has certainly delivered the goods and rewarded investors’ mailboxes with six consecutive calendar years of positive gains for stocks. “Neither snow nor rain nor heat nor gloom of night” has kept a lid on the continuation of one of history’s greatest bull market advances for stocks, and LPL Financial Research believes this trend of rising equity prices may continue in 2015.
IMPORTANT DISCLOSURES
The opinions voiced in this material are for general information only and are not intended to provide or be construed as providing specific investment advice or recommendations for any individual security.
To determine which investments may be appropriate for you, consult your financial advisor prior to investing. All performance referenced is historical and is no guarantee of future results. All indexes are unmanaged and cannot be invested into directly.
Economic forecasts set forth may not develop as predicted, and there can be no guarantee that strategies promoted will be successful.
The Leading Economic Index (LEI) is an economic variable, such as private-sector wages, that tends to show the direction of future economic activity.
The Standard & Poor’s 500 Index is a capitalization-weighted index of 500 stocks designed to measure performance of the broad domestic economy through changes in the aggregate market value of 500 stocks representing all major industries.
The Barclays Aggregate Bond Index is an unmanaged market capitalization-weighted index of most intermediate-term U.S. traded investment-grade, fixed rate, non-convertible, and taxable bond market securities including government agency, corporate, mortgage-backed, and some foreign bonds.
NYSE Composite Index is an index that measure the performance of all stocks listed on the New York
Stock Exchange. The NYSE
Composite Index includes more than 1,900 stocks, of which over 1,500 are U.S. companies.
The Federal Open Market Committee (FOMC) is the branch of the Federal Reserve Board that determines the direction of monetary policy. The FOMC is composed of the board of governors, which has seven members, and five reserve bank presidents.
The Labor Market Conditions Index (LMCI) is a dynamic factor model of labor market indicators, which extracts the primary common variation from 19 labor market indicators. This tool was recently developed by the Federal Reserve.
Quantitative easing (QE) is a government monetary policy occasionally used to increase the money supply by buying government securities or other securities from the market. Quantitative easing increases the money supply by flooding financial institutions with capital in an effort to promote increased lending and liquidity.
Stocks Go From Great to Good as the Bull Turns FiveJP Marketing | NE
The end of this week will make it five years since the second most powerful bull market in post-WWII history began [Figure 1]. After five years, only the bull market that began on August 12, 1982 was stronger. It is not over yet. In fact, the bull market may be getting a second wind.
2013’s Top 10 Lessons for Investors from LPL Financial ResearchJP Marketing | NE
Each year that passes contains some wisdom for investors, but along with that wisdom can be some folly. 2013 was a year that bestowed an abundance of each on investors.
HIGHLIGHTS: The top 10 lessons of 2013 for investors need to be put into two categories: those that investors can take to heart as sound wisdom for the year to come, and those they should try to forget as they prepare for 2014.
Branding through social media - In Personal, Professional and Business Profiles
AGENDA
- What is Branding
- Why Social Media
- Branding Through Social Media
- Which Social Media Platforms – by the numbers
- Reputation Management
- Building the Profile
--- LinkedIn
--- Facebook
--- Twitter
* Monitor
--- YouTube
--- Pinterest
- Finding Content to Post
In 2013, many different forces will combine to influence the direction of the markets to follow the path of
least resistance leading to modest single-digit returns in the U.S. stock and bond markets.* The path for
the year may be set at the end of 2012, or in early 2013, as critical decisions are implemented: Details enclosed.
(Produced by LPL Research)
Social Media for The Job Seeker - Focus on LinkedInJP Marketing | NE
Social Media Profiles, Why Should They Matter? THINK ME 2.0! No Online presence? Your employability is diminished! You may even be considered 'invisible’! Now that would suk! Here’s a high level view of SOME things you could do to help make you visible!
11/1/12 - Election Poll Index reflected a modest further move toward Republican favored industries relative to those favored by Democrats, a move that began following the first Presidential debate.
This document discusses the importance of online reputation management and optimizing your LinkedIn profile. It notes that LinkedIn has over 175 million members from Fortune 500 companies and is the 26th most visited website. It emphasizes that your online profiles are the first impression for recruiters and hiring managers vetting candidates. The document provides tips for claiming and completing your LinkedIn profile, including using a professional photo, customizing your URL, adding relevant websites and skills, and joining groups to build your online influence and network.
Falcon stands out as a top-tier P2P Invoice Discounting platform in India, bridging esteemed blue-chip companies and eager investors. Our goal is to transform the investment landscape in India by establishing a comprehensive destination for borrowers and investors with diverse profiles and needs, all while minimizing risk. What sets Falcon apart is the elimination of intermediaries such as commercial banks and depository institutions, allowing investors to enjoy higher yields.
OJP data from firms like Vicinity Jobs have emerged as a complement to traditional sources of labour demand data, such as the Job Vacancy and Wages Survey (JVWS). Ibrahim Abuallail, PhD Candidate, University of Ottawa, presented research relating to bias in OJPs and a proposed approach to effectively adjust OJP data to complement existing official data (such as from the JVWS) and improve the measurement of labour demand.
The Rise and Fall of Ponzi Schemes in America.pptxDiana Rose
Ponzi schemes, a notorious form of financial fraud, have plagued America’s investment landscape for decades. Named after Charles Ponzi, who orchestrated one of the most infamous schemes in the early 20th century, these fraudulent operations promise high returns with little or no risk, only to collapse and leave investors with significant losses. This article explores the nature of Ponzi schemes, notable cases in American history, their impact on victims, and measures to prevent falling prey to such scams.
Understanding Ponzi Schemes
A Ponzi scheme is an investment scam where returns are paid to earlier investors using the capital from newer investors, rather than from legitimate profit earned. The scheme relies on a constant influx of new investments to continue paying the promised returns. Eventually, when the flow of new money slows down or stops, the scheme collapses, leaving the majority of investors with substantial financial losses.
Historical Context: Charles Ponzi and His Legacy
Charles Ponzi is the namesake of this deceptive practice. In the 1920s, Ponzi promised investors in Boston a 50% return within 45 days or 100% return in 90 days through arbitrage of international reply coupons. Initially, he paid returns as promised, not from profits, but from the investments of new participants. When his scheme unraveled, it resulted in losses exceeding $20 million (equivalent to about $270 million today).
Notable American Ponzi Schemes
1. Bernie Madoff: Perhaps the most notorious Ponzi scheme in recent history, Bernie Madoff’s fraud involved $65 billion. Madoff, a well-respected figure in the financial industry, promised steady, high returns through a secretive investment strategy. His scheme lasted for decades before collapsing in 2008, devastating thousands of investors, including individuals, charities, and institutional clients.
2. Allen Stanford: Through his company, Stanford Financial Group, Allen Stanford orchestrated a $7 billion Ponzi scheme, luring investors with fraudulent certificates of deposit issued by his offshore bank. Stanford promised high returns and lavish lifestyle benefits to his investors, which ultimately led to a 110-year prison sentence for the financier in 2012.
3. Tom Petters: In a scheme that lasted more than a decade, Tom Petters ran a $3.65 billion Ponzi scheme, using his company, Petters Group Worldwide. He claimed to buy and sell consumer electronics, but in reality, he used new investments to pay off old debts and fund his extravagant lifestyle. Petters was convicted in 2009 and sentenced to 50 years in prison.
4. Eric Dalius and Saivian: Eric Dalius, a prominent figure behind Saivian, a cashback program promising high returns, is under scrutiny for allegedly orchestrating a Ponzi scheme. Saivian enticed investors with promises of up to 20% cash back on everyday purchases. However, investigations suggest that the returns were paid using new investments rather than legitimate profits. The collapse of Saivian l
TEST BANK Principles of cost accounting 17th edition edward j vanderbeck mari...Donc Test
TEST BANK Principles of cost accounting 17th edition edward j vanderbeck maria r mitchell.docx
Dr. Alyce Su Cover Story - China's Investment Leadermsthrill
In World Expo 2010 Shanghai – the most visited Expo in the World History
https://www.britannica.com/event/Expo-Shanghai-2010
China’s official organizer of the Expo, CCPIT (China Council for the Promotion of International Trade https://en.ccpit.org/) has chosen Dr. Alyce Su as the Cover Person with Cover Story, in the Expo’s official magazine distributed throughout the Expo, showcasing China’s New Generation of Leaders to the World.
[4:55 p.m.] Bryan Oates
OJPs are becoming a critical resource for policy-makers and researchers who study the labour market. LMIC continues to work with Vicinity Jobs’ data on OJPs, which can be explored in our Canadian Job Trends Dashboard. Valuable insights have been gained through our analysis of OJP data, including LMIC research lead
Suzanne Spiteri’s recent report on improving the quality and accessibility of job postings to reduce employment barriers for neurodivergent people.
Decoding job postings: Improving accessibility for neurodivergent job seekers
Improving the quality and accessibility of job postings is one way to reduce employment barriers for neurodivergent people.
Tdasx: Interpreting the 2024 Cryptocurrency Market Funding Trends and Technol...
Portfolio compass 11/28/12
1. LPL FINANCIAL RESEARCH
Portfolio Compass
November 28, 2012
Navigating the Markets
Compass Changes
The Portfolio Compass provides a snapshot
of LPL Financial Research’s views on equity ƒƒ No changes.
& alternative asset classes, the equity
sectors, and fixed income. This biweekly Investment Takeaways
publication illustrates our current views
and will change as needed over a three- to ƒƒ Our near-term stock market view remains slightly cautious, with the S&P 500
12-month time horizon. having reached our 2012 return target (as of November 27 2012) and given our
,
base case expectation for modest single-digit returns in 2013.*
Reading the Portfolio Compass
ƒƒ We continue to favor cyclical sectors for the balance of 2012 and into 2013,
Fundamental, technical, and valuation
characteristics for each category are shown consistent with our base case 2013 outlook.*
by colored squares. ƒƒ We continue to favor precious metals amid Quantitative Easing 3 (QE3),
Negative, neutral, or positive views are which we expect to weaken the US dollar.
illustrated by a solid black bar positioned ƒƒ Our emerging markets view is positively biased, as China’s growth is troughing.
over the color scale, while an outlined black
bar with an arrow indicates change and ƒƒ Higher yielding segments of the bond market remain attractive, but we have
shows the previous view. tempered our enthusiasm.
Rationales for our views are provided ƒƒ Good financial earnings are positive for preferred securities and help offset
beneath each category. lower yields.
ƒƒ We find municipal bonds among the more attractive high-quality bond options.
* PL Financial Research provided these forecasts based on: a
L The prospect of higher taxes bodes well, offset by lingering risks of a 28%
low-single-digit earnings growth rate supported by modest share
buybacks combined with 2% dividend yields and little change cap on the exemption of tax-exempt interest income.
in valuations for the SP 500; bond market forecasts are for the ƒƒ The SP 500 has closed back above its 200-day simple moving average
Barclays Aggregate Index and are based upon a less than one
percentage point rise in rates, with price declines offset by interest (SMA) at 1383, establishing a short-term bullish price objective at the 50-day
income. Please see our 2013 Outlook for details. SMA at 1424.
Broad Asset Class Views
LPL Financial Research’s views on stocks, bonds, cash, and alternatives are illustrated below. The positions of negative, neutral,
or positive are indicated by the solid black compass needle, while an outlined needle shows a previous view.
N e u t r al N e u t r al N e u t r al N e u t r al
i ve
i ve
i ve
i ve
Po s
Po s
Po s
Po s
N e ga t
N e ga t
N e ga t
N e ga t
i t i ve
i t i ve
i t i ve
i t i ve
Stocks Bonds Cash Alternatives
Member FINRA/SIPC
Page 1 of 7
2. PORTFOLIO COMPASS
Equity Alternative Asset Classes
Maintain Cautious Stock Market View in Base Case 2013 Outlook; Favor Precious Metals
ƒƒ Our near-term stock market view remains
Fundamentals
slightly cautious, with the SP 500 having
Technicals
Valuations
Negative
reached our 2012 return target (as of
Positive
Neutral
November 27, 2012), and given our base
case expectation for modest single-digit
Large Growth n n n
returns in 2013.*
ƒƒ Our views are generally aligned across market Large Value n n n
cap, with a slight preference for large and Favor growth over value for faster earnings growth in slow-growth economy, attractive valuations, and
mid caps. In our 2013 base case scenario, we our preference for non-financial cyclical sectors. Our capitalization views are fairly balanced.
Style/Capitalization
expect the market to favor the stability, lower Mid Growth n n n
valuations, and higher yields offered by larger
Mid Value n n n
cap companies. Large caps have led in 2012,
based on the Russell Indexes. Lull in merger acquisition activity, cautious stock market view, and valuations offset cyclical tilt and
relatively strong earnings growth outlook.
ƒƒ We continue to favor growth over value
Small Growth n n n
due to growth’s tendency to outperform in
slow-growth environments. The styles are Small Value n n n
roughly in line year-to-date, based on the Risk of further stock market volatility and valuations temper our near-term view of small caps, which have
Russell Indexes. lagged mid and large caps in the fourth quarter and year-to-date.
ƒƒ Our emerging markets (EM) view is U.S. Stocks n n n
positively biased, as China’s growth may be
Large Foreign n n n
picking up. Recent strength has propelled
the MSCI Emerging Markets Index to Small Foreign n n n
Region
a double-digit year-to-date return, as of Emerging Markets n n n
November 27, 2012 — only slightly below
Our large foreign view is neutral. While much of Europe is mired in recession, bold policy actions and
that in the United States. valuations are supportive. The large cap (developed) foreign benchmark, the MSCI EAFE Index, trails
ƒƒ Our large foreign view is neutral. While the SP 500 only slightly year-to-date. Our emerging markets view is positively biased, as Chinese
growth may be starting to pick up.
much of Europe is mired in recession, bold
policy actions and valuations are supportive. REITs n n n
REITs
Thanks to modest fourth quarter gains, the Soft job market, interest rate risk, below-average yield, and valuations temper our enthusiasm.
large cap developed foreign benchmark, the
Industrial Metals n n
MSCI EAFE Index, trails the SP 500 by
just 1%, as of November 27, 2012. Precious Metals n n
ƒƒ We expect precious metals to benefit from
Commodities
Energy n n
the Federal Reserve’s (Fed) ongoing bond-
Agricultural n n
purchase program, QE3, and resulting
downward pressure on the US dollar. Our positive precious metals commodities view is based on the Fed’s ongoing QE3 bond-purchase
program, which should put pressure on the US dollar. Our recent agriculture commodities downgrade
* PL Financial Research provided these forecasts based on: a
L reflected our view that weather-related crop damage was reflected in grain prices. We find the oil
low-single-digit earnings growth rate supported by modest share commodity attractively valued in the mid-$80s.
buybacks combined with 2% dividend yields and little change
in valuations for the SP 500; bond market forecasts are for the Non-Correlated Strategies
Other
Barclays Aggregate Index and are based upon a less than one
percentage point rise in rates, with price declines offset by interest Favor distressed assets for volatile environment, long/short equity vehicles as market increasingly
income. Please see our 2013 Outlook for details. rewards fundamentals, and merger-arbitrage/event-driven strategies on increased corporate activity.
Real Estate/REITs may result in potential illiquidity and there is no assurance the objectives of the program will be attained. The fast price swings of commodities will result in significant volatility in an
investor's holdings. International and emerging markets involve special risks such as currency fluctuation and political instability. The price of small and mid-cap stocks are generally more volatile than large cap
stocks. Value investments can perform differently from the market as a whole. They can remain undervalued by the market for long periods of time. Precious metal investing is subject to substantial fluctuation
and potential for loss. These securities may not be suitable for all investors. Alternative strategies may not be suitable for all investors and should be considered as an investment for the risk capital portion of
the investor’s portfolio. The strategies employed in the management of alternative investments may accelerate the velocity of potential losses. Stock investing may involve risk including loss of principal.
LPL Financial Member FINRA/SIPC Page 2 of 7
3. PORTFOLIO COMPASS
Equity Sectors
Favor Cyclical Sectors Into 2013, Consistent With Base Case Outlook
ƒƒ We favor cyclical sectors for the balance of
SP 500 Weight (%)
2012 and into 2013, consistent with our base
Fundamentals
case view in the Outlook 2013 publication.
Technicals
Valuations
Negative
ƒƒ Our recently lowered technology view
Positive
Neutral
remains modestly positive. Disappointing Q3
earnings hurt the sector, but a likely pickup
in business spending, mobility trends, huge Materials n n n 3.5
cash hordes, and valuations are supportive. QE3 and early signs of a pickup in Chinese economic growth are supportive.
ƒƒ Our industrials view remains modestly Energy 11.1
n n n
positive. We expect a pickup in business
spending in the months ahead, and a so- QE3, China, and valuations help, but challenging demand outlook and difficult regulatory environment.
called soft landing (7 – 8% growth) in China. Industrials n n n 10.0
ƒƒ We expect the Fed’s QE3 and early signs Still expect pickup in business spending and Chinese growth, with fiscal cliff the key risk.
Cyclical
of a pickup in Chinese economic growth to
support materials. Consumer Discretionary n n n 11.4
ƒƒ A strong start to the holiday shopping Strong start to holiday shopping season, help from housing, but valuations temper our enthusiasm.
season and ongoing recovery in the housing Technology n n n 19.3
market have helped consumer discretionary,
the top-performing sector over the past Earnings weakness has hurt, but mobility trend, valuations, and huge cash hordes are supportive.
month. Our view remains neutral amid still- Financials n n n 15.1
lofty valuations.
Top sector YTD on Europe, housing, and valuations; still tough regulatory, interest rate environment.
ƒƒ Our financials view remains modestly
negative. The sector remains this year’s top Utilities n n n 3.4
performer and is attractively valued, but it Dividend tax rates, Sandy, valuations, and higher interest rates are biggest risks; worst sector YTD.
faces a challenging regulatory and interest
Health Care n n n 12.2
rate environment.
Defensive
ƒƒ Utilities are the worst-performing SP Valuations supportive; reform here to stay, providing certainty as well as winners and losers.
sector since the election amid prospects Consumer Staples n n n 10.9
for higher dividend tax rates, fallout from
Renewed margin pressure from rising commodities prices and unfavorable seasonals are concerns.
Superstorm Sandy, and high valuations.
ƒƒ We continue to under-emphasize defensive Telecommunications n n n 3.1
sectors, although these sectors may do Dividend tax rates, valuations, and intensifying competition are key risks, but yields are attractive.
relatively well in the short term around fiscal
cliff negotiations. * For more detailed information, please refer to the quarterly Sector Strategy publication.
Because of their narrow focus, sector investing will be subject to greater volatility than investing more broadly across many sectors and companies.
LPL Financial Member FINRA/SIPC Page 3 of 7
4. PORTFOLIO COMPASS
Fixed Income
Favor Economically Sensitive Sectors To Help Take Advantage of Higher Yields
ƒƒ We remain focused on intermediate bonds.
M ediu m I n t e r m e d ia t e
By committing to refrain from raising
interest rates until mid-2015, intermediate
maturity bonds may benefit from Fed policy
t
L ong
H ig h
L ow
S h or
as investors seek higher yields amid a low-
yield world.
ƒƒ A still-sluggish economy and uncertainty Credit Quality Duration
over the economic impact of the fiscal
cliff augur for a stable rate environment, Credit spreads still wide; prefer corporate bonds to Expect short rates to stay low and the yield curve to
which also favors intermediate bonds that government bonds. remain steep; favor intermediate maturities.
still possess a substantial yield advantage
relative to short-term bonds.
Fundamentals
Technicals
Valuations
Negative
Positive
Neutral
Munis – Short-term n n n
Muni curve is steep, and short-term yields are very low.
Munis – Intermediate-term n n n
Tax -Free Bonds
Valuations higher on prospects of higher taxes.
Munis – Long-term n n n
Valuations attractive on long-term basis. Yields at new record lows.
Munis – High-Yield n n n
Yield to be bigger driver of return. Defaults to remain isolated.
continued on next page
All bonds are subject to market and interest rate risk if sold prior to maturity. Bond values will decline as interest rates rise and are subject to availably and change in price. High yield/junk
bonds are not investment grade securities, involve substantial risks and generally should be part of the diversified portfolio of sophisticated investors. Municipal interest income may be subject
to the alternative minimum tax. Federally tax-free but other state and local taxes may apply. Corporate bonds are considered higher risk than government bonds but normally offer a higher yield
and are subject to market, interest rate and credit risk as well as additional risks based on the quality of issuer coupon rate, price, yield, maturity and redemption features.
LPL Financial Member FINRA/SIPC Page 4 of 7
5. PORTFOLIO COMPASS
Fixed Income (CONT.)
Favor Economically Sensitive Sectors To Help Take Advantage of Higher Yields
ƒƒ Fed purchases of mortgage-backed
Fundamentals
securities amount to roughly 50% of new
Technicals
Valuations
Negative
issuance and should keep the sector well
Positive
Neutral
supported. Valuations cheapened recently
after QE3 surge.
Treasuries n n n
ƒƒ Good financial earnings are positive for
preferred securities and help offset Fiscal cliff uncertainty and sluggish growth keeping Treasuries expensive.
lower yields. TIPS n n n
ƒƒ Higher yielding, fundamentally sound
Prefer to nominal Treasuries, as easy monetary policy is inflationary over time.
segments of the bond market such as high-
yield bonds and investment-grade corporate Mortgage-Backed Securities n n n
bonds remain attractive, but we temper our Currently most attractive government bond option. Stable yield range a positive.
Taxable Bonds – U.S.
enthusiasm due to lower yields, strong year-
Investment-Grade Corporates n n n
to-date performance, and higher valuations.
ƒƒ We continue to find municipal bonds among Yield spreads attractive. Credit quality stable.
the more attractive high-quality bond Preferred Securities n n n
options, but like corporate bonds, we expect
Good income generator. Bank credit quality improving.
much lower returns going forward due to
lower yields and now higher valuations. High-Yield Corporates n n n
ƒƒ The prospect of higher taxes bodes well for Defaults likely to be low through 2013 and 6.0% yield spread is attractive.
municipal bonds but is offset by lingering
Bank Loans n n n
risks of a 28% cap on the exemption of tax-
exempt interest income. Prefer high-yield for income, with rising rate catalyst delayed with Federal Open Market Committee on
hold until mid-2015.
Foreign Bonds – Hedged n n n
Taxable Bonds – Foreign
Sovereign risks still a concern.
Foreign Bonds – Unhedged n n n
Low yields and euro currency risk a concern.
Emerging Market Debt n n n
Fundamentals and valuations attractive but sensitive to European risks.
All bonds are subject to market and interest rate risk if sold prior to maturity. Bond values will decline as interest rates rise and are subject to availably and change in price. High yield/
junk bonds are not investment grade securities, involve substantial risks and generally should be part of the diversified portfolio of sophisticated investors. Mortgage Backed Securities
are subject to credit, default risk, prepayment risk that acts much like call risk when you get your principal back sooner than the stated maturity, extension risk, the opposite of prepayment
risk, and interest rate risk. International and emerging market investing involves risks such as currency fluctuation and political instability and may not be suitable for all investors.
Bank loans are loans issued by below investment grade companies for short term funding purposes with higher yield than short-term debt and involve risk. Treasury inflation-protected
securities (TIPS) help eliminate inflation risk to your portfolio as the principal is adjusted semiannually for inflation based on the Consumer Price Index - while providing a real rate of
return guaranteed by the U.S. Government. Corporate bonds are considered higher risk than government bonds but normally offer a higher yield and are subject to market, interest rate
and credit risk as well as additional risks based on the quality of issuer coupon rate, price, yield, maturity and redemption features. Foreign Bonds – Hedged: Non-U.S. fixed income
securities generally from investment grade issuers in developed countries, with hedged currency exposure. Foreign Bonds – Unhedged: Non-U.S. fixed income securities normally
denominated in major foreign currencies.
LPL Financial Member FINRA/SIPC Page 5 of 7
6. PORTFOLIO COMPASS
DEFINITIONS:
EQUITY AND ALTERNATIVES ASSET CLASSES
Large Growth: Stocks in the top 70% of the capitalization of the U.S. equity market are defined as Large Cap. Growth is defined based on fast growth (high growth rates for earnings,
sales, book value, and cash flow) and high valuations (high price ratios and low dividend yields).
Large Value: Stocks in the top 70% of the capitalization of the U.S. equity market are defined as Large Cap. Value is defined based on low valuations (low price ratios and high dividend
yields) and slow growth (low growth rates for earnings, sales, book value, and cash flow).
Mid Growth: The U.S. mid-cap range for market capitalization typically falls between $1 billion and $8 billion and represents 20% of the total capitalization of the U.S. equity market.
Growth is defined based on fast growth (high growth rates for earnings, sales, book value, and cash flow) and high valuations (high price ratios and low dividend yields).
Mid Value: The U.S. Mid Cap range for market capitalization typically falls between $1 billion and $8 billion and represents 20% of the total capitalization of the U.S. equity market. Value
is defined based on low valuations (low price ratios and high dividend yields) and slow growth (low growth rates for earnings, sales, book value, and cash flow).
Small Growth: Stocks in the bottom 10% of the capitalization of the U.S. equity market are defined as Small Cap. Growth is defined based on fast growth (high growth rates for earnings,
sales, book value, and cash flow) and high valuations (high price ratios and low dividend yields).
Small Value: Stocks in the bottom 10% of the capitalization of the U.S. equity market are defined as Small Cap. Value is defined based on low valuations (low price ratios and high
dividend yields) and slow growth (low growth rates for earnings, sales, book value, and cash flow).
U.S. Stocks: Stock of companies domiciled in the U.S.
Large Foreign: Large-cap foreign stocks have market capitalizations greater than $5 billion. The majority of the holdings in the large foreign category are in the MSCI EAFE Index.
Small Foreign: Small-cap foreign stocks typically have market capitalizations of $250M to $1B. The majority of the holdings in the small foreign category are in the MSCI Small Cap EAFE Index.
Emerging Markets: Stocks of a single developing country or a grouping of developing countries. For the most part, these countries are in Eastern Europe, Africa, the Middle East, Latin
America, the Far East and Asia.
REITs: REITs are companies that develop and manage real-estate properties. There are several different types of REITs, including apartment, factory-outlet, health-care, hotel, industrial,
mortgage, office, and shopping center REITs. This would also include real-estate operating companies.
Commodities – Industrial Metals: Stocks in companies that mine base metals such as copper, aluminum and iron ore. Also included are the actual metals themselves. Industrial metals
companies are typically based in North America, Australia, or South Africa.
Commodities – Precious Metals: Stocks of companies that do gold- silver-, platinum-, and base-metal-mining. Precious-metals companies are typically based in North America, Australia, or South Africa.
Commodities – Energy: Stocks of companies that focus on integrated energy, oil gas services, oil gas exploration and equipment. Public energy companies are typically based in North
America, Europe, the UK, and Latin America.
Merger Arbitrage is a hedge fund strategy in which the stocks of two merging companies are simultaneously bought and sold to create a riskless profit. A merger arbitrageur looks at
the risk that the merger deal will not close on time, or at all. Because of this slight uncertainty, the target company’s stock will typically sell at a discount to the price that the combined
company will have when the merger is closed. This discrepancy is the arbitrageur’s profit.
EQUITY SECTORS
Materials: Companies that engage in a wide range of commodity-related manufacturing. Included in this sector are companies that manufacture chemicals, construction materials, glass,
paper, forest products and related packaging products, metals, minerals and mining companies, including producers of steel.
Energy: Companies whose businesses are dominated by either of the following activities: The construction or provision of oil rigs, drilling equipment and other energy-related service and
equipment, including seismic data collection or the exploration, production, marketing, refining and/or transportation of oil and gas products, coal and consumable fuels.
Industrials: Companies whose businesses: Manufacture and distribute capital goods, including aerospace and defense, construction, engineering and building products, electrical
equipment and industrial machinery; provide commercial services and supplies, including printing, employment, environmental and office services; provide transportation services,
including airlines, couriers, marine, road and rail, and transportation infrastructure.
Consumer Discretionary: Companies that tend to be the most sensitive to economic cycles. Its manufacturing segment includes automotive, household durable goods, textiles and apparel, and
leisure equipment. The service segment includes hotels, restaurants and other leisure facilities, media production and services, consumer retailing and services and education services.
Technology: Companies that primarily develop software in various fields such as the Internet, applications, systems and/or database management and companies that provide information
technology consulting and services. Technology hardware equipment include manufacturers and distributors of communications equipment, computers and peripherals, electronic
equipment and related instruments, and semiconductor equipment and products.
Financials: Companies involved in activities such as banking, consumer finance, investment banking and brokerage, asset management, insurance and investment, and real estate, including REITs.
Utilities: Companies considered electric, gas or water utilities, or companies that operate as independent producers and/or distributors of power.
Healthcare: Companies in two main industry groups: Healthcare equipment and supplies or companies that provide healthcare-related services, including distributors of healthcare
products, providers of basic healthcare services, and owners and operators of healthcare facilities and organizations or companies primarily involved in the research, development,
production and marketing of pharmaceuticals and biotechnology products.
Consumer Staples: Companies whose businesses are less sensitive to economic cycles. It includes manufacturers and distributors of food, beverages and tobacco, and producers of non-
durable household goods and personal products. It also includes food and drug retailing companies.
Telecommunications: Companies that provide communications services primarily through a fixed line, cellular, wireless, high bandwidth and/or fiber-optic cable network.
FIXED INCOME
Credit Quality: An individual bond’s credit rating is determined by private independent rating agencies such as Standard Poor’s, Moody’s and Fitch. Their credit quality designations
range from high (‘AAA’ to ‘AA’) to medium (‘A’ to ‘BBB’) to low (‘BB’, ‘B’, ‘CCC’, ‘CC’ to ‘C’).
Duration: A measure of the sensitivity of the price (the value of principal) of a fixed-income investment to a change in interest rates. Duration is expressed as a number of years. Rising
interest rates mean falling bond prices, while declining interest rates mean rising bond prices. The bigger the duration number, the greater the interest-rate risk or reward for bond prices.
LPL Financial Member FINRA/SIPC Page 6 of 7
7. PORTFOLIO COMPASS
Munis – Short-term: Bonds issued by various state and local governments to fund public projects. The income from these bonds is generally free from federal taxes. These bonds generally
have maturities of less than three years.
Munis – Intermediate: Bonds issued by various state and local governments to fund public projects. The income from these bonds is generally free from federal taxes. These bonds
generally have maturities of between 3 and 10 years.
Munis – Long-term: Bonds issued by various state and local governments to fund public projects. The income from these bonds is generally free from federal taxes. These bonds generally
have maturities of more than 10 years.
Munis – High Yield: Bonds issued by various state and local governments to fund public projects. The income from these bonds is generally free from federal taxes. These bonds generally
offer higher yields than other types of bonds, but they are also more vulnerable to economic and credit risk. These bonds are rated BB+ and below.
Treasuries: A marketable, fixed-interest U.S. government debt security. Treasury bonds make interest payments semi-annually and the income that holders receive is only taxed at the federal level.
TIPS (Treasury Inflation Protected Securities): A special type of Treasury note or bond that offers protection from inflation. Like other Treasuries, an inflation-indexed security pays interest every six
months and pays the principal when the security matures. The difference is that the underlying principal is automatically adjusted for inflation as measured by the consumer price index (CPI).
Mortgage-Backed Securities: A type of asset-backed security that is secured by a mortgage or collection of mortgages. These securities must also be grouped in one of the top two ratings as
determined by a accredited credit rating agency, and usually pay periodic payments that are similar to coupon payments. Furthermore, the mortgage must have originated from a regulated and
authorized financial institution.
Investment-Grade Corporates: Securities issued by corporations with a credit ratning of BBB- or higher. Bond rating firms, such as Standard Poor’s, use different designations consisting of upper- and
lower-case letters ‘A’ and ‘B’ to identify a bond’s investment grade credit quality rating. ‘AAA’ and ‘AA’ (high credit quality) and ‘A’ and ‘BBB’ (medium credit quality) are considered investment grade.
Preferred Stocks: A class of ownership in a corporation that has a higher claim on the assets and earnings than common stock. Preferred stock generally has a dividend that must be paid
out before dividends to common stockholders and the shares usually do not have voting rights.
High-Yield Corporates: Securities issued by corporations with a credit rating of BB+ and below. These bonds generally offer higher yields than investment grade bonds, but they are also
more vulnerable to economic and credit risk.
Bank Loans: In exchange for their credit risk, these floating-rate bank loans offer interest payments that typically float above a common short-term benchmark such as the London
interbank offered rate, or LIBOR.
Foreign Bonds – Hedged: Non-U.S. fixed income securities generally from investment grade issuers in developed countries, with hedged currency exposure.
Foreign Bonds – Unhedged: Non-U.S. fixed income securities normally denominated in major foreign currencies.
Emerging Market Debt: The debt of sovereigns, agencies, local issues, and corporations of emerging markets countries and subject to currency risk.
IMPORTANT DISCLOSURES
The opinions voiced in this material are for general information only and are not intended to provide or be construed as providing specific investment advice or recommendations for any
individual. To determine which investments may be appropriate for you, consult your financial advisor prior to investing. All performance referenced is historical and is no guarantee of
future results. All indexes are unmanaged and cannot be invested into directly.
Past performance is no guarantee of future results.
Stock investing involves risk including loss of principal.
The Standard Poor’s 500 Index is a capitalization-weighted index of 500 stocks designed to measure performance of the broad domestic economy through changes in the aggregate
market value of 500 stocks representing all major industries.
MSCI EAFE is made up of approximately 1,045 equity securities issued by companies located in 19 countries and listed on the stock exchanges of Europe, Australia, and the Far East. All
values are expressed in U.S. dollars. All values are expressed in US dollars. Past performance is no guarantee of future results.
The Russell 1000 Index consists of the 1,000 largest securities in the Russell 3000 Index, which represents 90% of the total market capitalization of the Russell 3000 Index. It is a large-
cap, market oriented index and is highly correlated with the SP 500 Index.
The Russell 2500 Index is a broad index featuring 2,500 stocks that cover the small and mid cap market capitalizations. The Russell 2500 is a market cap weighted index that includes the
smallest 2,500 companies covered in the Russell 3000 universe of United States-based listed equities.
The Russell 3000 Index measures the performance of the 3,000 largest U.S. companies based on total market capitalization, which represents approximately 98% of the investable U.S.
equity market. As of the latest reconstitution, the average market capitalization was approximately $4 billion; the median market capitalization was approximately $700 million. The index
had a total market capitalization range of approximately $309 billion to $128 million.
Quantitative Easing is a government monetary policy occasionally used to increase the money supply by buying government securities or other securities from the market. Quantitative
easing increases the money supply by flooding financial institutions with capital in an effort to promote increased lending and liquidity.
This research material has been prepared by LPL Financial.
To the extent you are receiving investment advice from a separately registered independent investment advisor, please note that LPL Financial is not
an affiliate of and makes no representation with respect to such entity.
Not FDIC or NCUA/NCUSIF Insured | No Bank or Credit Union Guarantee | May Lose Value | Not Guaranteed by any Government Agency | Not a Bank/Credit Union Deposit
Member FINRA/SIPC
Page 7 of 7
RES 3989 1112
Tracking #1-121421 (Exp. 11/13)